100% /usr/local/sbin/check_reload_status after gateway down
-
I have the same issue on CE 2.7.0-RELEASE. I installed WireGuard and FRR Packages a couple of days ago (running 2 wireguard VPNs with OSPF), after which it started. Possibly process check_reload_status is using 100% after interface flap, but am not 100% sure. Shutting and no shutting an interface did not reproduce the problem. Manually restarting services in the UI did not work, as well as restarting the WebConfigurator. After using kill -9 I managed to end the process without rebooting. I am aware WireGuard is still under development, but maybe a fix can be found.
-
So you were not using OpenVPN when this started? And after killing it it didn't return?
-
@stephenw10 No, I restarted ovpn service, and nothing changed. Next time this happens I will a stop the ovpn service for a couple of minutes to see if the behavior changes.
-
This just happened to me on CE 2.7.0 on the backup CARP node. Have OpenVPN and Wireguard both. OpenVPN was stopped (due to being the backup node). Stopped Wireguard, no change.
kill -9the process and it came back but at 0% usage. Rebooted anyway to make sure the node is not in a weird state in case I need it.Edit: looks like CARP was flapping between master and backup for a minute right before this happened. Will dig into that.
-
Mmm, check the logs when that happened for anything unusual. Flapping interfaces could cause it to queue a number of events. Perhaps hit some race condition....
-
Netgate 3100,
23.05-RELEASE (arm)
built on Mon May 22 15:04:22 UTC 2023
FreeBSD 14.0-CURRENTThings have turned worse for me today.
It started as usual, with a very brief connectivity loss on the secondary gateway (ADSL):Dec 7 08:58:46 netgate ppp[5225]: [opt1_link0] PPPoE: connection closed Dec 7 08:58:46 netgate ppp[5225]: [opt1_link0] Link: DOWN event Dec 7 08:58:46 netgate ppp[5225]: [opt1_link0] LCP: Down event Dec 7 08:58:46 netgate ppp[5225]: [opt1_link0] LCP: state change Opened --> Starting Dec 7 08:58:46 netgate ppp[5225]: [opt1_link0] Link: Leave bundle "opt1" Dec 7 08:58:46 netgate ppp[5225]: [opt1] Bundle: Status update: up 0 links, total bandwidth 9600 bps Dec 7 08:58:46 netgate ppp[5225]: [opt1] IPCP: Close event Dec 7 08:58:46 netgate ppp[5225]: [opt1] IPCP: state change Opened --> Closing Dec 7 08:58:46 netgate ppp[5225]: [opt1] IPCP: SendTerminateReq #12 Dec 7 08:58:46 netgate ppp[5225]: [opt1] IPCP: LayerDown Dec 7 08:58:47 netgate check_reload_status[24910]: Rewriting resolv.conf Dec 7 08:58:47 netgate ppp[5225]: [opt1] IFACE: Removing IPv4 address from pppoe0 failed(IGNORING for now. This should be only for PPPoE friendly!): Can't assign requested address Dec 7 08:58:47 netgate ppp[5225]: [opt1] IFACE: Down event Dec 7 08:58:47 netgate ppp[5225]: [opt1] IFACE: Rename interface pppoe0 to pppoe0 Dec 7 08:58:47 netgate ppp[5225]: [opt1] IFACE: Set description "WAN2" Dec 7 08:58:47 netgate ppp[5225]: [opt1] IPCP: Down event Dec 7 08:58:47 netgate ppp[5225]: [opt1] IPCP: LayerFinish Dec 7 08:58:47 netgate ppp[5225]: [opt1] Bundle: No NCPs left. Closing links... Dec 7 08:58:47 netgate ppp[5225]: [opt1] IPCP: state change Closing --> Initial Dec 7 08:58:47 netgate ppp[5225]: [opt1] Bundle: Last link has gone, no links for bw-manage definedSince this point CPU usage went up from about 15% to 60% and stayed there.
Warning threshold in our monitoring is set to 90%. It hasn't been reached once, so nobody noticed.
3 days later this happened:Dec 10 10:10:05 netgate kernel: [zone: mbuf_cluster] kern.ipc.nmbclusters limit reached ---> MONITORING STARTED PICKING UP ISSUES Dec 10 10:14:16 netgate kernel: sonewconn: pcb 0xe2f8a000 (192.168.8.1:3128 (proto 6)): Listen queue overflow: 193 already in queue awaiting acceptance (1 occurrences), euid 0, rgid 62, jail 0 Dec 10 10:15:05 netgate kernel: [zone: mbuf_cluster] kern.ipc.nmbclusters limit reached Dec 10 10:15:16 netgate kernel: sonewconn: pcb 0xe2f8a000 (192.168.8.1:3128 (proto 6)): Listen queue overflow: 193 already in queue awaiting acceptance (250 occurrences), euid 0, rgid 62, jail 0 (...) Dec 10 11:00:21 netgate kernel: sonewconn: pcb 0xe2f8a000 (192.168.8.1:3128 (proto 6)): Listen queue overflow: 193 already in queue awaiting acceptance (18 occurrences), euid 0, rgid 62, jail 0 Dec 10 11:00:25 netgate kernel: sonewconn: pcb 0xe4a4f800 (127.0.0.1:3128 (proto 6)): Listen queue overflow: 193 already in queue awaiting acceptance (4 occurrences), euid 0, rgid 62, jail 0 Dec 10 11:05:06 netgate kernel: [zone: mbuf_cluster] kern.ipc.nmbclusters limit reached Dec 10 11:10:06 netgate kernel: [zone: mbuf_cluster] kern.ipc.nmbclusters limit reached Dec 10 11:15:07 netgate kernel: [zone: mbuf_cluster] kern.ipc.nmbclusters limit reached Dec 10 11:20:07 netgate kernel: [zone: mbuf_cluster] kern.ipc.nmbclusters limit reached ---> FIREWALL BECAME COMPLETELY UNRESPONSIVE AND REQUIRED POWER CYCLINGHas this issue been properly addressed in the latest release 23.09.1?
If so, can I still install it on Netgate 3100? -
Nothing has been specifically added to address that AFAIK. But you should upgrade to 23.09.1 to make sure the behavior exists there. Or doesn't.
-
I will upgrade to 23.09.1 some time between Xmas and New Year.
I'm assuming than all future releases will apply to Netgate 3100 as long as FreeBSD Version is still 14.0, correct?
-
As long as it builds we will try to build it. At some point it's going to become nonviable though.
-
Hello!
I have several boxes on 23.05.1 with this problem, and it can run undetected until something goes really bad.
I run a simple command at Diagnostics -> Command Prompt as a quick check for the issue :
ps -Ao comm,pcpu | grep "check_reload_status" | awk '$2 > 10'No output means check_reload_status is not using more than 10% cpu.
I setup the mailreport and cron packages to run this command every minute and send me an email if check_reload_status is "overloaded".
Make sure the report is skippable ("Skip If No Content") in the mailreport config.
The cron package can be used after setting up or changing the mailreport to specify a more frequent run than once per day.
John
-
Have you tested that in 23.09.1?
-
@serbus
Great suggestion !
Just set this up on my 23.09.1
We'll see how it behaves. -
@adamw said in 100% /usr/local/sbin/check_reload_status after gateway down:
Dec 10 10:10:05 netgate kernel: [zone: mbuf_cluster] kern.ipc.nmbclusters limit reached   ---> MONITORING STARTED PICKING UP ISSUES
Dec 10 10:14:16 netgate kernel: sonewconn: pcb 0xe2f8a000 (192.168.8.1:3128 (proto 6)): Listen queue overflow: 193 already in queue awaiting acceptance (1 occurrences), euid 0, rgid 62, jail 0
Dec 10 10:15:05 netgate kernel: [zone: mbuf_cluster] kern.ipc.nmbclusters limit reached
Dec 10 10:15:16 netgate kernel: sonewconn: pcb 0xe2f8a000 (192.168.8.1:3128 (proto 6)): Listen queue overflow: 193 already in queue awaiting acceptance (250 occurrences), euid 0, rgid 62, jail 0
(...)
Dec 10 11:00:21 netgate kernel: sonewconn: pcb 0xe2f8a000 (192.168.8.1:3128 (proto 6)): Listen queue overflow: 193 already in queue awaiting acceptance (18 occurrences), euid 0, rgid 62, jail 0
Dec 10 11:00:25 netgate kernel: sonewconn: pcb 0xe4a4f800 (127.0.0.1:3128 (proto 6)): Listen queue overflow: 193 already in queue awaiting acceptance (4 occurrences), euid 0, rgid 62, jail 0
Dec 10 11:05:06 netgate kernel: [zone: mbuf_cluster] kern.ipc.nmbclusters limit reached
Dec 10 11:10:06 netgate kernel: [zone: mbuf_cluster] kern.ipc.nmbclusters limit reached
Dec 10 11:15:07 netgate kernel: [zone: mbuf_cluster] kern.ipc.nmbclusters limit reached
Dec 10 11:20:07 netgate kernel: [zone: mbuf_cluster] kern.ipc.nmbclusters limit reached ---> FIREWALL BECAME COMPLETELY UNRESPONSIVE AND REQUIRED POWER CYCLINGRight, so this crash wasn't caused by check_reload_status and high CPU usage.
It happened again today:
Dec 13 17:08:04	kernel		[zone: mbuf_cluster] kern.ipc.nmbclusters limit reached
Dec 13 17:10:36	kernel		sonewconn: pcb 0xe2939c00 (192.168.8.1:3128 (proto 6)): Listen queue overflow: 193 already in queue awaiting acceptance (1 occurrences), euid 0, rgid 62, jail 0
Dec 13 17:11:37	kernel		sonewconn: pcb 0xe2939c00 (192.168.8.1:3128 (proto 6)): Listen queue overflow: 193 already in queue awaiting acceptance (998 occurrences), euid 0, rgid 62, jail 0
Dec 13 17:12:37	kernel		sonewconn: pcb 0xe2939c00 (192.168.8.1:3128 (proto 6)): Listen queue overflow: 193 already in queue awaiting acceptance (520 occurrences), euid 0, rgid 62, jail 0
(...)
This is the trigger:
export HTTP_PROXY=http://192.168.8.1:3128
export HTTPS_PROXY=http://192.168.8.1:3128
aws s3 cp --profile xxx xxx.gz s3://xxx/xxx.gz --grants read=uri=http://acs.amazonaws.com/groups/global/AllUsers --only-show-errors
upload failed: ./xxx.gz to s3://xxx/xxx.gz HTTPSConnectionPool(host='xxx.s3.amazonaws.com', port=443): Max retries exceeded with url: /xxx.gz?uploadId=2Np0o_30Su5ZrxamVzMYX.LQkPVMog7PupvQTUByny25FOXr7_9Jnz2cXvm0c3xxQ9I6qUPISyhwHhIc63lnlg0nzxiafHs93P_d8qJW3ImmEGyPO3GS0HXRDxcvclWp&partNumber=37 (Caused by ProxyError('Cannot connect to proxy.', ConnectionResetError(104, 'Connection reset by peer')))
Squid doesn't seem to have logged anything.
Has anybody seen it before?
-
@adamw said in 100% /usr/local/sbin/check_reload_status after gateway down:
kernel: [zone: mbuf_cluster] kern.ipc.nmbclusters limit reached
That is a problem. The firewall has exhausted the mbufs which will impact all traffic through it.
What does this show for the current available and used mbufs:
netstat -m -
# netstat -m 3255/1815/5070 mbufs in use (current/cache/total) 1590/940/2530/10035 mbuf clusters in use (current/cache/total/max) 1590/940 mbuf+clusters out of packet secondary zone in use (current/cache) 1/758/759/5017 4k (page size) jumbo clusters in use (current/cache/total/max) 0/0/0/1486 9k jumbo clusters in use (current/cache/total/max) 0/0/0/836 16k jumbo clusters in use (current/cache/total/max) 3997K/5365K/9363K bytes allocated to network (current/cache/total) 0/0/0 requests for mbufs denied (mbufs/clusters/mbuf+clusters) 0/0/0 requests for mbufs delayed (mbufs/clusters/mbuf+clusters) 0/0/0 requests for jumbo clusters delayed (4k/9k/16k) 0/0/0 requests for jumbo clusters denied (4k/9k/16k) 0/6/6656 sfbufs in use (current/peak/max) 0 sendfile syscalls 0 sendfile syscalls completed without I/O request 0 requests for I/O initiated by sendfile 0 pages read by sendfile as part of a request 0 pages were valid at time of a sendfile request 0 pages were valid and substituted to bogus page 0 pages were requested for read ahead by applications 0 pages were read ahead by sendfile 0 times sendfile encountered an already busy page 0 requests for sfbufs denied 0 requests for sfbufs delayed -
Hmm OK, well that looks fine there.
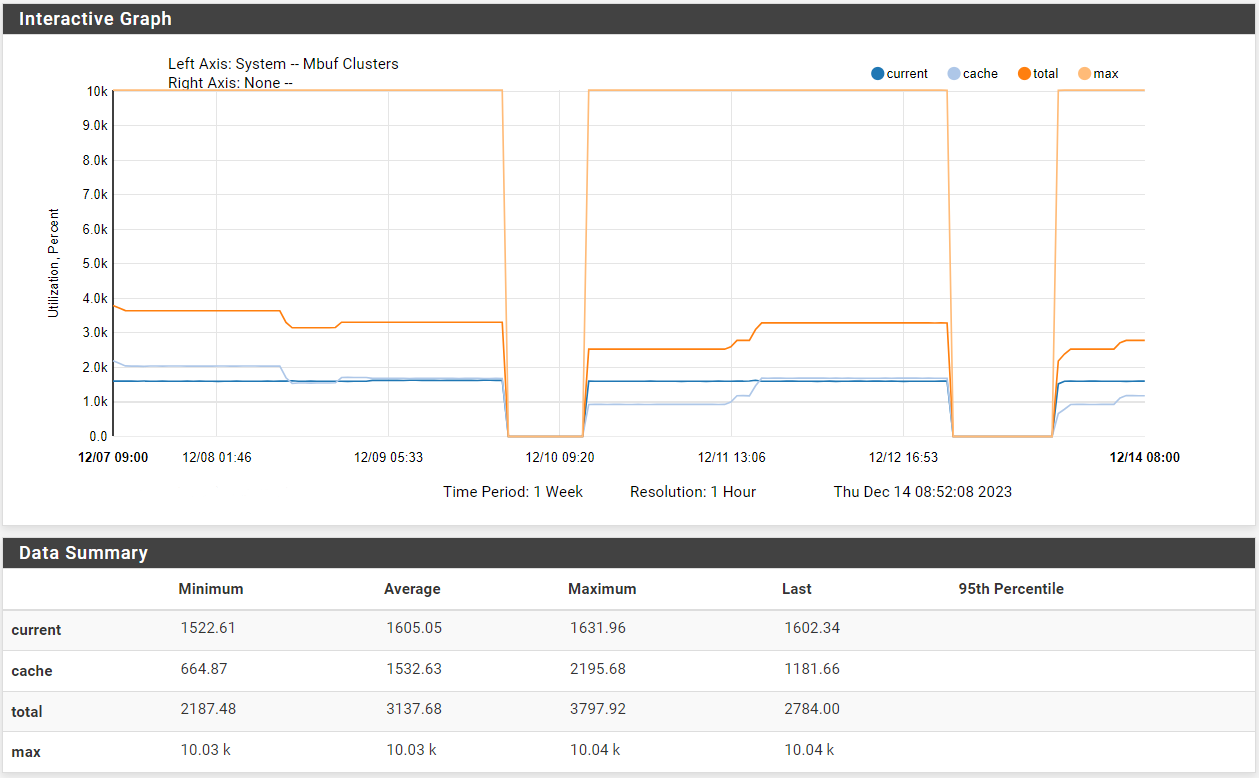
Check the historical mbuf usage in Status > Monitoring.
-
-
Hmm, the total never get's near the max though.
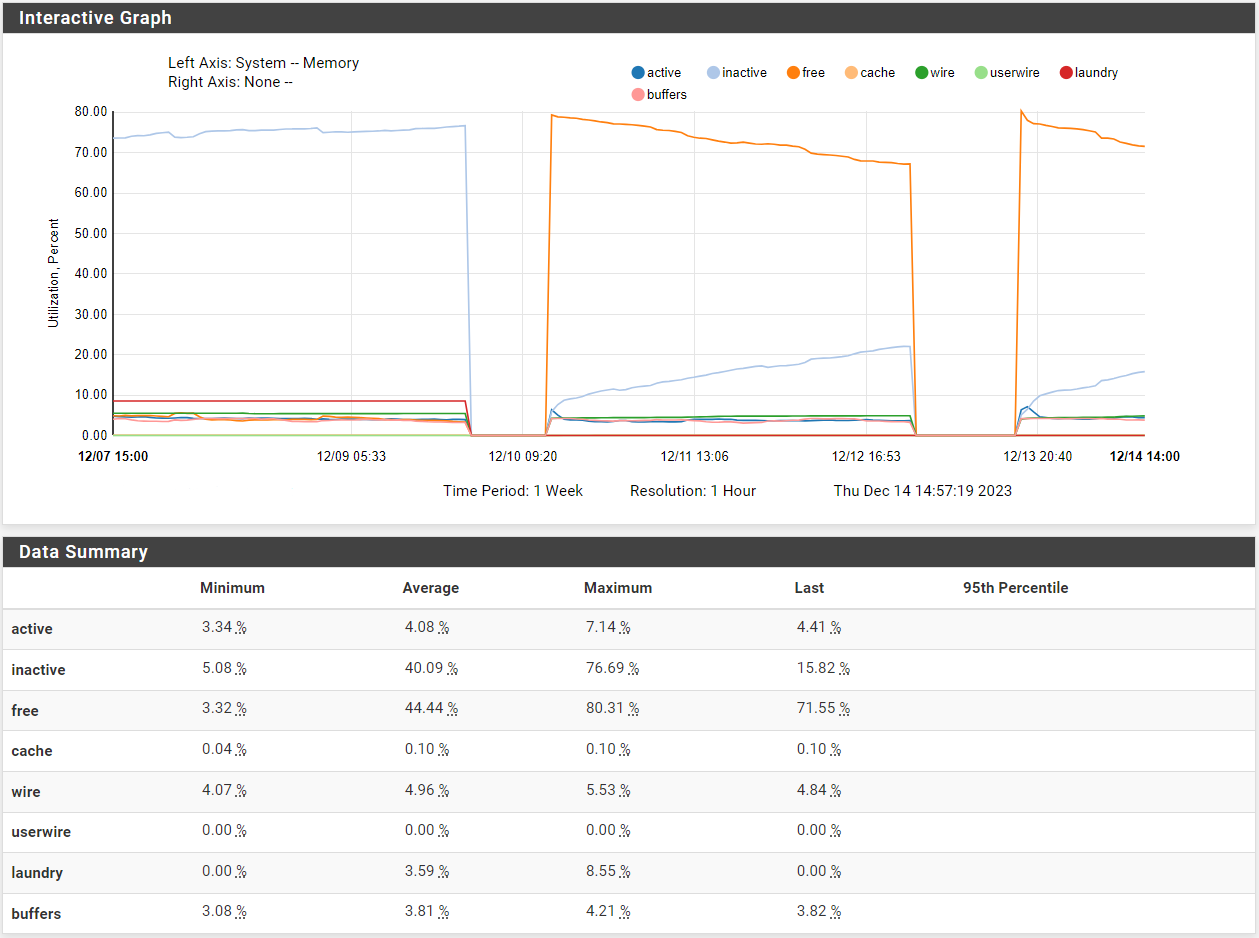
Check the memory usage over that time. It may be unable to use mbufs if the ram is unavailable.
-
-
Hmm, so using memory but no where near used.
Nothing else logged when it fails?