PF Sense network monitoring tool graph recommendation
-
Hello everyone, I need a recommendation on how to monitor device usage on my home network as I have a data cap. Specifically, how many Gigs every device is using at any given time. An easy-to-view graph would be great. Hope this is the right spot to post about this.
I looked into the options there and I couldn't get the ntopng plugin to work properly with Grafana or influx and after several attempts, I stopped.
Recently needing the monitoring has become an issue again as I am getting alerts from my ISP that I am reaching my data cap and about to go over (which means I get charged if I exceed the limit). Due to numerous reasons jumping on another plan, w/the ISP isn't an option.
When looking at the ISP bill data usage alerts it showed I was using data when I was away from home for a week and a half. No one else was at my house and I wasn't remoting in. There was only 1 PC on when I was away so if anything it might have been updates for that 1 PC, but I doubt it. Something is using my data and I am trying to figure out the best way to see all devices and what data is being pulled from each. I would like to get ntop and Grafana to display something useful but am hesitant to start that again. Most of the time we never exceed the data limit which is why I would like to find a solution to this with easy-to-read graphs (one reason I mention Grafana).
Among my previous attempts, I came across this article here, https://www.unknownfault.com/posts/homelab-monitor-traffic/
I tried that but at the time the plugin for ntop didnt work properly either. This graph that is displayed in that link, is what I am after, how it mentions the device and you can see the bandwidth but I would like to see gigs per device and even as granular as looking by day and time if needed. If possible, what applications on the devices w/the most usage.I know PF sense has many different plugins such as Bandwidth D, DarkStat, Netflow and I have a few of those setup but I don't use them much and I would like to figure out an easy-to-view monitoring solution. Especially something I can track continuously and go back over a month or a few weeks at a time. If I can get those plugins to work w/grafana great but I am not sure how.
My guess is I am at a loss trying to get something so granular, but I am not sure what to do anymore. The ISP has a chart but its not as granular as it should be to figure out exactly what may be causing the issue and I have tried to match up days and times and that is how i started to see i wasn't home for a lot of it.
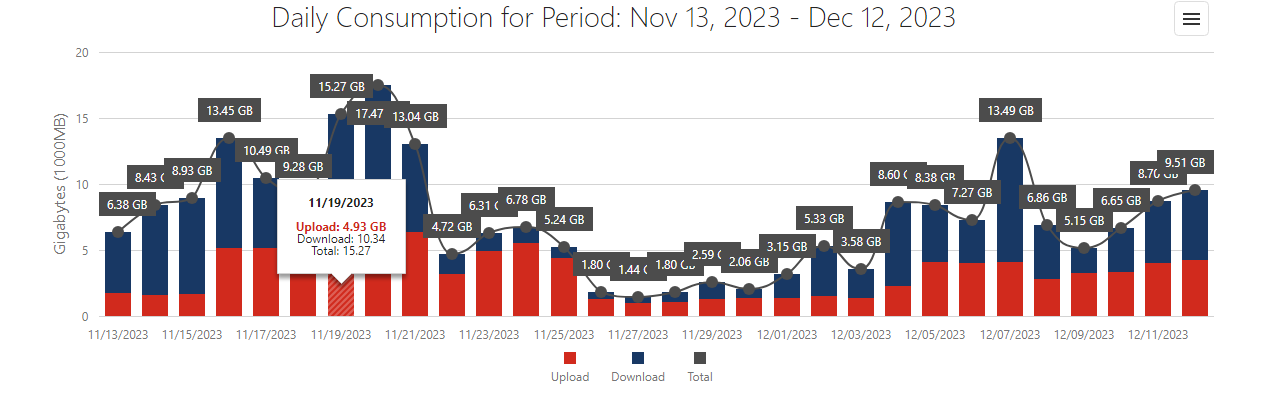
To give an idea here is what I see when i login to the ISP data usage.
PFSense handles everything from ad blocking to DHCP/DNS/Gateway. In no particular order, is a description of whats on my network.
My modem is in bridge mode just to hand off the internet to PF Sense.
My network consists of modem (in bridge mode) plugged into my Dell 3020 PF Sense box, plugged into my Netgear GS324 switch.Aside from those items, within my network are 3 Unifi APs (1 AC Pro, 2- AC Pros) -all of which are discontinued and can't receive updates/firmware.
2 wireless speakers, 2 cell phones, a wireless printer, 3 PCs (wireless and hard-wired), 1 24port Cisco 2960 POE switch, and 1 dumb switch is needed to connect the 2960 to the modem and few other devices (gaming system, small baby monitor camera, smart TVs) and 2 NASs.
I don't really want to spend money to upgrade to a new router to get a detailed usage graph of what i need and go away from PFsense. I do like pf sense.
Any help is appreciated. Maybe I am missing something or am just going after something that isnt realistic but figured i'd ask for a recommendation/advice if any. Thanks in advance.