LAN Errors - Pinpoint
-
Hey guys,
I have a question with respect to pinpointing LAN errors. I noted on my PFSense that on my network statistics I have the errors as noted below, currently 102, which is by no means a big deal considering the overall packets processed. Note, this is with an uptime of 9 days.
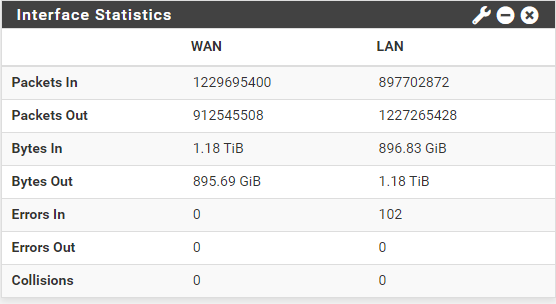
Is there a way to better pinpointing the issues, such as which device on my network has transmitted bad data etc ? I know sometimes this can be down to a bad cable or bad NIC but with PFsense, I am just unsure how to locate the problematic device.
Many Thanks,
P -
@panzerscope said in LAN Errors - Pinpoint:
Is there a way to better pinpointing the issues,
The logs period...
-
@NollipfSense said in LAN Errors - Pinpoint:
@panzerscope said in LAN Errors - Pinpoint:
Is there a way to better pinpointing the issues,
The logs period...
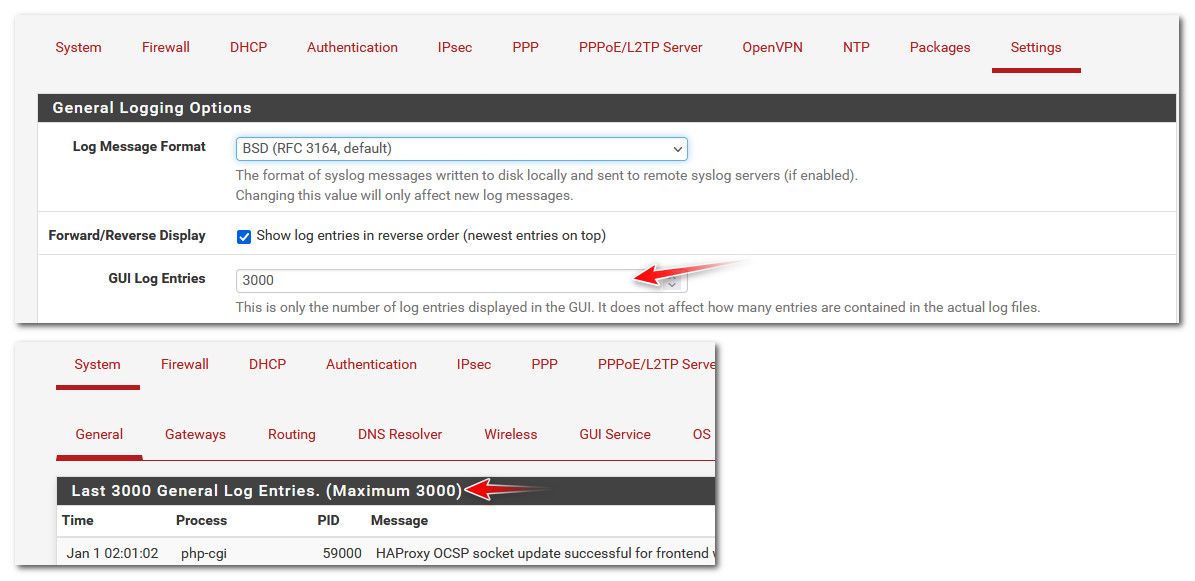
Well, for sure, but is there a way of easily filtering the system log to pinpoint it , rather than sifting through ? Is there also a way to increase the system log count, looks like there is a maximum of 1000, not sure if that is a hard limit or if it can be increased.
Thanks,
-
@panzerscope said in LAN Errors - Pinpoint:
, looks like there is a maximum of 1000, not sure if that is a hard limit or if it can be increased.
What version are you on - it hasn't been that for long time.
you have 102 errors out of what is that almost 900 million packets.. I wouldn't be too concerned.. Is the number constantly going up?
-
Thanks for the guidance. I am on version 2.7.2, the latest. I can only imagine that during the upgrade that value was not auto changed ? Either way I have set it to my desired value in the settings area :) I will have a look through the log entries but I think you are right, 102 errors out of as many packets that have been processed is tiny and likely not worth investigating too deeply. The errored packets are not growing, seems to have been at 102 for a while now, so whatever caused the initial issue must have been temporary/rectified itself.
-
@panzerscope yeah unless that number is going up regular I wouldn't be too concerned.. You can always flush the stats and keep an eye on it.. Could of been some oddness with wireless packets - do you have wireless devices that connect to this interface via AP? Or could of been a nic of client acting up on turn up or shutdown, etc.
Even if the overall number is low - if it was increasing at some rate even if only a few a day, it would get me curious to what it was ;)
-
@johnpoz said in LAN Errors - Pinpoint:
@panzerscope yeah unless that number is going up regular I wouldn't be too concerned.. You can always flush the stats and keep an eye on it.. Could of been some oddness with wireless packets - do you have wireless devices that connect to this interface via AP? Or could of been a nic of client acting up on turn up or shutdown, etc.
Even if the overall number is low - if it was increasing at some rate even if only a few a day, it would get me curious to what it was ;)
My firewall has no wireless capability itself and is plugged directly into my switch, though I do have wireless AP's that I use that will obviously go through the firewall. I think it could be my main PC causing the errored packets. I have had to manually reset my network adapters a few times for Windows to play ball, no idea why (likely drivers), that could have caused bad packets. When I have a moment I will drill through the logs and see if I am right :P
-
Check the MAC stats in the sysctl output. The errors there are shown by type. For example in igb:
[2.7.2-RELEASE][admin@t70.stevew.lan]/root: sysctl dev.igb.0.mac_stats
dev.igb.0.mac_stats.tso_ctx_fail: 0
dev.igb.0.mac_stats.tso_txd: 0
dev.igb.0.mac_stats.tx_frames_1024_1522: 4687
dev.igb.0.mac_stats.tx_frames_512_1023: 2618
dev.igb.0.mac_stats.tx_frames_256_511: 7200
dev.igb.0.mac_stats.tx_frames_128_255: 27786
dev.igb.0.mac_stats.tx_frames_65_127: 75559
dev.igb.0.mac_stats.tx_frames_64: 722390
dev.igb.0.mac_stats.mcast_pkts_txd: 0
dev.igb.0.mac_stats.bcast_pkts_txd: 26
dev.igb.0.mac_stats.good_pkts_txd: 840240
dev.igb.0.mac_stats.total_pkts_txd: 840240
dev.igb.0.mac_stats.good_octets_txd: 68322288
dev.igb.0.mac_stats.good_octets_recvd: 145377581
dev.igb.0.mac_stats.rx_frames_1024_1522: 24579
dev.igb.0.mac_stats.rx_frames_512_1023: 4478
dev.igb.0.mac_stats.rx_frames_256_511: 9296
dev.igb.0.mac_stats.rx_frames_128_255: 6689
dev.igb.0.mac_stats.rx_frames_65_127: 53689
dev.igb.0.mac_stats.rx_frames_64: 1503308
dev.igb.0.mac_stats.mcast_pkts_recvd: 21
dev.igb.0.mac_stats.bcast_pkts_recvd: 785609
dev.igb.0.mac_stats.good_pkts_recvd: 1602039
dev.igb.0.mac_stats.total_pkts_recvd: 3127575
dev.igb.0.mac_stats.xoff_txd: 0
dev.igb.0.mac_stats.xoff_recvd: 0
dev.igb.0.mac_stats.xon_txd: 0
dev.igb.0.mac_stats.xon_recvd: 0
dev.igb.0.mac_stats.coll_ext_errs: 0
dev.igb.0.mac_stats.alignment_errs: 0
dev.igb.0.mac_stats.crc_errs: 0
dev.igb.0.mac_stats.recv_errs: 0
dev.igb.0.mac_stats.recv_jabber: 0
dev.igb.0.mac_stats.recv_oversize: 0
dev.igb.0.mac_stats.recv_fragmented: 0
dev.igb.0.mac_stats.recv_undersize: 0
dev.igb.0.mac_stats.recv_no_buff: 0
dev.igb.0.mac_stats.missed_packets: 0
dev.igb.0.mac_stats.defer_count: 0
dev.igb.0.mac_stats.sequence_errors: 0
dev.igb.0.mac_stats.symbol_errors: 0
dev.igb.0.mac_stats.collision_count: 0
dev.igb.0.mac_stats.late_coll: 0
dev.igb.0.mac_stats.multiple_coll: 0
dev.igb.0.mac_stats.single_coll: 0
dev.igb.0.mac_stats.excess_coll: 0