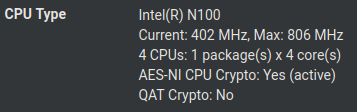
Topton N100 Reporting 402 MHz
-
@zoltar Those results look to be pretty much in line with mine after I loaded the unlocked BIOS and played around with the PL1 and PL2 settings. Before that I would get about half those values. So I question whether you're truly throttled. Or if you are, it's not by much. The reported CPU speed indicator has never seemed to be especially accurate, so I'm not sure how much stock I'd place in it. Do you have other reasons to believe your CPU speed is being limited?
-
false alarm. I have launched a simple iperf and the frequency has risen to 2.9GHz. The temperature is relatively high for the low workload, but I can possibly improve it by changing the thermal compound with my Artic Silver as you recommend.
Edit: Upload screenshots to the folder in Dropbox.For now I will continue with the installation of packages and I will start migrating the vlans one by one to see how it evolves.
If I see little performance I will start playing with the Speed Shift, and if not with the motherboard values.I leave you the configuration of my system and my default BIOS configuration on my device in case it can help you link text
If you need a specific capture, ask me for it without problems and I will upload it to the same folder. -
@TheNarc said in Topton N100 Reporting 402 MHz:
@zoltar Those results look to be pretty much in line with mine after I loaded the unlocked BIOS and played around with the PL1 and PL2 settings. Before that I would get about half those values. So I question whether you're truly throttled. Or if you are, it's not by much. The reported CPU speed indicator has never seemed to be especially accurate, so I'm not sure how much stock I'd place in it. Do you have other reasons to believe your CPU speed is being limited?
No, I had only noticed the speed reported in the GUI. The max still seems frozen at 806, but as you will see in the screenshots when it works, it goes up to 2.9GHz. I hadn't read you before posting again.
If you need anything, ask for it. Thanks for the recommendation, and for everything you are sharing too, when I am more comfortable with the system I will surely start playing. -
@AnonymousRetard Not sure whether it might be of interest to you as well, but in case it would . . . I haven't really been concerned about my temperatures, because they were mostly in the mid-40s spiking to just below 60 under load, but nevertheless decided that for $8 I'd get two USB-powered fans and strap them on with cable ties, one to the top and one to the bottom. Here are the fans I got. I was shocked at the difference, it dropped the temps by about 20C.
Edited to add: I was only able to put one on the bottom because I've got my router on a wire rack, though I suspect the one on the top is doing the heavy lifting anyway.
-
@TheNarc Thanks for all the information. Yeah, I also got a fan, this one, a bit larger, and with three different speed settings. But only one. Was also planning to attach it with cable-ties if needed but I still would prefer to make do with just passive cooling. My memtest86+ experiement with just the added SODIMM heatsinks unfortunately failed as well after about 1.5 hours. Again the RAM was too hot to touch.
Currently though I have 10.5 days of uptime with no crashes with no active cooling. What I changed is I left the SODIMM heatsinks on (even though they probably change next to nothing), I changed the TCC offset to 40 (which causes the CPU to throttle at temps above 65C), and I lowered the speedstep setting from two steps toward performance to two steps toward energy effiency.
The box is probably not 100% stable still, it could probably crash during prolonged stress-testing, but hopefully during normal usage it will be stable enough for what I want to use it for.
As for my NVMe drive I got one with the box and it seems to be some cheap chinese brand: BKKJ nvme 128G. It seems the current temperature it reports through SMART-data is broken (it always says 40C). But it does have other historical thermal information which is probably correct:
Warning  Comp. Temp. Threshold:     83 Celsius
Critical Comp. Temp. Threshold:     85 Celsius
Warning  Comp. Temperature Time:    12
Critical Comp. Temperature Time:    1
Thermal Temp. 1 Transition Count:   51
Thermal Temp. 2 Transition Count:   1
Thermal Temp. 1 Total Time:         5488
Thermal Temp. 2 Total Time:         12
I'm not sure what the unit is for the time but obviously it thinks it has spent some amount of time above 83C (warning temp) and a small amount of time over 85C (critical temp). Probably the SODIMM RAM increases to similar temps when the ambient temp in the box becomes really high. For now I think I'll only use the fan if the box keeps crashing during my normal usage or maybe during critical heavy operations such as full system upgrades. If I do use the fan performance does increase a bit as the CPU doesn't have to limit itself because of thermals but for my use I don't really need every last bit of the possible performance.
-
@TheNarc
Just one question:
In the graphs, where do you get cpu_0..3 from?
I only get tz0, and that always stays at 27.9°C.
(Btw, on Topton N5105.)Found the reference to the posting above.
OK, a simple reset of monitor data did the trick. -
Hello everyone,
Unfortunately, I'm afraid I have very similar symptoms.
Initially I was happy to see this thread, but as time goes by and I start to doubt whether there is a solution.I have one of these Topton Intel N100 devices, 4 x 2.5 GBs Intel 226 NIC
My bios is BK-1264NP Ver: 1.5, 09/28/2023 17:23:35
Unfortunately, I don't see the "Performance temperature" settings in the BIOS :-(
However, I only noticed the possibility of changing "CPU Flex Ratio Settings"
The default value of "Disabled" can only be changed to "7". Then pfsense shows me the max speed is 691 Mhz

I have experimented with "7" and "8" (max speed is 800 Mhz ) but in all cases I still see the issue.
The issue is that during the idle mode, the pfsense is reporting quite high values of "Current CPU speed".
However, if I startiperf3test, than the speed decreases from 2 GHz to mentioned 402 MhzI can observe this also with iperf3 transfer speed which decreases from 2.5 Gbps to ~ 1 Gbps

This is weird to me. Summarizing the issue is about:
- when there is no traffic, the current CPU speed is 2GHz
- when I start iperf3 , which gives my pfsense lot of work to do :-), then CPU speed decreases to 402 MHz
-
@roxy Have you run the openssl benchmark referenced in this thread? That may help to determine whether the N100 is being throttled. Do you see CPU usage hitting 100% when your transfer speed drops?
I only got access to the power level settings in the BIOS that seemed to make the difference for me by loading a modded BIOS (also referenced in this thread). My whole LAN is only 1Gbps though so I can't run your same 2.5Gbps test as a point of comparison.
-
Yes, and the benchmark result depends how often I run it.
If the pfsense is in the idle mode, then I got very good results :-)You have chosen to measure elapsed time instead of user CPU time. Doing AES-256-CBC for 3s on 16 size blocks: 106710142 AES-256-CBC's in 3.00s Doing AES-256-CBC for 3s on 64 size blocks: 35718014 AES-256-CBC's in 3.00s Doing AES-256-CBC for 3s on 256 size blocks: 9240105 AES-256-CBC's in 3.00s Doing AES-256-CBC for 3s on 1024 size blocks: 2329749 AES-256-CBC's in 3.00s Doing AES-256-CBC for 3s on 8192 size blocks: 293649 AES-256-CBC's in 3.02s Doing AES-256-CBC for 3s on 16384 size blocks: 146186 AES-256-CBC's in 3.00s version: 3.0.12 built on: reproducible build, date unspecified options: bn(64,64) compiler: clang CPUINFO: OPENSSL_ia32cap=0x7ffaf3bfffebffff:0x98c007bc239ca7eb The 'numbers' are in 1000s of bytes per second processed. type 16 bytes 64 bytes 256 bytes 1024 bytes 8192 bytes 16384 bytes AES-256-CBC 569120.76k 761984.30k 788488.96k 795220.99k 795641.59k 798370.47kBut, when I run the benchmakr several times, or if I start
iperf3, so the CPU is getting slower (~503 MHz this time) and slower, then I see the following resultsRESULTS when CPU speed is 503 MHz You have chosen to measure elapsed time instead of user CPU time. Doing AES-256-CBC for 3s on 16 size blocks: 20752586 AES-256-CBC's in 3.61s Doing AES-256-CBC for 3s on 64 size blocks: 11339018 AES-256-CBC's in 3.81s Doing AES-256-CBC for 3s on 256 size blocks: 2117270 AES-256-CBC's in 3.00s Doing AES-256-CBC for 3s on 1024 size blocks: 474071 AES-256-CBC's in 3.20s Doing AES-256-CBC for 3s on 8192 size blocks: 62937 AES-256-CBC's in 3.00s Doing AES-256-CBC for 3s on 16384 size blocks: 22461 AES-256-CBC's in 3.00s version: 3.0.12 built on: reproducible build, date unspecified options: bn(64,64) compiler: clang CPUINFO: OPENSSL_ia32cap=0x7ffaf3bfffebffff:0x98c007bc239ca7eb The 'numbers' are in 1000s of bytes per second processed. type 16 bytes 64 bytes 256 bytes 1024 bytes 8192 bytes 16384 bytes AES-256-CBC 91994.15k 190346.79k 180673.71k 151925.27k 171859.97k 122667.01k -
That seems like you might be hitting thermal throttling. Check the per core temperatures.
-
I see the following output of
thermal sensorshw.acpi.thermal.tz0.temperature: 27.9C dev.cpu.3.temperature: 44.0C dev.cpu.2.temperature: 43.0C dev.cpu.1.temperature: 44.0C dev.cpu.0.temperature: 45.0CHowever, after few minutes of benchmark, the CPU speed increased to 600 - 800 MHz, and the transfer speed is about 1.9 Gbps
-
Hmm, seems fine if that's during the test.
-
 S stephenw10 referenced this topic on
-
It's quite fine, but not bad ;-)
I really would like to have 2.5 GBps :-( all the time ,
I see 2.35 at the beginning and 1.0 after 15 seconds and 1.8 back after 30 secondsThis could be the result of bad cooling (but temperature is about 45 degrees).
I tried to simplify pfsense firewall rules (single rule with Pass all traffic) but didnt get 2.5I am wondering if NetGate hw really gets 2.5 GBps. I was considering to buy NetGate 4200 to check, but I habe no spare $500
Connecting to host 192.168.18.100, port 5201 [ 5] local 10.0.2.21 port 56216 connected to 192.168.18.100 port 5201 [ ID] Interval Transfer Bitrate [ 5] 0.00-1.00 sec 283 MBytes 2.36 Gbits/sec [ 5] 1.00-2.00 sec 280 MBytes 2.35 Gbits/sec [ 5] 2.00-3.01 sec 282 MBytes 2.35 Gbits/sec [ 5] 3.01-4.01 sec 280 MBytes 2.35 Gbits/sec [ 5] 4.01-5.01 sec 280 MBytes 2.35 Gbits/sec [ 5] 5.01-6.00 sec 275 MBytes 2.31 Gbits/sec [ 5] 6.00-7.00 sec 280 MBytes 2.35 Gbits/sec [ 5] 7.00-8.01 sec 281 MBytes 2.35 Gbits/sec [ 5] 8.01-9.01 sec 280 MBytes 2.35 Gbits/sec [ 5] 9.01-10.01 sec 280 MBytes 2.35 Gbits/sec [ 5] 10.01-11.00 sec 280 MBytes 2.35 Gbits/sec [ 5] 11.00-12.01 sec 281 MBytes 2.35 Gbits/sec [ 5] 12.01-13.00 sec 280 MBytes 2.35 Gbits/sec [ 5] 13.00-14.00 sec 280 MBytes 2.35 Gbits/sec [ 5] 14.00-15.01 sec 282 MBytes 2.35 Gbits/sec [ 5] 15.01-16.00 sec 280 MBytes 2.35 Gbits/sec [ 5] 16.00-17.00 sec 280 MBytes 2.35 Gbits/sec [ 5] 17.00-18.01 sec 281 MBytes 2.35 Gbits/sec [ 5] 18.01-19.01 sec 280 MBytes 2.35 Gbits/sec [ 5] 19.01-20.01 sec 280 MBytes 2.35 Gbits/sec [ 5] 20.01-21.01 sec 196 MBytes 1.65 Gbits/sec [ 5] 21.01-22.00 sec 226 MBytes 1.91 Gbits/sec [ 5] 22.00-23.01 sec 204 MBytes 1.71 Gbits/sec [ 5] 23.01-24.00 sec 190 MBytes 1.60 Gbits/sec [ 5] 24.00-25.00 sec 156 MBytes 1.31 Gbits/sec [ 5] 25.00-26.00 sec 158 MBytes 1.32 Gbits/sec [ 5] 26.00-27.00 sec 158 MBytes 1.32 Gbits/sec [ 5] 27.00-28.01 sec 157 MBytes 1.32 Gbits/sec [ 5] 28.01-29.01 sec 155 MBytes 1.30 Gbits/sec [ 5] 29.01-30.01 sec 153 MBytes 1.28 Gbits/sec [ 5] 30.01-31.00 sec 156 MBytes 1.31 Gbits/sec [ 5] 31.00-32.00 sec 156 MBytes 1.31 Gbits/sec [ 5] 32.00-33.00 sec 158 MBytes 1.32 Gbits/sec [ 5] 33.00-34.00 sec 157 MBytes 1.32 Gbits/sec [ 5] 34.00-35.00 sec 113 MBytes 947 Mbits/sec [ 5] 35.00-36.01 sec 103 MBytes 860 Mbits/sec [ 5] 36.01-37.01 sec 187 MBytes 1.57 Gbits/sec [ 5] 37.01-38.01 sec 193 MBytes 1.62 Gbits/sec [ 5] 38.01-39.01 sec 213 MBytes 1.79 Gbits/sec [ 5] 39.01-40.01 sec 214 MBytes 1.80 Gbits/sec [ 5] 40.01-41.01 sec 214 MBytes 1.80 Gbits/sec [ 5] 41.01-42.01 sec 213 MBytes 1.79 Gbits/sec [ 5] 42.01-43.01 sec 212 MBytes 1.78 Gbits/sec [ 5] 43.01-44.01 sec 214 MBytes 1.80 Gbits/sec [ 5] 44.01-45.00 sec 213 MBytes 1.80 Gbits/sec [ 5] 45.00-46.00 sec 213 MBytes 1.79 Gbits/sec [ 5] 46.00-47.00 sec 214 MBytes 1.79 Gbits/sec [ 5] 47.00-48.01 sec 214 MBytes 1.79 Gbits/sec [ 5] 48.01-49.00 sec 212 MBytes 1.79 Gbits/sec [ 5] 49.00-50.01 sec 199 MBytes 1.66 Gbits/sec [ 5] 50.01-51.01 sec 215 MBytes 1.80 Gbits/sec [ 5] 51.01-52.01 sec 217 MBytes 1.82 Gbits/sec [ 5] 52.01-53.01 sec 213 MBytes 1.79 Gbits/sec [ 5] 53.01-54.00 sec 213 MBytes 1.79 Gbits/sec [ 5] 54.00-55.00 sec 214 MBytes 1.79 Gbits/sec [ 5] 55.00-56.00 sec 218 MBytes 1.83 Gbits/sec -
You see retransmissions at the other end when that's shown?
Do you see dropped packets in the interface stats?
-
I have iperf sunning in
SERVICESand the client inDMZ
I am not sure how to check number of dropped packages. I think the rules are "Pass" - so I should not see any dropped packets, right?
-
One end of the iperf test usually reports retransmission counts. In a nice result there should be no retransmissions.
Interface stats can be seen in Status > Interfaces or from
netstat -i.One other user seeing this recently had disabled flow control on the NIC and required it on that particular connection. Some devices just don't play nicely with/without it so it's worth testing.
-
Name       Mtu Network             Address                                      Ipkts Ierrs Idrop      Opkts Oerrs  Coll
igc2      1500 <Link#3>            00:d0:b4:02:1c:b8                        645357575     0     0   21639068     0     0
igc2         - fe80::%igc2/64      fe80::2d0:b4ff:fe02:1cb8%igc2                    0     -     -          1     -     -
igc2         - 10.0.2.0/24         10.0.2.1                                        24     -     -      28181     -     -
igc3      1500 <Link#4>            00:d0:b4:02:1c:b9                         21751498     0     0  646024233     0     0
igc3         - fe80::%igc3/64      fe80::2d0:b4ff:fe02:1cb9%igc3                    0     -     -          0     -     -
igc3         - 192.168.18.0/24     192.168.18.1                                  3130     -     -       3115     -     -
-
After 10 minutes the speed test converges to 2 Gbps ;-)

and the power consumption increased by ~ 5W

-
Hmm, well that seems suspicious!
No retries/retransmissions shown at either end? You might have to run it verbose perhaps. I expect to see something like:
steve@steve-NUC9i9QNX:~$ iperf3 -c 4200.stevew.lan
Connecting to host 4200.stevew.lan, port 5201
[  5] local 172.21.16.8 port 43826 connected to 172.21.16.11 port 5201
[ ID] Interval           Transfer     Bitrate         Retr  Cwnd
[  5]   0.00-1.00   sec   114 MBytes   958 Mbits/sec    0    397 KBytes
[  5]   1.00-2.00   sec   112 MBytes   939 Mbits/sec    0    417 KBytes
[  5]   2.00-3.00   sec   112 MBytes   941 Mbits/sec    0    417 KBytes
[  5]   3.00-4.00   sec   112 MBytes   941 Mbits/sec    0    417 KBytes
[  5]   4.00-5.00   sec   112 MBytes   940 Mbits/sec    0    417 KBytes
[  5]   5.00-6.00   sec   112 MBytes   944 Mbits/sec    0    417 KBytes
[  5]   6.00-7.00   sec   112 MBytes   942 Mbits/sec    0    417 KBytes
[  5]   7.00-8.00   sec   112 MBytes   941 Mbits/sec    0    417 KBytes
[  5]   8.00-9.00   sec   113 MBytes   945 Mbits/sec    0    417 KBytes
[  5]   9.00-10.00  sec   112 MBytes   936 Mbits/sec    0    417 KBytes
- - - - - - - - - - - - - - - - - - - - - - - - -
[ ID] Interval           Transfer     Bitrate         Retr
[  5]   0.00-10.00  sec  1.10 GBytes   943 Mbits/sec    0             sender
[  5]   0.00-10.00  sec  1.10 GBytes   941 Mbits/sec                  receiver

iperf Done.
Check for ASPM in the BIOS if you haven't already. That can cause a lot of problems.
-
I will chack the ASPM tomorrow, but I am afraid I have no option in my version.
Here is the result of
iperfrunning for 10 minutes❯ iperf3 -c 192.168.18.200 -t 600 ─╯ Connecting to host 192.168.18.200, port 5201 [ 5] local 10.0.2.21 port 56698 connected to 192.168.18.200 port 5201 [ ID] Interval Transfer Bitrate [ 5] 0.00-1.01 sec 284 MBytes 2.37 Gbits/sec [ 5] 1.01-2.01 sec 280 MBytes 2.35 Gbits/sec [ 5] 2.01-3.00 sec 279 MBytes 2.35 Gbits/sec [ 5] 3.00-4.01 sec 282 MBytes 2.35 Gbits/sec [ 5] 4.01-5.01 sec 279 MBytes 2.34 Gbits/sec [ 5] 5.01-6.00 sec 279 MBytes 2.35 Gbits/sec . . . [ 5] 594.00-595.01 sec 182 MBytes 1.52 Gbits/sec [ 5] 595.01-596.01 sec 178 MBytes 1.50 Gbits/sec [ 5] 596.01-597.00 sec 174 MBytes 1.47 Gbits/sec [ 5] 597.00-598.00 sec 179 MBytes 1.50 Gbits/sec [ 5] 598.00-599.01 sec 170 MBytes 1.42 Gbits/sec [ 5] 599.01-600.00 sec 168 MBytes 1.42 Gbits/sec - - - - - - - - - - - - - - - - - - - - - - - - - [ ID] Interval Transfer Bitrate [ 5] 0.00-600.00 sec 108 GBytes 1.54 Gbits/sec sender [ 5] 0.00-600.01 sec 108 GBytes 1.54 Gbits/sec receiver