Netgate Discussion Forum
    • Categories
    • Recent
    • Tags
    • Popular
    • Users
    • Search
    • Register
    • Login

    SG-2100-MAX System crashes with Compex use and 1gbps fiber

    Scheduled Pinned Locked Moved Wireless
    reboots
    35 Posts 2 Posters 2.0k Views
    Loading More Posts
    • Oldest to Newest
    • Newest to Oldest
    • Most Votes
    Reply
    • Reply as topic
    Log in to reply
    This topic has been deleted. Only users with topic management privileges can see it.
    • JonathanLeeJ
      JonathanLee
      last edited by

       x0:                0
        x1: ffff00009c600000 ($d.6 + 999bb068)
        x2:               84
        x3:                4
        x4:                1
        x5: ffff000097280840 ($d.6 + 9463b8a8)
        x6:                0
        x0:                0
        x7:              100
        x1: ffff00009c600000  x8: ffff000000ad0114 ($d.6 + 999bb068)
       (generic_bs_r_4 + 0)
        x2:             80f4
        x9: ffff000000acff6c  x3:                4
       (generic_bs_barrier + 0)
        x4:                1
       x10:               88
        x5: ffff000096fdd000 x11:              5c0
       ($d.6 + 94398068) x12:                1
      
       x13:                1
        x6:              100
       x14:             285f
        x7: ffff00009723684c x15:             2af8
       ($d.6 + 945f18b4) x16:             2878
      
       x17:                0
        x8: ffff000000ad0114 x18: ffff000097280850 (generic_bs_r_4 + 0)
       ($d.6 + 9463b8b8)
        x9: ffff000000acff6c x19: ffff000096feb000 (generic_bs_barrier + 0)
       ($d.6 + 943a6068)
       x10:              3e8
       x20: ffff00009c600000 x11:         10624dd3 ($d.6 + 999bb068)
      
       x12:               64
       x21:               84
       x13:                0
       x22: ffff00000213aa80 x14:            186a0
       (memmap_bus + 0)
       x15:         8003bed3
       x23: ffff00009c236a74 x16: ffffa00025b97200 ($d.6 + 995f1adc)
      
       x24: ffffa000019efc80 x17: ffffa0000275019a
       x25:                0
      
       x26:                0
       x18: ffff0000403c0770 x27: ffff000002192e98 ($d.6 + 3d77b7d8)
       (Giant + 18)
       x19: ffff000096feb000 x28: ffffa000019efc80 ($d.6 + 943a6068)
      
       x20: ffff00009c600000 x29: ffff000097280850 ($d.6 + 999bb068)
       ($d.6 + 9463b8b8)
       x21:             80f4
        sp: ffff000097280850
       x22: ffff00000213aa80  lr: ffff000000167114 (memmap_bus + 0)
       (ath_hal_reg_read + cc)
       x23: ffff000096fef544 elr: ffff000000ad0118 ($d.6 + 943aa5ac)
       (generic_bs_r_4 + 4)
       x24: ffff000096feb000spsr:               45
       ($d.6 + 943a6068) far: ffff00009c600084
       x25: ffff000096fef544 ($d.6 + 999bb0ec) ($d.6 + 943aa5ac)
      
       x26:                0
       x27:             7530
       x28:             754a
       x29: ffff0000403c0770 ($d.6 + 3d77b7d8)
        sp: ffff0000403c0770
        lr: ffff000000167114 (ath_hal_reg_read + cc)
       elr: ffff000000ad0118 (generic_bs_r_4 + 4)
      spsr:         20000045
       far: ffff00009c6080f4 ($d.6 + 999c315c)
      timeout stopping cpus
      panic: Unhandled EL1 external data abort
      cpuid = 1
      time = 1714888984
      KDB: enter: panic
      [ thread pid 12 tid 100070 ]
      Stopped at      kdb_enter+0x44: undefined       f907c27f
      db:0:kdb.enter.default> textdump set
      textdump set
      db:0:kdb.enter.default>  capture on
      db:0:kdb.enter.default>  run pfs
      db:1:pfs> bt
      Tracing pid 12 tid 100070 td 0xffff00009c22c600
      db_trace_self() at db_trace_self
      db_stack_trace() at db_stack_trace+0x11c
      db_command() at db_command+0x358
      db_script_exec() at db_script_exec+0x1a4
      db_command() at db_command+0x358
      db_script_exec() at db_script_exec+0x1a4
      db_script_kdbenter() at db_script_kdbenter+0x58
      db_trap() at db_trap+0xf4
      kdb_trap() at kdb_trap+0x284
      handle_el1h_sync() at handle_el1h_sync+0x10
      --- exception, esr 0
      $d.6() at 0xffff000097000a63
      db:1:pfs>  show registers
      spsr                0x600000c5
      x0                        0x12
      x1                         0xa
      x2                         0x4
      x3                         0xa
      x4          0xffff000000ad0244  generic_bs_w_4
      x5                        0x50
      x6          0xffff00000067adec  kvprintf+0x470
      x7                        0xd5
      x8                         0x1
      x9          0x9f067a1c30d67fd2
      x10         0xffff0000023d9000  nfsheur+0x5480
      x11         0xfefefefefefefeff
      x12         0xffff000097000a63
      x13             0xfeff00ff0100
      x14                          0
      x15                          0
      x16                          0
      x17                          0
      x18         0xffff000097280560
      x19         0xffff000002433000  epoch_array+0x1280
      x20         0xffff000002401eb0  vpanic.buf
      x21         0xffff00009c22c600
      x22                          0
      x23         0xffff000002401000  proc_id_reapmap+0x2870
      x24         0xffffa000019efc80
      x25                          0
      x26                          0
      x27         0xffff000002192e98  Giant+0x18
      x28         0xffffa000019efc80
      x29         0xffff000097280560
      lr          0xffff000000673a68  kdb_enter+0x40
      elr         0xffff000000673a6c  kdb_enter+0x44
      sp          0xffff000097280560
      kdb_enter+0x44: undefined       f907c27f
      db:1:pfs>  show pcpu
      cpuid        = 1
      dynamic pcpu = 0x3eb20180
      curthread    = 0xffff00009c22c600: pid 12 tid 100070 critnest 1 "pcib0,0: ath0"
      curpcb       = 0xffff000097280b40
      fpcurthread  = 0xffff0000e1a86200: pid 29607 "snort"
      idlethread   = 0xffff000040ebb800: tid 100004 "idle: cpu1"
      curvnet      = 0
      db:1:pfs>  run lockinfo
      db:2:lockinfo> show locks
      No such command; use "help" to list available commands
      db:2:lockinfo>  show alllocks
      No such command; use "help" to list available commands
      db:2:lockinfo>  show lockedvnods
      Locked vnodes
      db:1:pfs>  acttrace
      
      Tracing command clock pid 2 tid 100029 td 0xffff000096fb5c00 (CPU 0)
      sched_switch() at sched_switch+0x868
      mi_switch() at mi_switch+0x100
      version() at version+0x12c
      
      Tracing command intr pid 12 tid 100070 td 0xffff00009c22c600 (CPU 1)
      db_trace_self() at db_trace_self
      _db_stack_trace_all() at _db_stack_trace_all+0xe8
      db_command() at db_command+0x358
      db_script_exec() at db_script_exec+0x1a4
      db_command() at db_command+0x358
      db_script_exec() at db_script_exec+0x1a4
      db_script_kdbenter() at db_script_kdbenter+0x58
      db_trap() at db_trap+0xf4
      kdb_trap() at kdb_trap+0x284
      handle_el1h_sync() at handle_el1h_sync+0x10
      --- exception, esr 0
      $d.6() at 0xffff000097000a63
      db:1:pfs>  ps
        pid  ppid  pgrp   uid  state   wmesg   wchan               cmd
      80015 92122   412     0  S       nanslp  0xffff00000240378d  sleep
      77724 44890    26     0  S       nanslp  0xffff00000240378c  sleep
      80274 87627 86665   100  S       sbwait  0xffff0000df9e844c  perl
      54117 87627 86665   100  S       sbwait  0xffff0000dfa4e8cc  perl
      53941 87627 86665   100  S       sbwait  0xffff0000df9e6d4c  perl
      18551 18369 17397     0  S       piperd  0xffff0000e14be998  sh
      18369 17397 17397     0  S       wait    0xffffa0008ee11540  sh
      18181 17397 17397     0  S       (threaded)                  sshg-blocker
      100326                   S       piperd  0xffff0000e14bd000  sshg-blocker
      100376                   S       nanslp  0xffff00000240378c  sshg-blocker
      18028 17397 17397     0  S       piperd  0xffff0000e14be110  sshg-parser
      17703 17397 17397     0  S       piperd  0xffff0000e14666c0  cat
      17397 47272 17397     0  Ss      wait    0xffffa00099a58000  sh
      17327     1 17327     0  Ss+     ttyin   0xffffa00000e604b0  getty
      92236 87627 86665   100  S       sbwait  0xffff0000dfa5c8cc  squidGuard
      92108 87627 86665   100  S       sbwait  0xffff0000dfa5ed4c  squidGuard
      91847 87627 86665   100  S       sbwait  0xffff0000dfa5db4c  squidGuard
      91544 87627 86665   100  S       sbwait  0xffff0000df9edb4c  squidGuard
      29607     1 29607     0  Rs      (threaded)                  snort
      100336                   RunQ                                snort
      100374                   S       nanslp  0xffff00000240378d  snort
      100375                   S       sbwait  0xffff0000dfa6844c  snort
      57228 87627 86665   100  S       select  0xffffa00059604dc0  pinger
      56920 87627 86665   100  S       sbwait  0xffff0000dfa0cd4c  perl
      56138 87627 86665   100  S       sbwait  0xffff0000df9f4d4c  perl
      54293 87627 86665   100  S       sbwait  0xffff0000dfa168cc  perl
      51257 87627 86665   100  S       sbwait  0xffff0000dfa05b4c  perl
      50784 87627 86665   100  S       sbwait  0xffff0000dfa6bb4c  perl
      49572 87627 86665   100  S       sbwait  0xffff0000df9f56cc  squidGuard
      48859 87627 86665   100  S       sbwait  0xffff0000df9f5fcc  squidGuard
      u47486 87627c86665  n10: USha d  dsbLa txt0rfalfdata abfr8c  squidGuime
       psqui=Gu
      d▒TIM-1.0
      WTMI-devel-1.0.0-1115f12
      WTMI: system early-init
      SVC REV: 5, CPU VDD voltage: 1.225V
      
      1 Reply Last reply Reply Quote 0
      • JonathanLeeJ
        JonathanLee
        last edited by

        Screenshot 2024-05-07 at 09.16.29.png

        Enabled Swap and it stopped crashing....

        Ok so stress testing it now with full device use everything in the house would not reboot, so I added ClamAV to it and finally got swap use out of it and still no reboots.

        I think that resolved my reboots. high speed SSDs are amazing

        1 Reply Last reply Reply Quote 0
        • JonathanLeeJ
          JonathanLee
          last edited by

          @stephenw10 thanks for working this issue with me.

          Ok I got it to crash again. However, I have no report that went to /var/crash nothing is listed I got the swap working and everything . Is there something else I need to make the /var/crash reports generate?

          1 Reply Last reply Reply Quote 0
          • stephenw10S
            stephenw10 Netgate Administrator
            last edited by

            Hmm, I wonder if saving crash data is not enabled on the 2100. Did you install that using the Net Installer or the legacy installer?

            JonathanLeeJ 1 Reply Last reply Reply Quote 0
            • stephenw10S
              stephenw10 Netgate Administrator
              last edited by

              Ah, OK I see. Testing....

              1 Reply Last reply Reply Quote 0
              • JonathanLeeJ
                JonathanLee @stephenw10
                last edited by

                @stephenw10 I installed it from the image that TAC sent me over USB it was all set up already in the image how can I manually enable that?

                1 Reply Last reply Reply Quote 0
                • stephenw10S
                  stephenw10 Netgate Administrator
                  last edited by

                  What do you see in /etc/ddb.conf ?

                  JonathanLeeJ 1 Reply Last reply Reply Quote 1
                  • JonathanLeeJ
                    JonathanLee @stephenw10
                    last edited by

                    @stephenw10

                    # $FreeBSD$
                    #
                    #  This file is read when going to multi-user and its contents piped thru
                    #  ``ddb'' to define debugging scripts.
                    #
                    # see ``man 4 ddb'' and ``man 8 ddb'' for details.
                    #
                    
                    script lockinfo=show locks; show alllocks; show lockedvnods
                    
                    # kdb.enter.panic	panic(9) was called.
                    script kdb.enter.panic=textdump set; capture on; run lockinfo; show pcpu; bt; ps; alltrace; capture off; textdump dump; reset
                    
                    # kdb.enter.witness	witness(4) detected a locking error.
                    script kdb.enter.witness=run lockinfo
                    
                    
                    1 Reply Last reply Reply Quote 0
                    • JonathanLeeJ
                      JonathanLee
                      last edited by

                      /etc/rc.conf shows

                      "THIS FILE DOES NOTHING, DO NOT MAKE CHANGES HERE"

                      1 Reply Last reply Reply Quote 0
                      • stephenw10S
                        stephenw10 Netgate Administrator
                        last edited by

                        Yeah, there's a problem here. We are digging...

                        JonathanLeeJ 1 Reply Last reply Reply Quote 1
                        • JonathanLeeJ
                          JonathanLee @stephenw10
                          last edited by

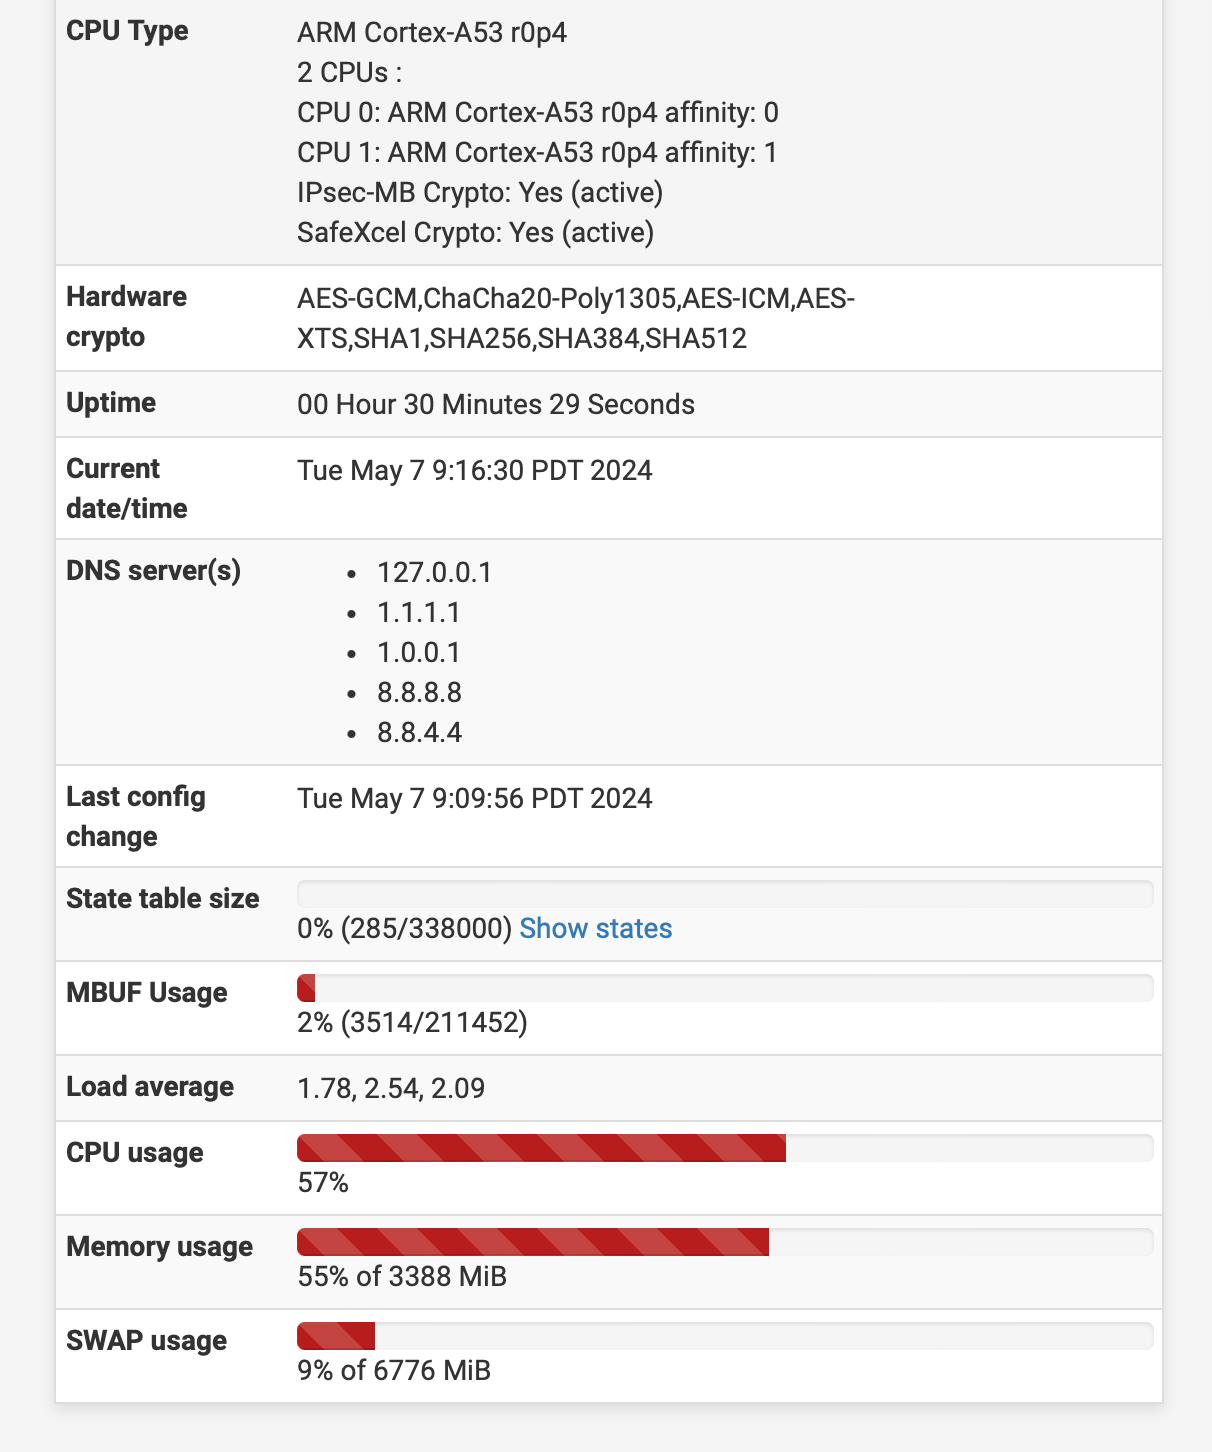
                          @stephenw10 Thanks, what is good news is the new 2100-MAX ships with 128GB SSD over the 32GB SSD in 2019.
                          So essentially the 2100 can use the SWAP now off the SSD. Again I have it enabled running it works, I am running clamAV and it uses 3% has been running for a hour or so now, as soon as I load the wifi card I get system cashes, but no crash data. It is like there is no linker file pointing to that folder or something. Good news is the swap functions very well I no longer have to disable clamAV when Snort updates it just works without killing snort. Historically it would kill the snort process each and every update of the database. This time it started to use the SWAP when it ran out of memory. So it does function as designed with memory exhaustions. It has to be something simple like pointing a linker file

                          1 Reply Last reply Reply Quote 0
                          • stephenw10S
                            stephenw10 Netgate Administrator
                            last edited by

                            Yeah OK it's because manually editing the fstab it's easy to omit the required new-line character at the end of the additional line. That then trips up the rc.dumpon script so it never gets enabled at boot.

                            So make sure your fstab looks like:

                            [24.03-RELEASE][root@2100-3.stevew.lan]/root: cat /etc/fstab
                            # Device                Mountpoint      FStype  Options         Dump    Pass#
                            /dev/msdosfs/EFISYS     /boot/efi       msdosfs rw,noatime,noauto       0       0
                            /dev/msdosfs/DTBFAT0    /boot/msdos     msdosfs rw,noatime,noauto       0       0
                            /dev/ada0s3b            none    swap    sw              0       0
                            [24.03-RELEASE][root@2100-3.stevew.lan]/root: 
                            

                            And not:

                            24.03-RELEASE][root@2100-3.stevew.lan]/root: cat /etc/fstab
                            # Device                Mountpoint      FStype  Options         Dump    Pass#
                            /dev/msdosfs/EFISYS     /boot/efi       msdosfs rw,noatime,noauto       0       0
                            /dev/msdosfs/DTBFAT0    /boot/msdos     msdosfs rw,noatime,noauto       0       0
                            /dev/ada0s3b            none    swap    sw              0       0[24.03-RELEASE][root@2100-3.stevew.lan]/root:
                            

                            Then run:

                            [24.03-RELEASE][root@2100-3.stevew.lan]/root: /etc/rc.dumpon
                            Using /dev/ada0s3b for dump device.
                            

                            Or reboot.

                            You should then see that enabled:

                            [24.03-RELEASE][root@2100-3.stevew.lan]/root: dumpon -l
                            ada0s3b
                            

                            If you then trigger a panic you should see a crash report. You can manually trigger one as a test using: sysctl debug.kdb.panic=1

                            JonathanLeeJ 1 Reply Last reply Reply Quote 1
                            • JonathanLeeJ
                              JonathanLee @stephenw10
                              last edited by JonathanLee

                              @stephenw10

                              Thank you that fixed it!!

                              Amazing to see this run on the SG-2100 with that 1 million hr SSD with self leveling it should be fine to use a swap area..

                              Screenshot 2024-05-07 at 14.22.50.png

                              I manually triggered the crash and it works now.

                              So it was missing a carriage return is all it was to cause that issue weird one.

                              Does a Redmine need to be open to enable this for other 2100-MAX users that have the large SSD installed? It should be auto enabled right?

                              I would upvote you but I ran out of upvotes today I used them all on your posts helping me I will upvote it tomorrow.

                              1 Reply Last reply Reply Quote 0
                              • stephenw10S
                                stephenw10 Netgate Administrator
                                last edited by

                                Yup, that was puzzling! (thanks @jimp) But good to know.

                                Lets see if all your crashes are the same now.

                                JonathanLeeJ 3 Replies Last reply Reply Quote 0
                                • JonathanLeeJ
                                  JonathanLee @stephenw10
                                  last edited by

                                  @stephenw10 I have to active that card and start running everything in the house again hold on testing now....

                                  1 Reply Last reply Reply Quote 0
                                  • JonathanLeeJ
                                    JonathanLee @stephenw10
                                    last edited by

                                    This post is deleted!
                                    1 Reply Last reply Reply Quote 0
                                    • JonathanLeeJ
                                      JonathanLee @stephenw10
                                      last edited by JonathanLee

                                      @stephenw10 The second reboot gave me a good report it looks to be the same what part do you need to see from it?

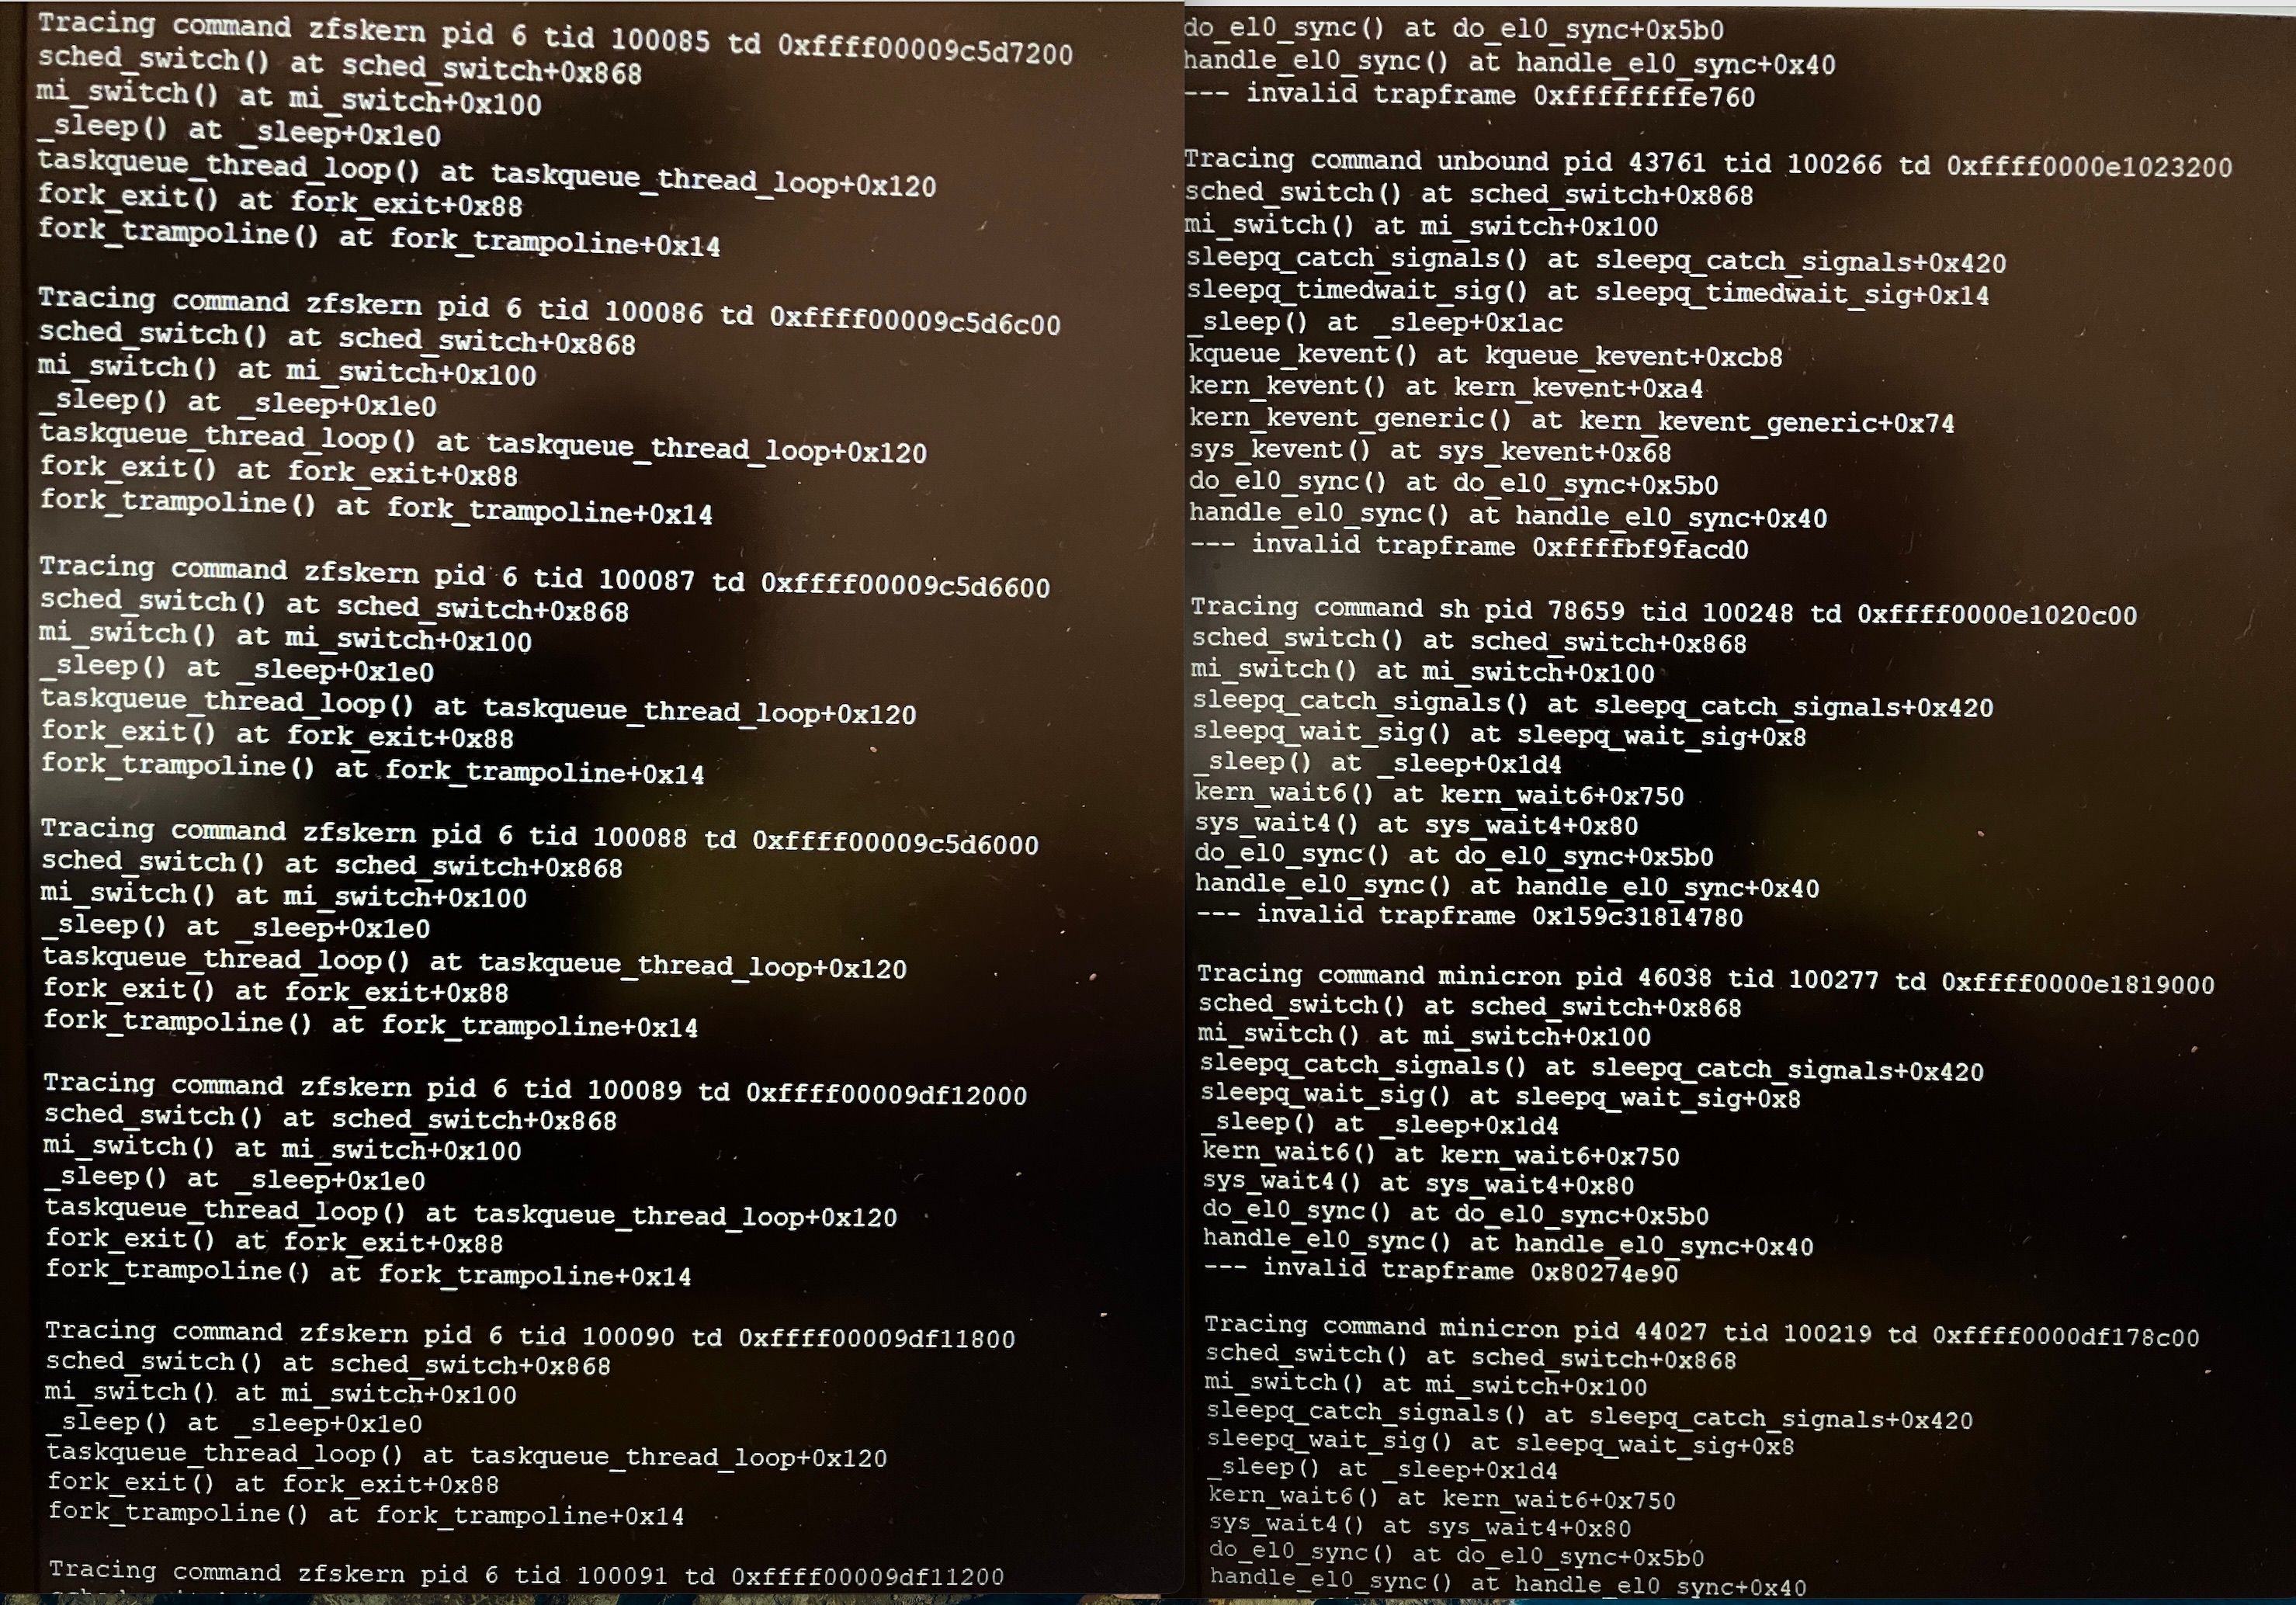
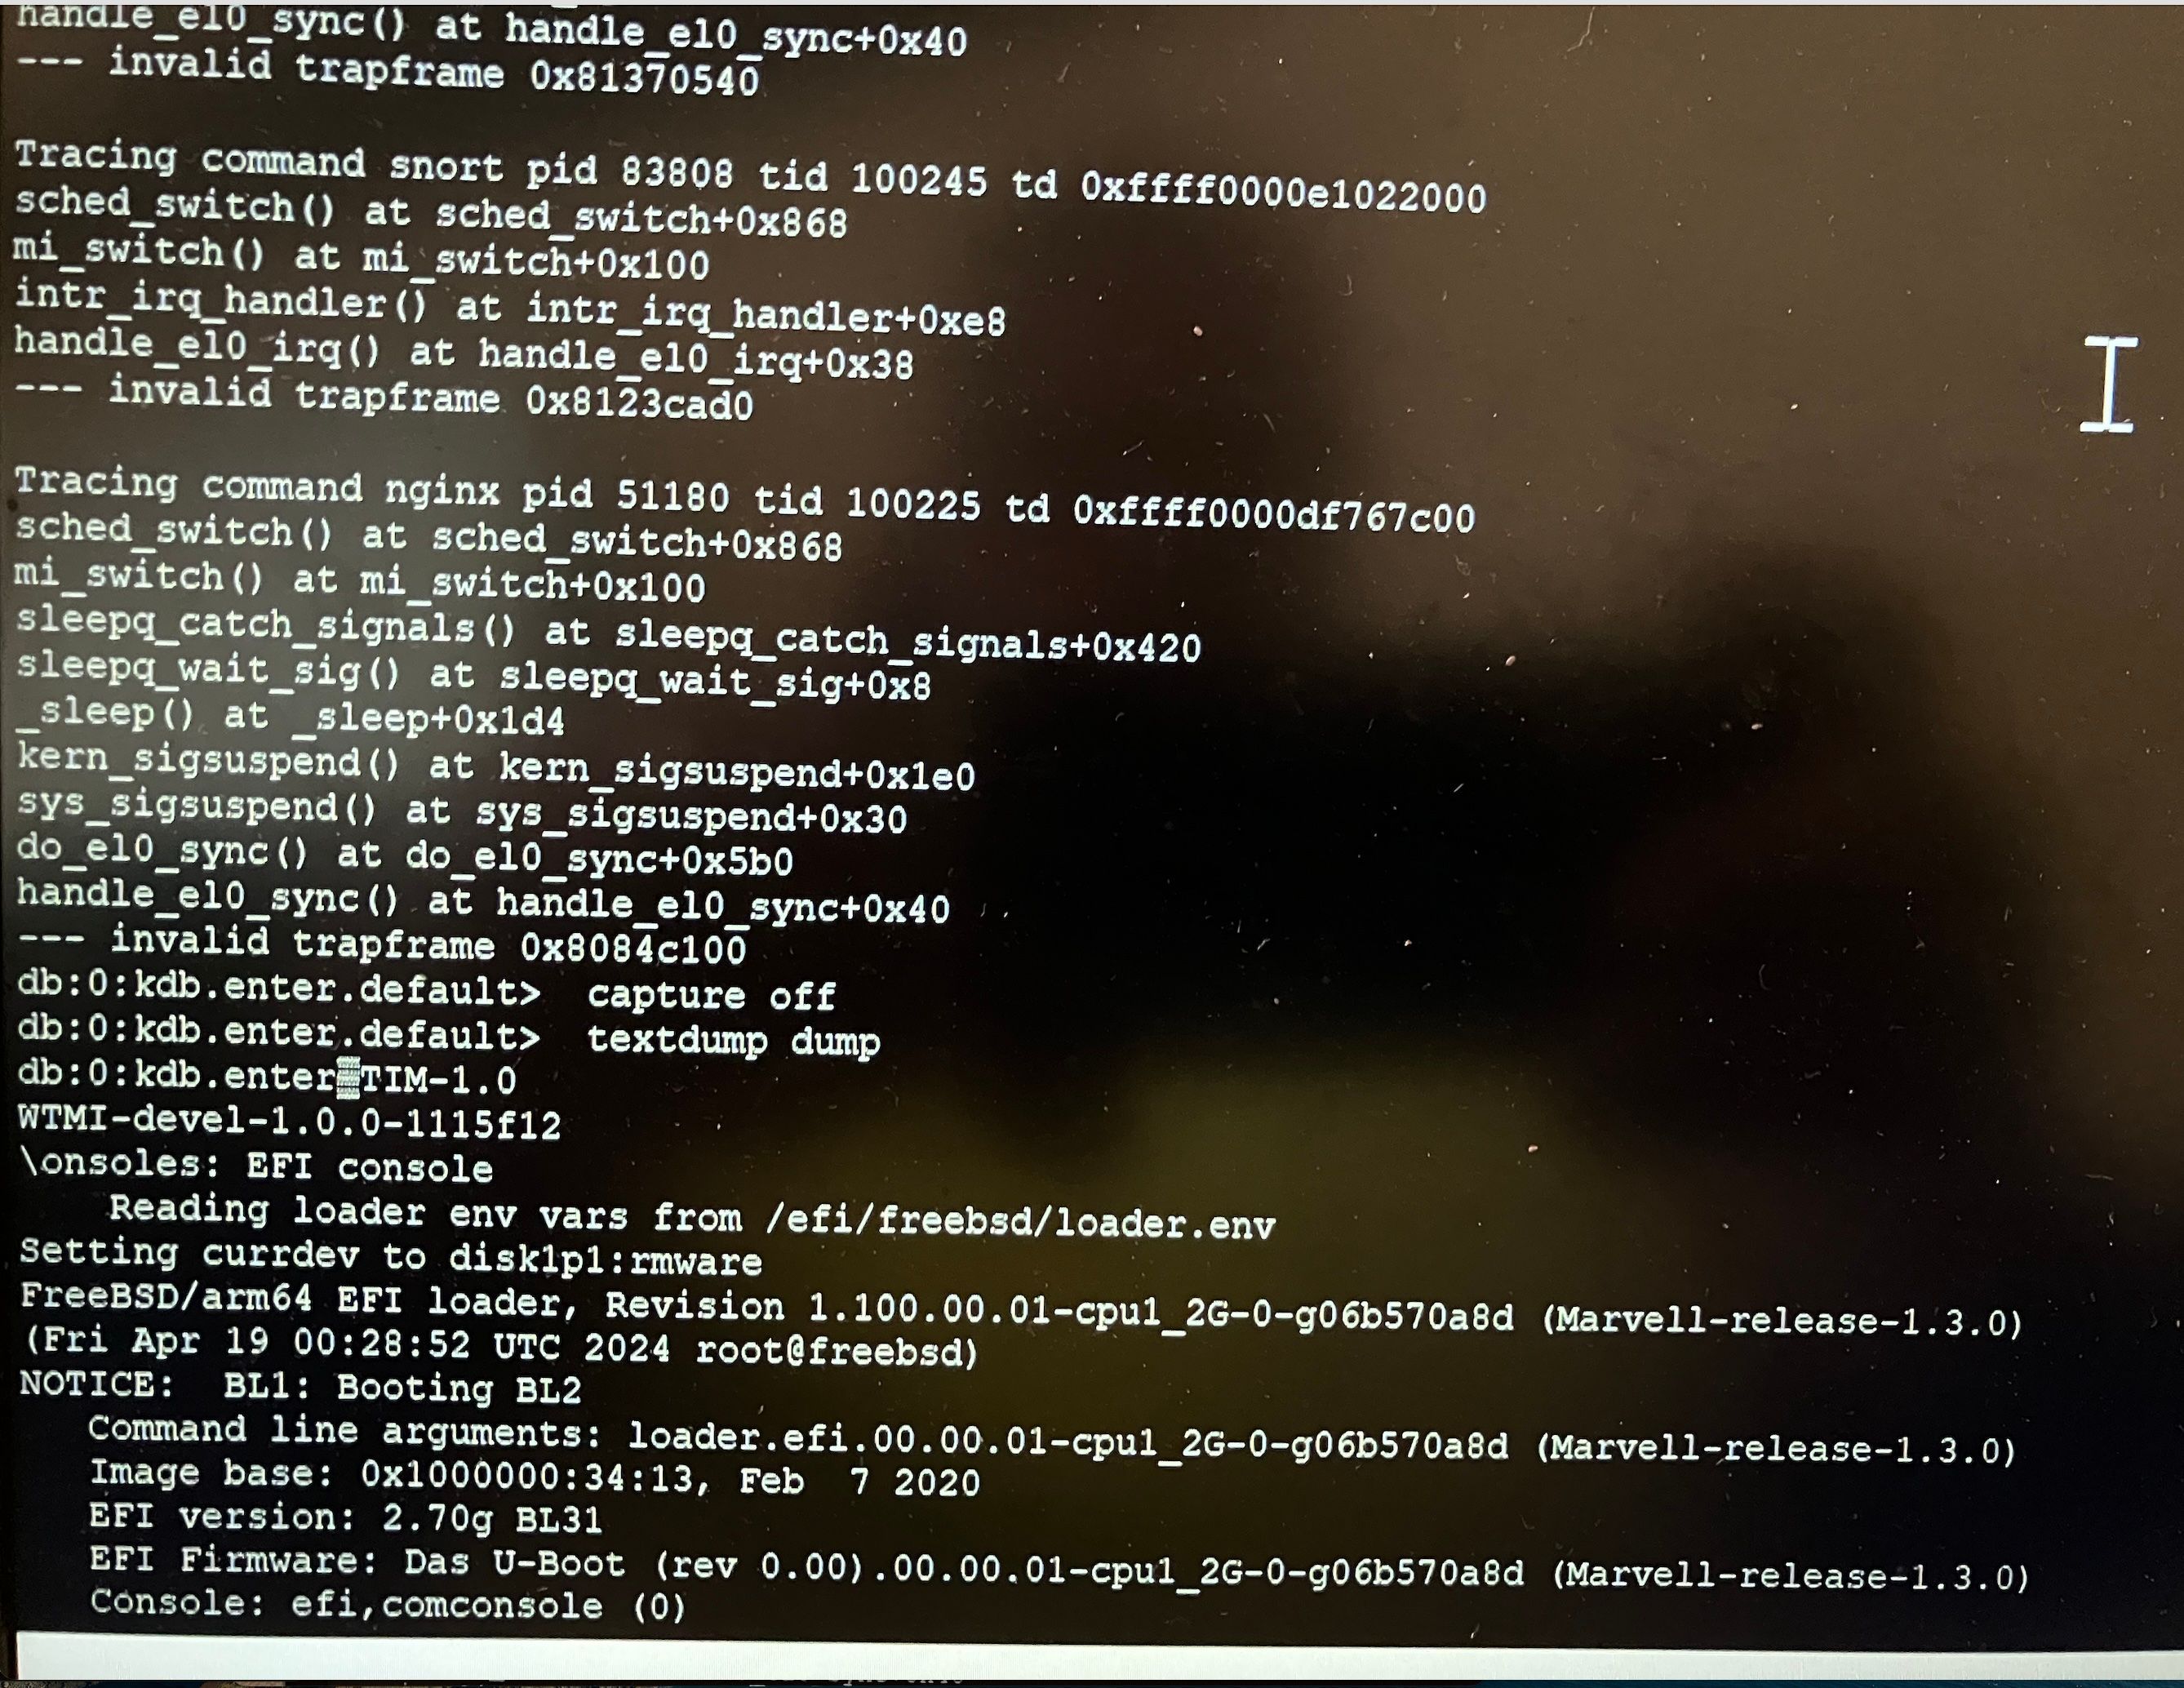
                                      Filename: /var/crash/info.0
                                      Dump header from device: /dev/ada0s3b
                                        Architecture: aarch64
                                        Architecture Version: 4
                                        Dump Length: 154624
                                        Blocksize: 512
                                        Compression: none
                                        Dumptime: 2024-05-07 15:05:11 -0700
                                        Hostname: Lee_Family.home.arpa
                                        Magic: FreeBSD Text Dump
                                        Version String: FreeBSD 14.0-CURRENT #1 plus-RELENG_23_05_1-n256108-459fc493a87: Wed Jun 28 04:25:15 UTC 2023
                                          root@freebsd:/var/jenkins/workspace/pfSense-Plus-snapshots-23_05_1-main/obj/aarch64/0P4W6joa
                                        Panic String: Unhandled EL1 external data abort
                                        Dump Parity: 3539364660
                                        Bounds: 0
                                        Dump Status: good
                                      
                                      >  run pfs
                                      db:1:pfs> bt
                                      Tracing pid 12 tid 100070 td 0xffff00009c22c600
                                      db_trace_self() at db_trace_self
                                      db_stack_trace() at db_stack_trace+0x11c
                                      db_command() at db_command+0x358
                                      db_script_exec() at db_script_exec+0x1a4
                                      db_command() at db_command+0x358
                                      db_script_exec() at db_script_exec+0x1a4
                                      db_script_kdbenter() at db_script_kdbenter+0x58
                                      db_trap() at db_trap+0xf4
                                      kdb_trap() at kdb_trap+0x284
                                      handle_el1h_sync() at handle_el1h_sync+0x10
                                      --- exception, esr 0
                                      $d.6() at 0xffff000097000a63
                                      db:1:pfs>  show registers
                                      spsr                0x600000c5
                                      x0                        0x12
                                      x1                         0xa
                                      x2                         0x4
                                      x3                         0xa
                                      x4          0xffff000000ad0244  generic_bs_w_4
                                      x5                        0x50
                                      x6          0xffff00000067adec  kvprintf+0x470
                                      x7                        0xd5
                                      x8                         0x1
                                      x9          0x36c353fc715cf827
                                      x10         0xffff0000023d9000  nfsheur+0x5480
                                      x11         0xfefefefefefefeff
                                      x12         0xffff000097000a63
                                      x13             0xfeff00ff0100
                                      x14                          0
                                      x15                          0
                                      x16                          0
                                      x17                          0
                                      x18         0xffff000097280590
                                      x19         0xffff000002433000  epoch_array+0x1280
                                      x20         0xffff000002401eb0  vpanic.buf
                                      x21         0xffff00009c22c600
                                      x22                          0
                                      x23         0xffff000002401000  proc_id_reapmap+0x2870
                                      x24         0xffffa000019efc80
                                      x25         0xffff000002191000  version+0x130
                                      x26                          0
                                      x27         0xffff000002192e98  Giant+0x18
                                      x28         0xffffa000019efc80
                                      x29         0xffff000097280590
                                      lr          0xffff000000673a68  kdb_enter+0x40
                                      elr         0xffff000000673a6c  kdb_enter+0x44
                                      sp          0xffff000097280590
                                      kdb_enter+0x44: undefined       f907c27f
                                      db:1:pfs>  show pcpu
                                      cpuid        = 1
                                      dynamic pcpu = 0x3eb20180
                                      curthread    = 0xffff00009c22c600: pid 12 tid 100070 critnest 1 "pcib0,0: ath0"
                                      curpcb       = 0xffff000097280b40
                                      fpcurthread  = 0xffff0000e2539000: pid 98459 "snort"
                                      idlethread   = 0xffff000040ebb800: tid 100004 "idle: cpu1"
                                      curvnet      = 0
                                      db:1:pfs>  run lockinfo
                                      db:2:lockinfo> show locks
                                      No such command; use "help" to list available commands
                                      db:2:lockinfo>  show alllocks
                                      No such command; use "help" to list available commands
                                      db:2:lockinfo>  show lockedvnods
                                      Locked vnodes
                                      db:1:pfs>  acttrace
                                      
                                      Tracing command intr pid 12 tid 100031 td 0xffff000096fb5000 (CPU 0)
                                      ipi_stop() at ipi_stop+0x30
                                      arm_gic_v3_intr() at arm_gic_v3_intr+0xe8
                                      intr_irq_handler() at intr_irq_handler+0x7c
                                      handle_el1h_irq() at handle_el1h_irq+0xc
                                      --- interrupt
                                      Tracing command intr pid 12 tid 100070 td 0xffff00009c22c600 (CPU 1)
                                      db_trace_self() at db_trace_self
                                      _db_stack_trace_all() at _db_stack_trace_all+0xe8
                                      db_command() at db_command+0x358
                                      db_script_exec() at db_script_exec+0x1a4
                                      db_command() at db_command+0x358
                                      db_script_exec() at db_script_exec+0x1a4
                                      db_script_kdbenter() at db_script_kdbenter+0x58
                                      db_trap() at db_trap+0xf4
                                      kdb_trap() at kdb_trap+0x284
                                      handle_el1h_sync() at handle_el1h_sync+0x10
                                      --- exception, esr 0
                                      $d.6() at 0xffff000097000a63
                                      db:1:pfs>  ps
                                      
                                      1 Reply Last reply Reply Quote 0
                                      • JonathanLeeJ
                                        JonathanLee
                                        last edited by

                                        <118> Starting /usr/local/etc/rc.d/sqp_monitor.sh...done.
                                        <118>Netgate pfSense Plus 23.05.1-RELEASE arm64 Wed Jun 28 03:57:42 UTC 2023
                                        <118>Bootup complete
                                        <6>mvneta0: promiscuous mode enabled
                                        ath0: ath_rx_pkt: rs_antenna > 7 (8542452)
                                        ath0: ath_rx_pkt: rs_antenna > 7 (8542452)
                                        ath0: ath_rx_pkt: rs_antenna > 7 (8542452)
                                        ath0: ath_rx_proc: kickpcu; handled 413 packets
                                          x0:                0
                                          x1: ffff00009c600000 ($d.6 + 999bb068)
                                          x2:             4038
                                          x3:                4
                                          x4:                1
                                          x5: ffff000097280840 ($d.6 + 9463b8a8)
                                          x6:                0
                                          x7:              200
                                          x8: ffff000000ad0114 (generic_bs_r_4 + 0)
                                          x9: ffff000000acff6c (generic_bs_barrier + 0)
                                         x10:                0
                                         x11:                0
                                         x12:                1
                                         x13:                1
                                         x14:             286b
                                         x15:             2af8
                                         x16:             2711
                                         x17:                0
                                         x18: ffff000097280880 ($d.6 + 9463b8e8)
                                         x19: ffff000096feb000 ($d.6 + 943a6068)
                                         x20: ffff00009c600000 ($d.6 + 999bb068)
                                         x21:             4038
                                         x22: ffff00000213aa80 (memmap_bus + 0)
                                         x23: ffff00009c236a74 ($d.6 + 995f1adc)
                                         x24: ffffa000019efc80
                                         x25: ffff000002191000 (version + 130)
                                         x26:                0
                                         x27: ffff000002192e98 (Giant + 18)
                                         x28: ffffa000019efc80
                                         x29: ffff000097280880 ($d.6 + 9463b8e8)
                                          sp: ffff000097280880
                                          lr: ffff000000167114 (ath_hal_reg_read + cc)
                                         elr: ffff000000ad0118 (generic_bs_r_4 + 4)
                                        spsr:         20000045
                                         far: ffff00009c604038 ($d.6 + 999bf0a0)
                                        panic: Unhandled EL1 external data abort
                                        cpuid = 1
                                        time = 1715119511
                                        KDB: enter: panic
                                        
                                        1 Reply Last reply Reply Quote 0
                                        • stephenw10S
                                          stephenw10 Netgate Administrator
                                          last edited by

                                          Yeah that looks pretty much the same. More is useful though just to be sure.

                                          You have a bunch of ath tunables if I recall? Have you tested without those?

                                          JonathanLeeJ 3 Replies Last reply Reply Quote 0
                                          • JonathanLeeJ
                                            JonathanLee @stephenw10
                                            last edited by JonathanLee

                                            @stephenw10 I removed all of them a while ago once it started working normally before the GB fiber

                                            The only one I have left is

                                            vfs.read_max Cluster read-ahead max block count = 128 for Squid

                                            1 Reply Last reply Reply Quote 0
                                            • First post
                                              Last post
                                            Copyright 2025 Rubicon Communications LLC (Netgate). All rights reserved.