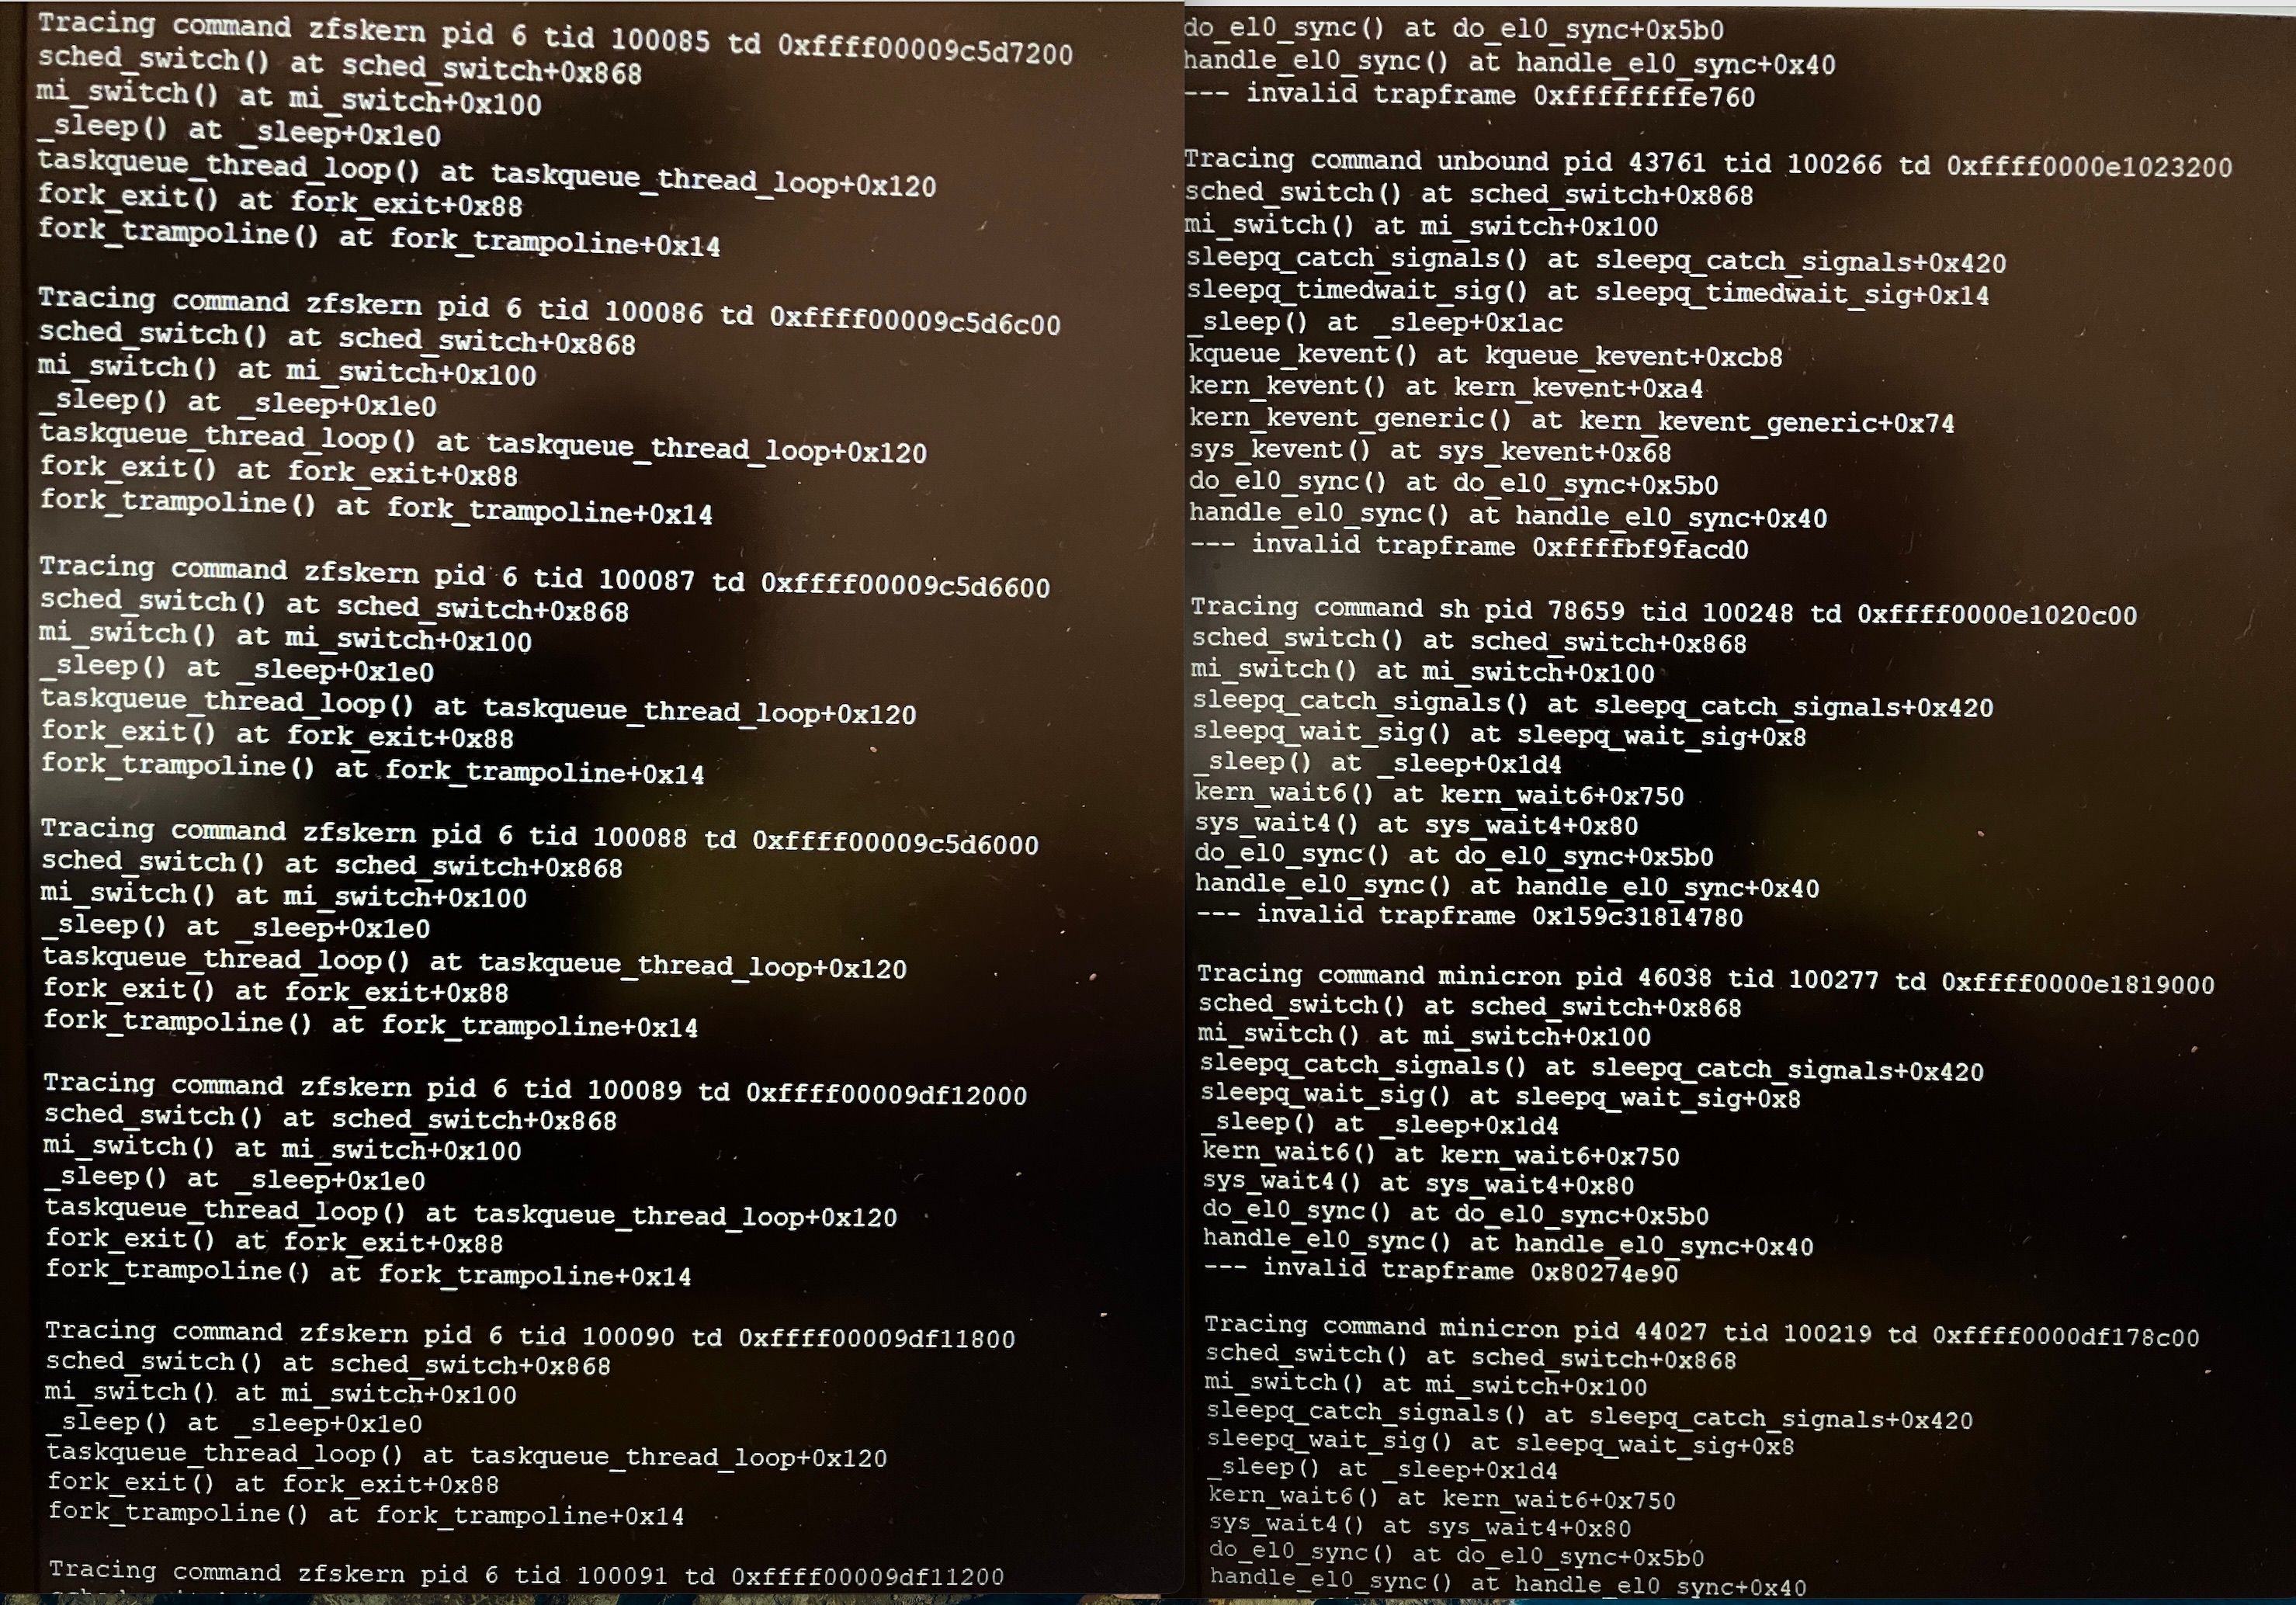
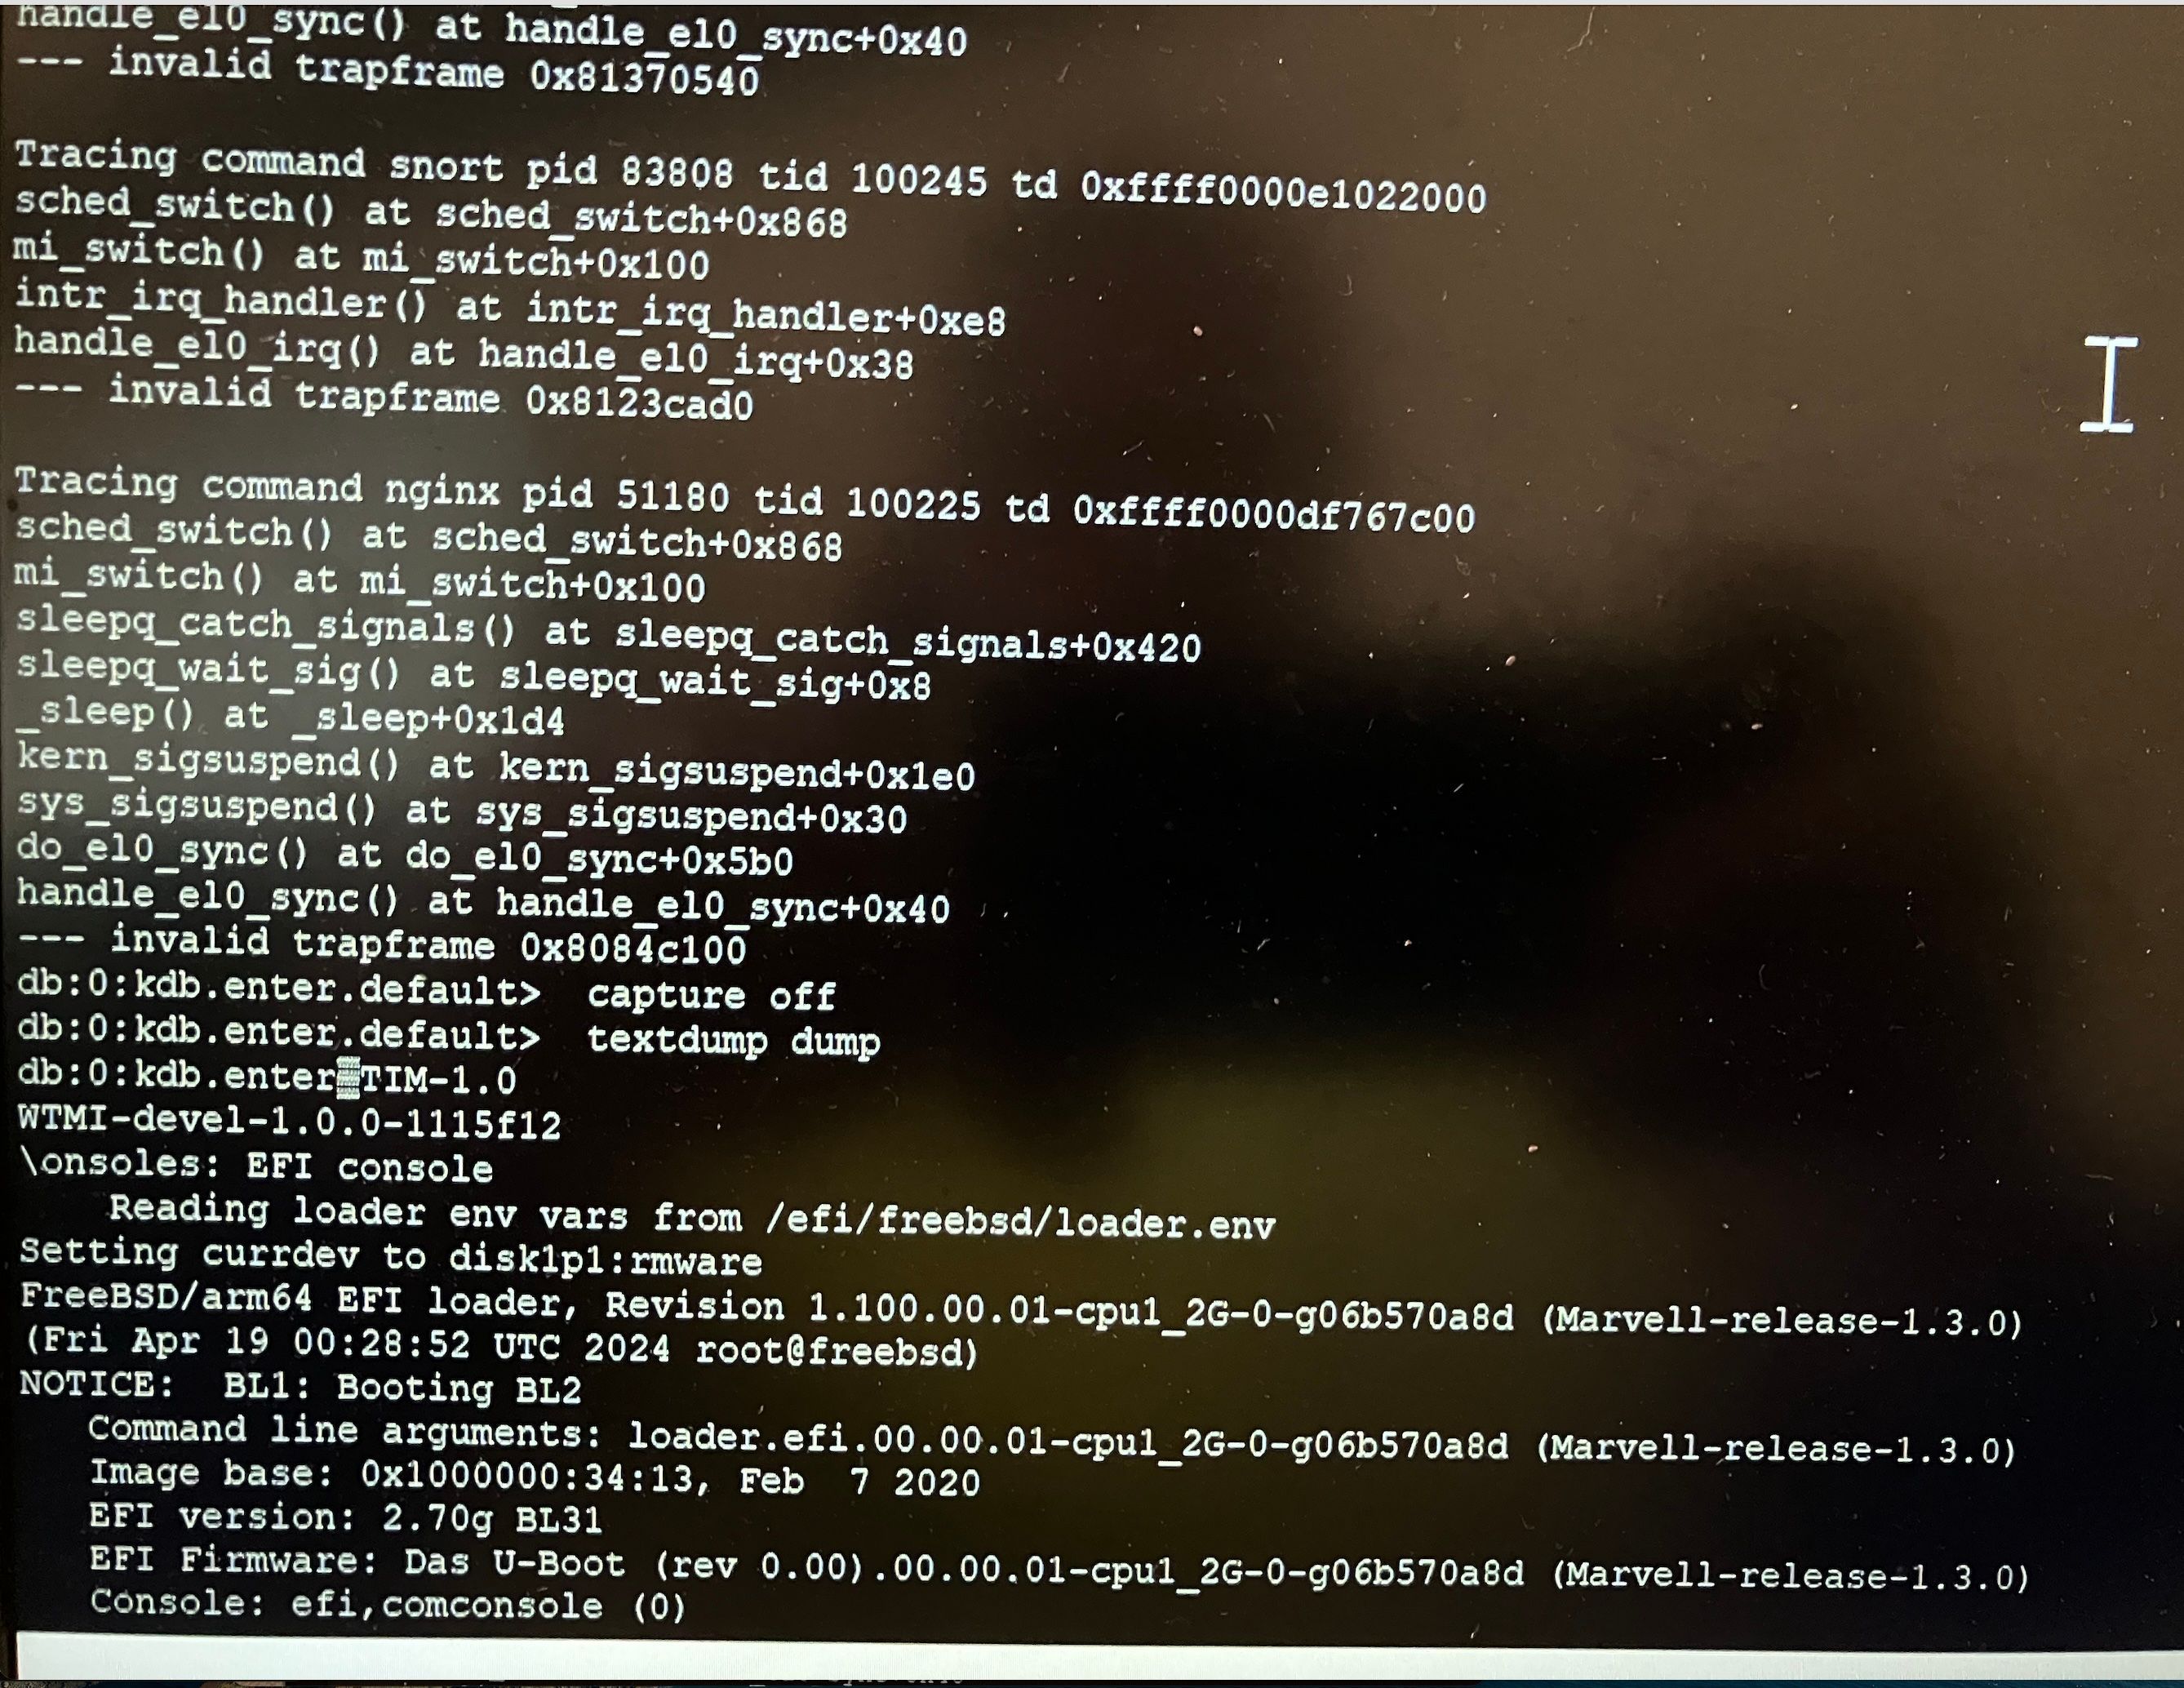
SG-2100-MAX System crashes with Compex use and 1gbps fiber
-
@stephenw10 I installed it from the image that TAC sent me over USB it was all set up already in the image how can I manually enable that?
-
What do you see in /etc/ddb.conf ?
-
# $FreeBSD$ # # This file is read when going to multi-user and its contents piped thru # ``ddb'' to define debugging scripts. # # see ``man 4 ddb'' and ``man 8 ddb'' for details. # script lockinfo=show locks; show alllocks; show lockedvnods # kdb.enter.panic panic(9) was called. script kdb.enter.panic=textdump set; capture on; run lockinfo; show pcpu; bt; ps; alltrace; capture off; textdump dump; reset # kdb.enter.witness witness(4) detected a locking error. script kdb.enter.witness=run lockinfo -
/etc/rc.conf shows
"THIS FILE DOES NOTHING, DO NOT MAKE CHANGES HERE"
-
Yeah, there's a problem here. We are digging...
-
@stephenw10 Thanks, what is good news is the new 2100-MAX ships with 128GB SSD over the 32GB SSD in 2019.
So essentially the 2100 can use the SWAP now off the SSD. Again I have it enabled running it works, I am running clamAV and it uses 3% has been running for a hour or so now, as soon as I load the wifi card I get system cashes, but no crash data. It is like there is no linker file pointing to that folder or something. Good news is the swap functions very well I no longer have to disable clamAV when Snort updates it just works without killing snort. Historically it would kill the snort process each and every update of the database. This time it started to use the SWAP when it ran out of memory. So it does function as designed with memory exhaustions. It has to be something simple like pointing a linker file -
Yeah OK it's because manually editing the fstab it's easy to omit the required new-line character at the end of the additional line. That then trips up the rc.dumpon script so it never gets enabled at boot.
So make sure your fstab looks like:
[24.03-RELEASE][root@2100-3.stevew.lan]/root: cat /etc/fstab
# Device                Mountpoint      FStype  Options         Dump    Pass#
/dev/msdosfs/EFISYS     /boot/efi       msdosfs rw,noatime,noauto       0       0
/dev/msdosfs/DTBFAT0    /boot/msdos     msdosfs rw,noatime,noauto       0       0
/dev/ada0s3b            none    swap    sw              0       0
[24.03-RELEASE][root@2100-3.stevew.lan]/root:
And not:
24.03-RELEASE][root@2100-3.stevew.lan]/root: cat /etc/fstab
# Device                Mountpoint      FStype  Options         Dump    Pass#
/dev/msdosfs/EFISYS     /boot/efi       msdosfs rw,noatime,noauto       0       0
/dev/msdosfs/DTBFAT0    /boot/msdos     msdosfs rw,noatime,noauto       0       0
/dev/ada0s3b            none    swap    sw              0       0[24.03-RELEASE][root@2100-3.stevew.lan]/root:
Then run:
[24.03-RELEASE][root@2100-3.stevew.lan]/root: /etc/rc.dumpon
Using /dev/ada0s3b for dump device.
Or reboot.
You should then see that enabled:
[24.03-RELEASE][root@2100-3.stevew.lan]/root: dumpon -l
ada0s3b
If you then trigger a panic you should see a crash report. You can manually trigger one as a test using:
sysctl debug.kdb.panic=1 -
Thank you that fixed it!!
Amazing to see this run on the SG-2100 with that 1 million hr SSD with self leveling it should be fine to use a swap area..

I manually triggered the crash and it works now.
So it was missing a carriage return is all it was to cause that issue weird one.
Does a Redmine need to be open to enable this for other 2100-MAX users that have the large SSD installed? It should be auto enabled right?
I would upvote you but I ran out of upvotes today I used them all on your posts helping me I will upvote it tomorrow.
-
Yup, that was puzzling! (thanks @jimp) But good to know.
Lets see if all your crashes are the same now.
-
@stephenw10 I have to active that card and start running everything in the house again hold on testing now....
-
This post is deleted! -
@stephenw10 The second reboot gave me a good report it looks to be the same what part do you need to see from it?
Filename: /var/crash/info.0 Dump header from device: /dev/ada0s3b Architecture: aarch64 Architecture Version: 4 Dump Length: 154624 Blocksize: 512 Compression: none Dumptime: 2024-05-07 15:05:11 -0700 Hostname: Lee_Family.home.arpa Magic: FreeBSD Text Dump Version String: FreeBSD 14.0-CURRENT #1 plus-RELENG_23_05_1-n256108-459fc493a87: Wed Jun 28 04:25:15 UTC 2023 root@freebsd:/var/jenkins/workspace/pfSense-Plus-snapshots-23_05_1-main/obj/aarch64/0P4W6joa Panic String: Unhandled EL1 external data abort Dump Parity: 3539364660 Bounds: 0 Dump Status: good > run pfs db:1:pfs> bt Tracing pid 12 tid 100070 td 0xffff00009c22c600 db_trace_self() at db_trace_self db_stack_trace() at db_stack_trace+0x11c db_command() at db_command+0x358 db_script_exec() at db_script_exec+0x1a4 db_command() at db_command+0x358 db_script_exec() at db_script_exec+0x1a4 db_script_kdbenter() at db_script_kdbenter+0x58 db_trap() at db_trap+0xf4 kdb_trap() at kdb_trap+0x284 handle_el1h_sync() at handle_el1h_sync+0x10 --- exception, esr 0 $d.6() at 0xffff000097000a63 db:1:pfs> show registers spsr 0x600000c5 x0 0x12 x1 0xa x2 0x4 x3 0xa x4 0xffff000000ad0244 generic_bs_w_4 x5 0x50 x6 0xffff00000067adec kvprintf+0x470 x7 0xd5 x8 0x1 x9 0x36c353fc715cf827 x10 0xffff0000023d9000 nfsheur+0x5480 x11 0xfefefefefefefeff x12 0xffff000097000a63 x13 0xfeff00ff0100 x14 0 x15 0 x16 0 x17 0 x18 0xffff000097280590 x19 0xffff000002433000 epoch_array+0x1280 x20 0xffff000002401eb0 vpanic.buf x21 0xffff00009c22c600 x22 0 x23 0xffff000002401000 proc_id_reapmap+0x2870 x24 0xffffa000019efc80 x25 0xffff000002191000 version+0x130 x26 0 x27 0xffff000002192e98 Giant+0x18 x28 0xffffa000019efc80 x29 0xffff000097280590 lr 0xffff000000673a68 kdb_enter+0x40 elr 0xffff000000673a6c kdb_enter+0x44 sp 0xffff000097280590 kdb_enter+0x44: undefined f907c27f db:1:pfs> show pcpu cpuid = 1 dynamic pcpu = 0x3eb20180 curthread = 0xffff00009c22c600: pid 12 tid 100070 critnest 1 "pcib0,0: ath0" curpcb = 0xffff000097280b40 fpcurthread = 0xffff0000e2539000: pid 98459 "snort" idlethread = 0xffff000040ebb800: tid 100004 "idle: cpu1" curvnet = 0 db:1:pfs> run lockinfo db:2:lockinfo> show locks No such command; use "help" to list available commands db:2:lockinfo> show alllocks No such command; use "help" to list available commands db:2:lockinfo> show lockedvnods Locked vnodes db:1:pfs> acttrace Tracing command intr pid 12 tid 100031 td 0xffff000096fb5000 (CPU 0) ipi_stop() at ipi_stop+0x30 arm_gic_v3_intr() at arm_gic_v3_intr+0xe8 intr_irq_handler() at intr_irq_handler+0x7c handle_el1h_irq() at handle_el1h_irq+0xc --- interrupt Tracing command intr pid 12 tid 100070 td 0xffff00009c22c600 (CPU 1) db_trace_self() at db_trace_self _db_stack_trace_all() at _db_stack_trace_all+0xe8 db_command() at db_command+0x358 db_script_exec() at db_script_exec+0x1a4 db_command() at db_command+0x358 db_script_exec() at db_script_exec+0x1a4 db_script_kdbenter() at db_script_kdbenter+0x58 db_trap() at db_trap+0xf4 kdb_trap() at kdb_trap+0x284 handle_el1h_sync() at handle_el1h_sync+0x10 --- exception, esr 0 $d.6() at 0xffff000097000a63 db:1:pfs> ps -
<118> Starting /usr/local/etc/rc.d/sqp_monitor.sh...done. <118>Netgate pfSense Plus 23.05.1-RELEASE arm64 Wed Jun 28 03:57:42 UTC 2023 <118>Bootup complete <6>mvneta0: promiscuous mode enabled ath0: ath_rx_pkt: rs_antenna > 7 (8542452) ath0: ath_rx_pkt: rs_antenna > 7 (8542452) ath0: ath_rx_pkt: rs_antenna > 7 (8542452) ath0: ath_rx_proc: kickpcu; handled 413 packets x0: 0 x1: ffff00009c600000 ($d.6 + 999bb068) x2: 4038 x3: 4 x4: 1 x5: ffff000097280840 ($d.6 + 9463b8a8) x6: 0 x7: 200 x8: ffff000000ad0114 (generic_bs_r_4 + 0) x9: ffff000000acff6c (generic_bs_barrier + 0) x10: 0 x11: 0 x12: 1 x13: 1 x14: 286b x15: 2af8 x16: 2711 x17: 0 x18: ffff000097280880 ($d.6 + 9463b8e8) x19: ffff000096feb000 ($d.6 + 943a6068) x20: ffff00009c600000 ($d.6 + 999bb068) x21: 4038 x22: ffff00000213aa80 (memmap_bus + 0) x23: ffff00009c236a74 ($d.6 + 995f1adc) x24: ffffa000019efc80 x25: ffff000002191000 (version + 130) x26: 0 x27: ffff000002192e98 (Giant + 18) x28: ffffa000019efc80 x29: ffff000097280880 ($d.6 + 9463b8e8) sp: ffff000097280880 lr: ffff000000167114 (ath_hal_reg_read + cc) elr: ffff000000ad0118 (generic_bs_r_4 + 4) spsr: 20000045 far: ffff00009c604038 ($d.6 + 999bf0a0) panic: Unhandled EL1 external data abort cpuid = 1 time = 1715119511 KDB: enter: panic -
Yeah that looks pretty much the same. More is useful though just to be sure.
You have a bunch of ath tunables if I recall? Have you tested without those?
-
@stephenw10 I removed all of them a while ago once it started working normally before the GB fiber
The only one I have left is
vfs.read_max Cluster read-ahead max block count = 128 for Squid
-
@stephenw10 I even installed a brand new out of the box card to see if that resolves it same thing happens with the new card too
-
@stephenw10 Do you want the whole crash report it is huge
-
That's not ath specific though, should be fine
-
@stephenw10 I wonder if I set channels wrong or something on the config side I have it set to 802.11a/n channel 151 or something and I think 11 for FCC with anywhere set and 60second for rekey and 3600 for group that was default values I have BSSintra communication set to no I just don't understand why it worked perfectly with the DSL and won't work now, I also use a traffic shaper for limiters CODEL with it set to 1000mbps to match my fiber line with 5000 for the length same thing reboots when I use that card
-
@stephenw10 TAC asked me to submit a Redmine because they said it is a bug in that Ath driver

