Netgate Discussion Forum
    • Categories
    • Recent
    • Tags
    • Popular
    • Users
    • Search
    • Register
    • Login

    24.03 causes sustained rise in processes count and memory usage.

    Scheduled Pinned Locked Moved General pfSense Questions
    42 Posts 5 Posters 2.5k Views
    Loading More Posts
    • Oldest to Newest
    • Newest to Oldest
    • Most Votes
    Reply
    • Reply as topic
    Log in to reply
    This topic has been deleted. Only users with topic management privileges can see it.
    • keyserK
      keyser Rebel Alliance
      last edited by

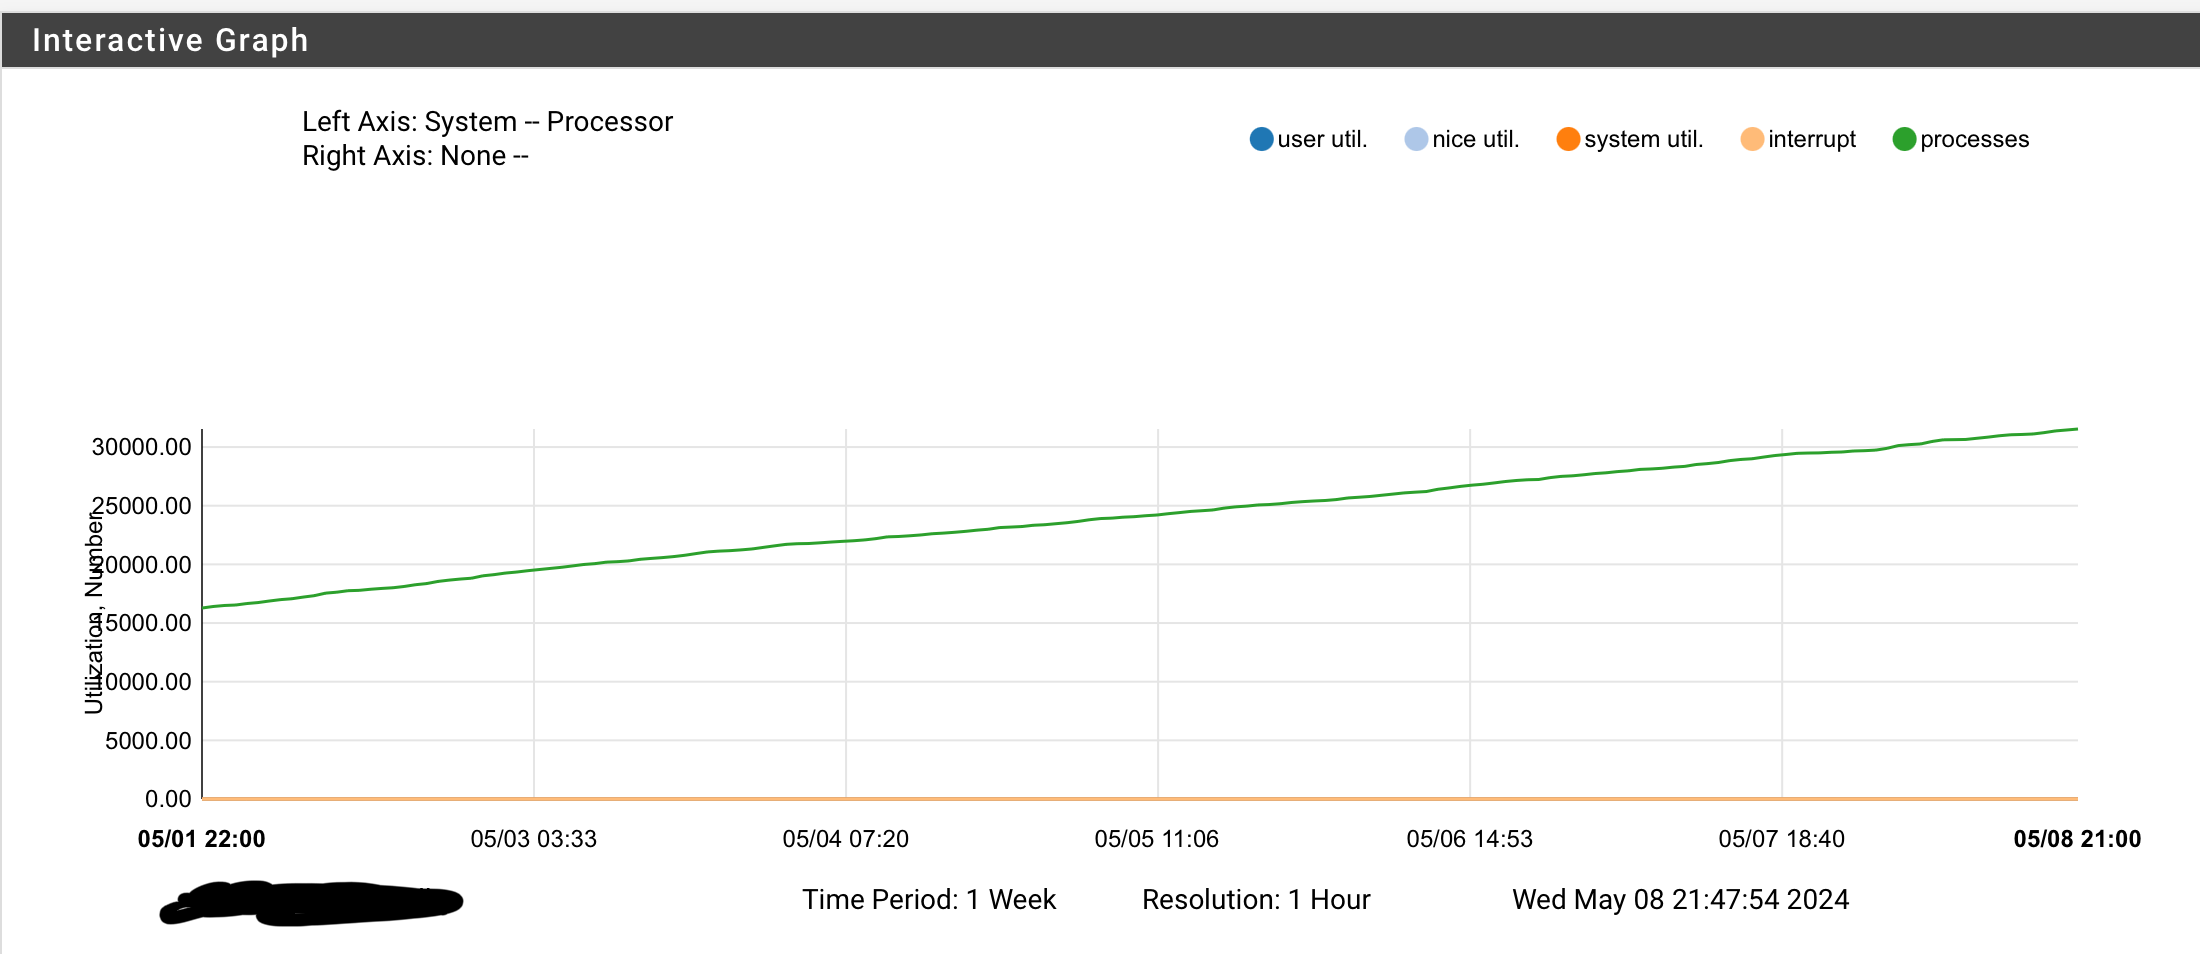
      I have noticed that my memory usage is slowly but steadily increasing after upgraded to 24.03 on both my 2100 and 6100.

      It seems to be caused by an ever increasing number of processes on each system:
      5787f5fc-dfd7-4ef1-9bb8-4094c709ace3-image.png

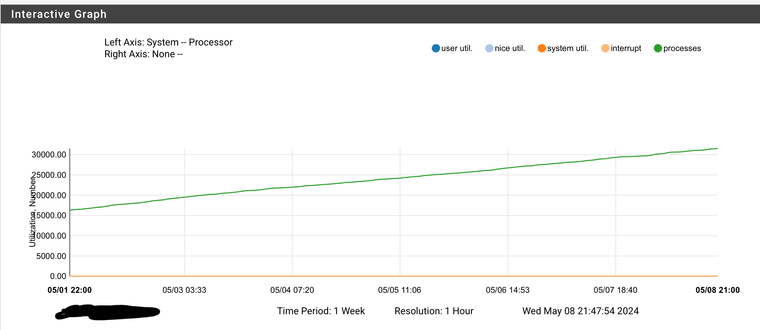
      It will take weeks before it gets critical, but it will reach a critical point going forward.

      I’m not a native linux/BSD so how do I go about diagnosing which process it the culprit (leaves instances behind)?
      ps -aux does not show anything unusual as far as I can see.

      Packages installed:
      NUT
      pfBlockerNG
      LLDPD
      TFTPD
      Freeradius3
      Notes

      Love the no fuss of using the official appliances :-)

      dennypageD 1 Reply Last reply Reply Quote 0
      • dennypageD
        dennypage @keyser
        last edited by

        @keyser Try "ps -Haxuww", which will show threads for each process.

        keyserK 2 Replies Last reply Reply Quote 0
        • keyserK
          keyser Rebel Alliance @dennypage
          last edited by

          @dennypage Thanks - that helped.

          I have about 30.000 lines of these on the 6100 that I showed the monitoring graph from:

          root 0 0.0 6.1 0 503440 - DLs 24Apr24 0:00.00 [kernel/netlink_socket (PID]
          root 0 0.0 6.1 0 503440 - DLs 24Apr24 0:00.00 [kernel/netlink_socket (PID]
          root 0 0.0 6.1 0 503440 - DLs 24Apr24 0:00.00 [kernel/netlink_socket (PID]
          root 0 0.0 6.1 0 503440 - DLs 24Apr24 0:00.00 [kernel/netlink_socket (PID]
          root 0 0.0 6.1 0 503440 - DLs 24Apr24 0:00.00 [kernel/netlink_socket (PID]
          root 0 0.0 6.1 0 503440 - DLs 24Apr24 0:00.00 [kernel/netlink_socket (PID]
          root 0 0.0 6.1 0 503440 - DLs 24Apr24 0:00.00 [kernel/netlink_socket (PID]

          Any Ideas what that is about?

          Love the no fuss of using the official appliances :-)

          dennypageD 1 Reply Last reply Reply Quote 0
          • keyserK
            keyser Rebel Alliance @dennypage
            last edited by

            @dennypage One thing that might be “rare” in my setup compared to others is the fact I’m using the new netflow dump feature - not globally but on a couple of specific rules.
            Could it be a leftover from the export feature?

            Love the no fuss of using the official appliances :-)

            1 Reply Last reply Reply Quote 0
            • dennypageD
              dennypage @keyser
              last edited by

              @keyser Other than it's a kernel thread supporting a netlink connection, no. I don't have any on my system. But is this what is growing?

              Also, I see "PID" in your output. Is there more information in the output from ps?

              keyserK 2 Replies Last reply Reply Quote 0
              • keyserK
                keyser Rebel Alliance @dennypage
                last edited by

                @dennypage I assume this is the culprit as 30.000 of those threads is not normal - and very consistent with the growing list of processes (just passed 30.000).

                I can’t immediately connect those lines with anything in the ps output as there is no actual PID to match - just the text “PID”.

                Any pointers to what I could do to get some more usefull output?

                Love the no fuss of using the official appliances :-)

                dennypageD 1 Reply Last reply Reply Quote 0
                • dennypageD
                  dennypage @keyser
                  last edited by

                  @keyser said in 24.03 causes sustained rise in processes count and memory usage.:

                  I assume this is the culprit as 30.000 of those threads is not normal - and very consistent with the growing list of processes (just passed 30.000).

                  Hang on... do you mean that there are "thirty thousand" of those processes?!?

                  keyserK 1 Reply Last reply Reply Quote 0
                  • stephenw10S
                    stephenw10 Netgate Administrator
                    last edited by

                    If you disable the rules with the netflow data does it stop increasing?

                    keyserK 1 Reply Last reply Reply Quote 0
                    • keyserK
                      keyser Rebel Alliance @dennypage
                      last edited by

                      @dennypage I should mention the problem is exactly the same on my 2100 ARM based box. Thousands of identical lines like those posted here - only the RSS number and date is different (because this box was rebooted the other day - therefore has only reached about 5000 processes until now).

                      Love the no fuss of using the official appliances :-)

                      1 Reply Last reply Reply Quote 0
                      • keyserK
                        keyser Rebel Alliance @dennypage
                        last edited by

                        @dennypage said in 24.03 causes sustained rise in processes count and memory usage.:

                        @keyser said in 24.03 causes sustained rise in processes count and memory usage.:

                        I assume this is the culprit as 30.000 of those threads is not normal - and very consistent with the growing list of processes (just passed 30.000).

                        Hang on... do you mean that there are "thirty thousand" of those processes?!?

                        Yes - like the graph shows and so does my ps -Haxuww output.

                        Love the no fuss of using the official appliances :-)

                        dennypageD 1 Reply Last reply Reply Quote 0
                        • dennypageD
                          dennypage @keyser
                          last edited by

                          @keyser Wow. Yes, I would say that's a problem.

                          I would disable netflow (as @stephenw10 suggested) and see if it stops.

                          1 Reply Last reply Reply Quote 0
                          • keyserK
                            keyser Rebel Alliance @stephenw10
                            last edited by

                            @stephenw10 can’t really do that as those are my internet access rules 😂
                            I would have a family revolte on my hands if I try that….

                            But I could ask it not to dump flows on that rule and see if it stabilizes.
                            I will do that now, but it will take about a day before I can verify if that is the cause.

                            Love the no fuss of using the official appliances :-)

                            dennypageD 1 Reply Last reply Reply Quote 0
                            • dennypageD
                              dennypage @keyser
                              last edited by

                              @keyser I don't think you need to disable the rules, just turn off the netflow output.

                              1 Reply Last reply Reply Quote 0
                              • stephenw10S
                                stephenw10 Netgate Administrator
                                last edited by

                                Yup just disable pflow on them as a test.

                                Is that output truncated? Does it look like:

                                0 412221 kernel              netlink_socket (PID mi_switch _sleep taskqueue_thread_loop fork_exit fork_trampoline
                                
                                keyserK 1 Reply Last reply Reply Quote 0
                                • keyserK
                                  keyser Rebel Alliance @stephenw10
                                  last edited by

                                  @stephenw10 No, it doesn’t seem truncated - there are other normal lines wastly longer than the 30 odd thousant lines that I posted a few of.
                                  The post is a copy of the full lines shown from the ps output.

                                  So no, it does not look like the one you posted.

                                  Love the no fuss of using the official appliances :-)

                                  1 Reply Last reply Reply Quote 0
                                  • stephenw10S
                                    stephenw10 Netgate Administrator
                                    last edited by

                                    Hmm. What do you from procstat -k <pid> using the ID of one of those?

                                    keyserK 1 Reply Last reply Reply Quote 0
                                    • keyserK
                                      keyser Rebel Alliance @stephenw10
                                      last edited by

                                      @stephenw10 said in 24.03 causes sustained rise in processes count and memory usage.:

                                      Hmm. What do you from procstat -k <pid> using the ID of one of those?

                                      Since the PID is “0” in all the 30.000 lines, and only the text “PID” is mentioned at the end of each line, I don’t know which PID to actually use with your command.

                                      Love the no fuss of using the official appliances :-)

                                      1 Reply Last reply Reply Quote 0
                                      • stephenw10S
                                        stephenw10 Netgate Administrator
                                        last edited by

                                        Ah, I see. Hmm....

                                        keyserK 2 Replies Last reply Reply Quote 0
                                        • keyserK
                                          keyser Rebel Alliance @stephenw10
                                          last edited by

                                          @stephenw10 @dennypage It seems its not related to the new netflow export feature. On one box I disabled the export on the two rules I’m monitoring (internet access), and on the other box I disabled netflow export globally in the menu (diabled the feature).

                                          On both boxes another ~ 500 processes was left stranded during the night and inactive memory went up a little more.
                                          Here’s the dump monitor info from the 6100 I showed in the beginning:

                                          4b1aa46b-5795-4a2c-96fe-3e8c3de2cc1e-image.png
                                          1aa6163a-aede-4b46-bd3c-d57b635a4a5a-image.png

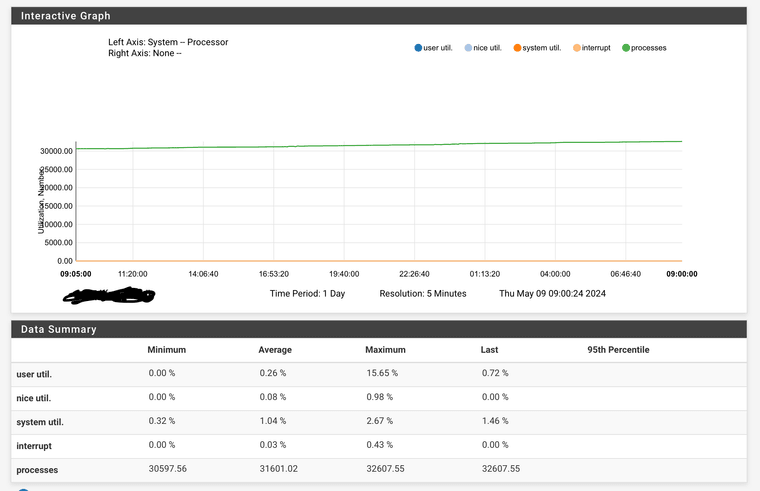
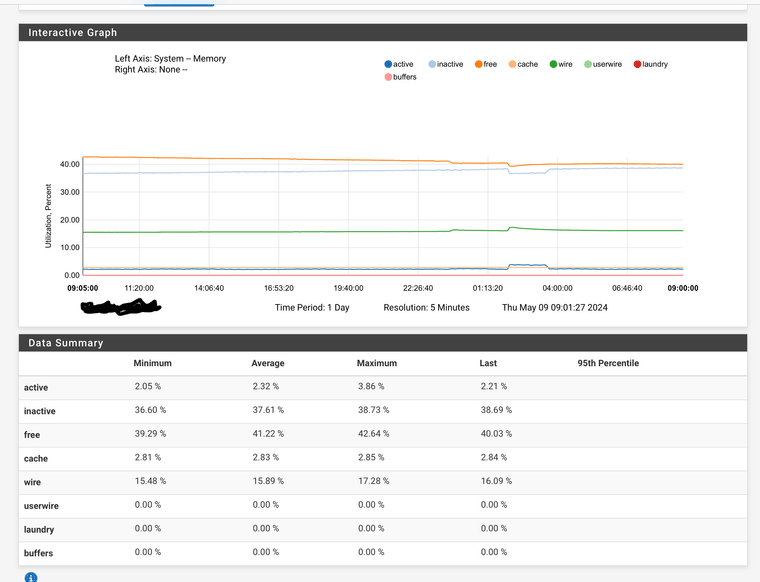
                                          I disabled pfflow about 10 hours ago, and as the monitoring shows it’s still growing. The memory bump at 2:00am is pfblocker releading lists.

                                          Love the no fuss of using the official appliances :-)

                                          1 Reply Last reply Reply Quote 0
                                          • keyserK
                                            keyser Rebel Alliance @stephenw10
                                            last edited by

                                            @stephenw10 @dennypage I afterwards did some faultfinding logic by restarting services one at the time to see any impact on processes/memory, and I have found the culprit.

                                            The problem is related to the BSNMPD service (the built in SNMPD) that I’m using to monitor my pfSenses from Zabbix.
                                            When I restart that service all the thousands of stranded processes and their memory usage is freed, and the boxes are back to their expected levels.
                                            Obviously it starts climbing again, so what can I do to help you guys figure the root cause so it can be fixed?

                                            Any help on “debugging” whats causing BSNMPD to leave the processes(memory) stranded would be good - it would help me create a more specific redmine ticket on the issue.

                                            I’m using a community pfSense Template in Zabbix and using SMNPv2 which is all the buildin smnpd supports.

                                            Love the no fuss of using the official appliances :-)

                                            K 1 Reply Last reply Reply Quote 0
                                            • First post
                                              Last post
                                            Copyright 2025 Rubicon Communications LLC (Netgate). All rights reserved.