24.03_1 “Traffic Graphs” does not keep its configuration
-
I've just done an interesting test
- Restarted my Pfsense
- On connection, I can visually see the graphs displayed normally.
- Then I click on the green “verify” button (displayed towards the top of the page)
- The graphs have disappeared
- Here's what I have in my XML BEFORE I put the ticks back
<traffic_graphs> <refreshinterval>1</refreshinterval> <invert>true</invert> <backgroundupdate>true</backgroundupdate> <smoothfactor>0</smoothfactor> <size>1</size> <filter>wan,lan,opt1,opt2,opt3,opt5</filter> </traffic_graphs> -
Ah, you have manual BE boot verification enabled?
Does any config change survive a reboot?
It sounds like it might be rolling back the BE.
-
I haven't manually activated this option (I don't know where it is).
I haven't noticed any settings that haven't been saved, but I haven't done any specific tests in this sense
-
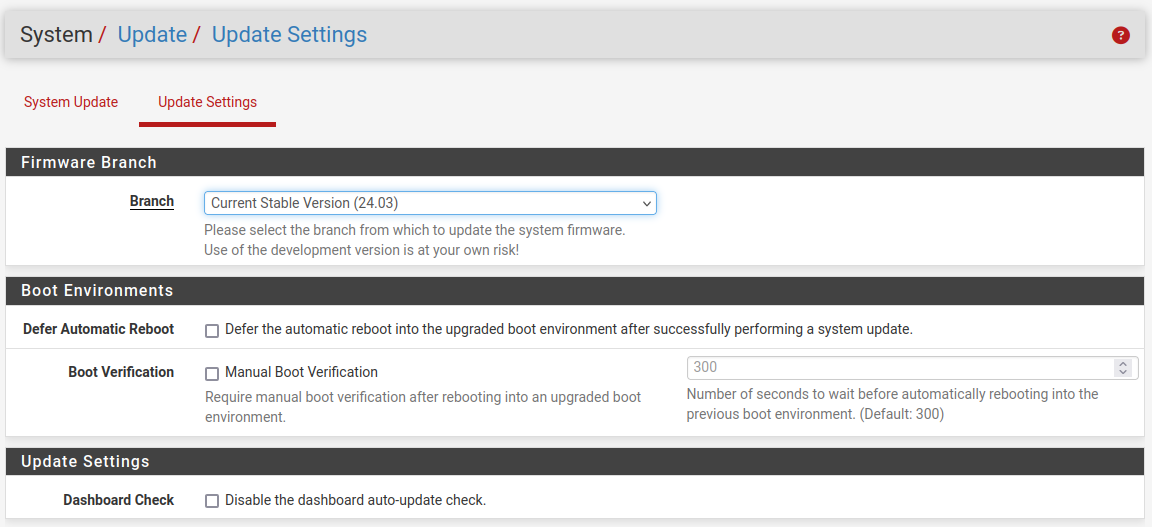
It's in the update settings:

What exactly are you clicking on after rebooting?
-
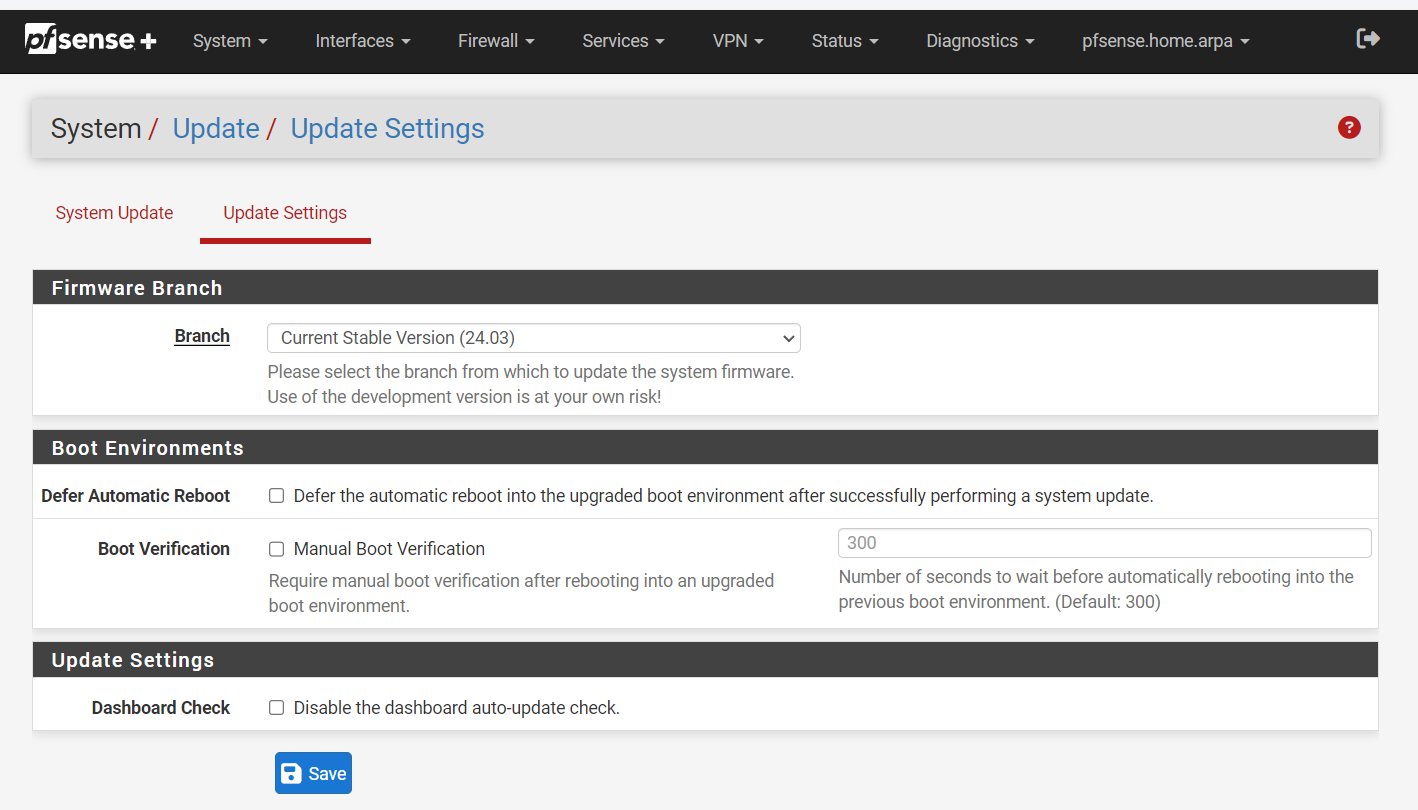
Here is my current configuration
For security reasons during an update, should I set the ‘Boot Verification’ option instead?

-
No that's fine. Can you get a screenshot of the green button you are clicking after reboot?
-
One more piece of information ... and before reading your last message (because no more network))
I rebooted my Pfsense, and just after the boot (I connect it quickly) I have this message:

If I do nothing (i.e. I do NOT touch the green button), the graphics are there and remain!
In short, I'm going too fast to connect ... sorry to have taken your time for a problem that is not a problem
-
This post is deleted! -
Yup the
-1there in the countdown seconds means it hasn't yet triggered the countdown because bootup is still running. You see that if you login immediately.However I wouldn't expect the config to be changed...
-
Perhaps a ‘tiny bug’?
Thanks again for all your help and friendly replies, it's always nice to be taken seriously (even when you're not a ‘pro’ in Pfsense) and to get help!
-
@stephenw10 FWIW, I've experienced this a couple of times. Following reboot, getting a message saying that I need to verify the boot, even though I do not have manual boot verification enabled. When this happens I also see all the interfaces in the traffic graphs widget unchecked. Unfortunately I haven't had time to explore it.
-
Hmm, when you click verify or just whenever it appears?
-
Just tried a few times.
If I go into the UI very quickly following reboot, I find this:

If I leave it alone, all is good. However, if I click on the Verify button, I get this:
@@ -5877,7 +5867,7 @@ <invert>false</invert> <size>8</size> <backgroundupdate>true</backgroundupdate> - <filter>opt4,enc0</filter> + <filter>wan,lan,opt2,opt3,opt4,enc0</filter> <smoothfactor>0</smoothfactor> </traffic_graphs> <gateways-0> -
Huh. Well that seems like a bug. Does it log a reason for the config change in the history?
-
if you give me some clues as to where to find the answer, I'll be happy to put it here
-
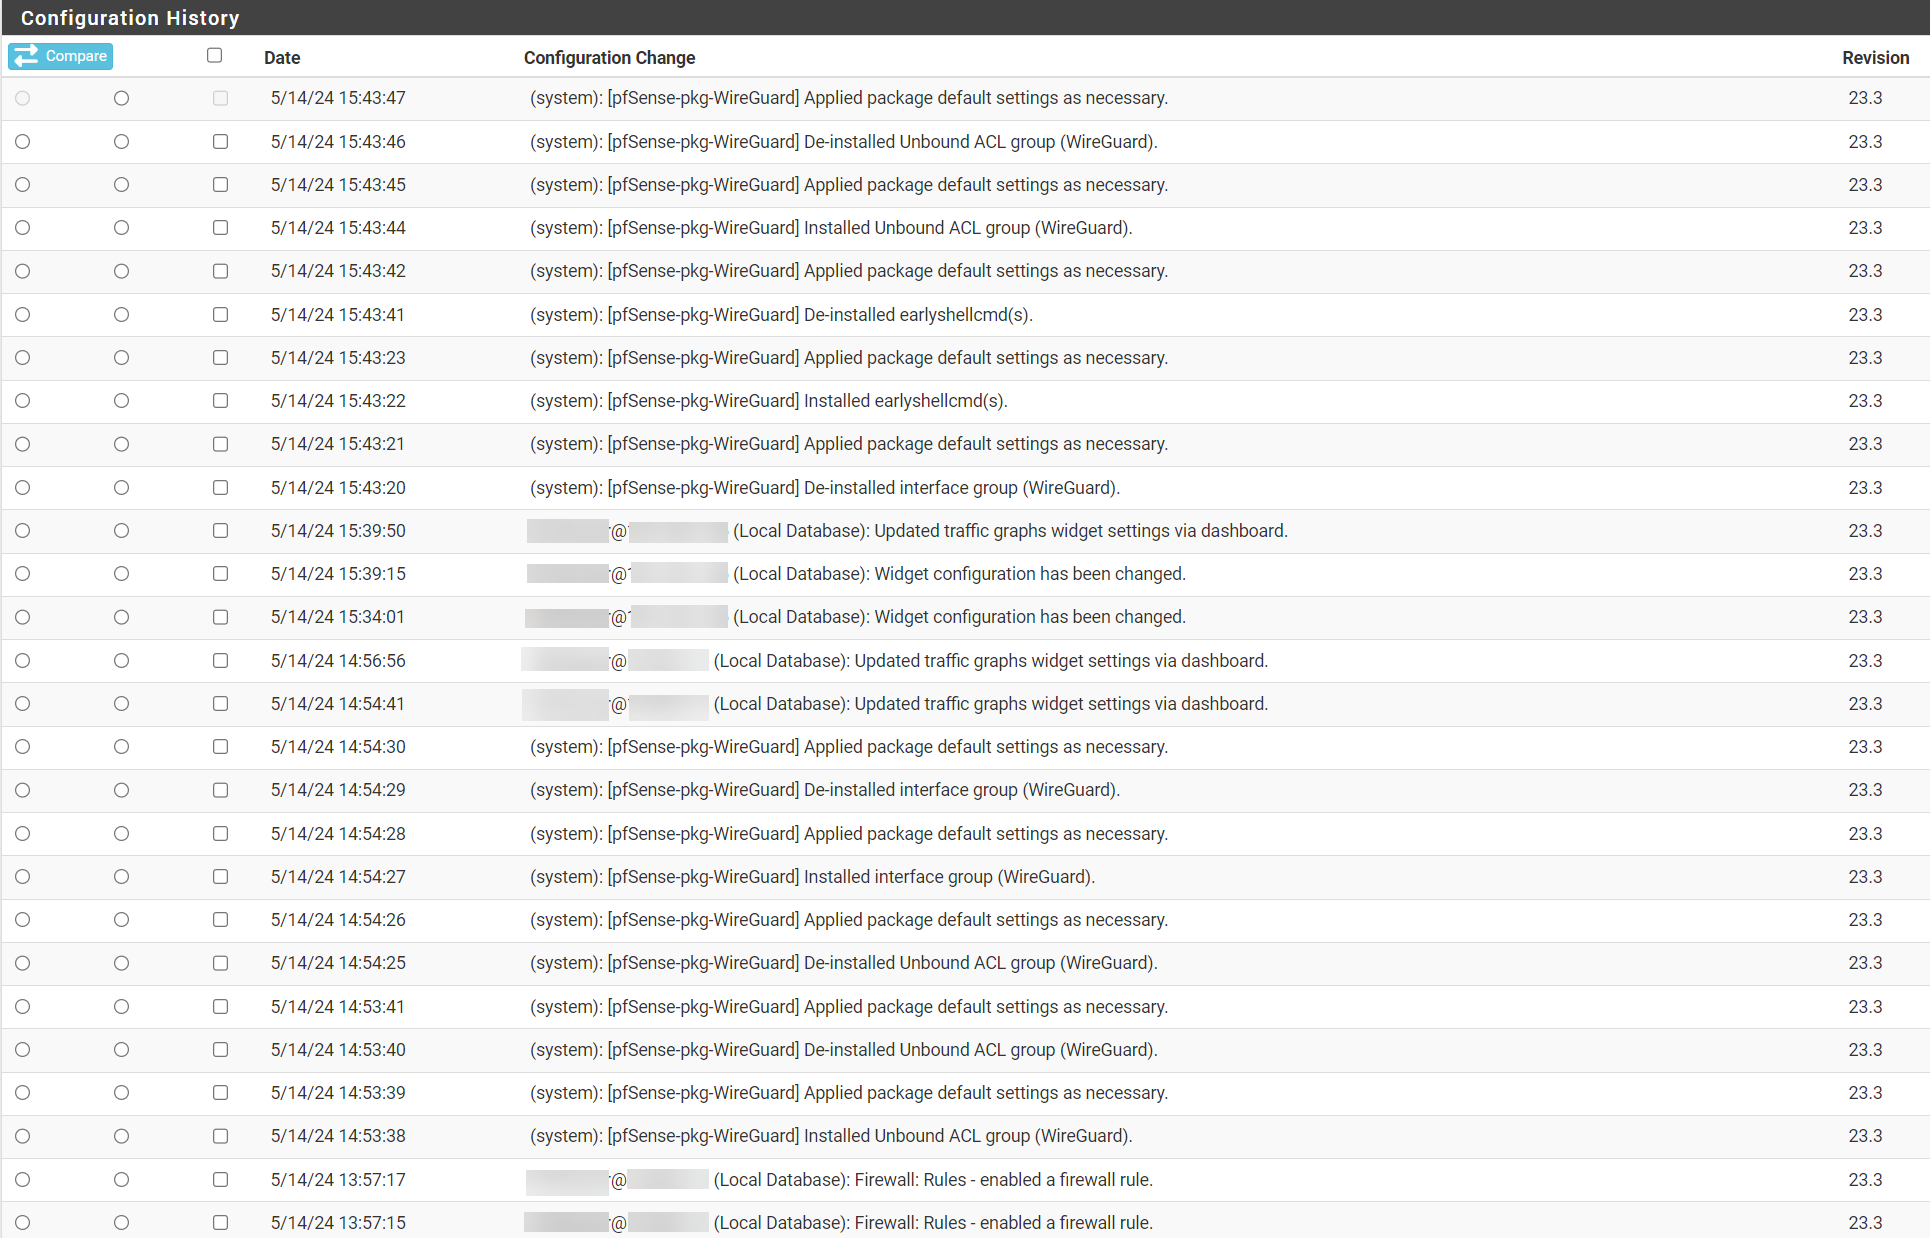
In Diag > Backp/Restore > Config History
You should see all the recent changes and it usually gives a brief description of what changed and often what called that change if it's something automatic.
-
@stephenw10
I'm not a specialist, but I don't think there's anything interesting here.
-
Hmm, so those last set of changes at 15:43 were the last reboot including you clicking on the verify button?
-
@stephenw10 said in 24.03_1 “Traffic Graphs” does not keep its configuration:
Does it log a reason for the config change in the history?
It's a repeat of the prior log entry. I.E. my workstation address and my login and "Updated traffic graphs widget settings via dashboard."
-
@stephenw10
Normally yes, because I did these tests live with you.

