Netgate Discussion Forum
    • Categories
    • Recent
    • Tags
    • Popular
    • Users
    • Search
    • Register
    • Login

    Poor 10gbps WAN throughput

    Scheduled Pinned Locked Moved General pfSense Questions
    42 Posts 8 Posters 2.6k Views
    Loading More Posts
    • Oldest to Newest
    • Newest to Oldest
    • Most Votes
    Reply
    • Reply as topic
    Log in to reply
    This topic has been deleted. Only users with topic management privileges can see it.
    • V
      vertigo8
      last edited by

      Hi

      I'm having issues with my 10gbps wan connection, using a fresh/factory reset install, and also a highly configured install.

      For both of the above, I encounter poor speeds of 1700mbps to 2000mbps with speedtest.net. Once I turn the firewall off in pfsense, the speed instantly doubles to around 4000 to 5000mbps.

      I also get 4000 to 5000 mbps directly connecting to my ONT and avoiding pfsense altogether.

      I've tried setting hardware offloading to off, still poor

      Any ideas?

      Thanks

      GertjanG Dobby_D 2 Replies Last reply Reply Quote 0
      • GertjanG
        Gertjan @vertigo8
        last edited by

        @vertigo8 said in Poor 10gbps WAN throughput:

        Any ideas?

        @vertigo8 said in Poor 10gbps WAN throughput:

        I also get 4000 to 5000 mbps directly connecting to my ONT

        You connect what (brand, type, type of connection ?) to what (brand, type, type of connection ?).
        Knowing that that hardware works, put the very same hardware on your pfSense ^^
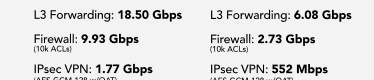
        4 Gbits / sec is about 120 Million Ethernet packets per second (each 1500 bytes) which have to be copied from one NIC (like WAN) to another NIC (like LAN).

        It should be possible if you use a device like this. 4100 or higher.

        No "help me" PM's please. Use the forum, the community will thank you.
        Edit : and where are the logs ??

        1 Reply Last reply Reply Quote 0
        • stephenw10S
          stephenw10 Netgate Administrator
          last edited by

          Yup what hardware are you using? CPU? NICs?

          1 Reply Last reply Reply Quote 0
          • Dobby_D
            Dobby_ @vertigo8
            last edited by

            @vertigo8 said in Poor 10gbps WAN throughput:

            I'm having issues with my 10gbps wan connection, using a fresh/factory reset install, and also a highly configured install.

            What appliance you are using? (Brand)
            What network cards (NIC´s) you are using?
            What CPU, RAM CPU clock speed, cores,...?

            For both of the above, I encounter poor speeds of 1700mbps to 2000mbps
            with speedtest.net.

            Ok this should be more normal as I see it.
            0 - 2000 MBit/s low traffic
            2000 - 4000 MBit/s normal traffic
            4000 - 7000 MBit/s high traffic or load
            7000 - 9200 or 9400 MBit/s with hardware tuning or plain other setting´s

            Once I turn the firewall off in pfsense, the speed instantly doubles to around 4000 to 5000mbps.

            A modem will even be faster then a firewall! Nothing fancy and also
            routers (only) will be much faster.

            I also get 4000 to 5000 mbps directly connecting to my ONT and avoiding pfsense altogether.

            As stated above, answer the questions it might be best to answer here.

            I've tried setting hardware offloading to off, still poor

            All or only part wise?

            Any ideas?

            Tech specs from your appilance first!

            #~. @Dobby

            Turris Omnia - 4 Ports - 2 GB RAM / TurrisOS 7 Release (Btrfs)
            PC Engines APU4D4 - 4 Ports - 4 GB RAM / pfSense CE 2.7.2 Release (ZFS)
            PC Engines APU6B4 - 4 Ports - 4 GB RAM / pfSense+ (Plus) 24.03_1 Release (ZFS)

            1 Reply Last reply Reply Quote 0
            • V
              vertigo8
              last edited by vertigo8

              Nokia ONT > pfsense 6100 ix0 port > ix1 port (LAN) > endpoint with 10gb asus NIC on win11

              ix ports are Intel chipset.

              You can assume Factory reset setup on the 6100. Default firewall rules. No additional applications installed. Hardware offloading within advanced settings was enabled but made no difference, so disabled it again.

              If I connect from my endpoint speed is 1700 to 2000mbps.

              Connecting to the ONT direct gives 4000 to 5000, possibly 6000. Turning firewall off gives the same result here as well.

              GertjanG 1 Reply Last reply Reply Quote 0
              • stephenw10S
                stephenw10 Netgate Administrator
                last edited by

                Hmm, I would certainly expect more than that. Depending on how you're testing I'd expect to see >3Gbps at least.

                Are you using a multistream test?

                1 Reply Last reply Reply Quote 0
                • GertjanG
                  Gertjan @vertigo8
                  last edited by

                  @vertigo8 said in Poor 10gbps WAN throughput:

                  You can assume Factory reset setup on the 6100

                  Ok, thanks.
                  Read these sheets to make tests comparable.

                  Your looking for :

                  54b73cae-42d0-4ba3-aec6-70db9ff49b33-image.png

                  so you should be able to reproduce :

                  06fa2f1c-8466-4930-8d9a-2112370644bf-image.png

                  No "help me" PM's please. Use the forum, the community will thank you.
                  Edit : and where are the logs ??

                  1 Reply Last reply Reply Quote 0
                  • V
                    vertigo8
                    last edited by

                    I am using speedtest.net, multistream tests.

                    I'm gauging my speed on basic data download.

                    Any ideas on what I can do?

                    1 Reply Last reply Reply Quote 0
                    • stephenw10S
                      stephenw10 Netgate Administrator
                      last edited by

                      Check the CPU usage from the CLI using top -HaSP whilst running the test. Is any CPU core hitting 100%?

                      V 1 Reply Last reply Reply Quote 0
                      • V
                        vertigo8 @stephenw10
                        last edited by

                        @stephenw10 said in Poor 10gbps WAN throughput:

                        Check the CPU usage from the CLI using top -HaSP whilst running the test. Is any CPU core hitting 100%?

                        All CPUs barely go over 0.5%

                        G stephenw10S V 3 Replies Last reply Reply Quote 0
                        • G
                          Gblenn @vertigo8
                          last edited by

                          @vertigo8 Perhaps a long shot, but I am having trouble with my 10G card on my Win11 machine. It's a TP-Link TX401, but I believe it's the same Marvell AQtion chipset as you have on ASUS.

                          My card caps out at ~2 Gig unless I do a "repair" of the driver. The one I found working and getting best speeds is version 3.1.7, downloaded directly from Marvell's site.

                          https://www.marvell.com/support/downloads.html#
                          Select Public Drivers and then AQC107
                          It sais version 3.1.8 dated 11/29/23 but when you extract it it's 3.1.7

                          I am in the unfortunate situation that I have to do a repair of the driver every time I start up my PC. It works fine with a reboot, after a shutdown and start something happens that makes it cap out at 2 Gbit.

                          V 1 Reply Last reply Reply Quote 0
                          • stephenw10S
                            stephenw10 Netgate Administrator @vertigo8
                            last edited by

                            @vertigo8 said in Poor 10gbps WAN throughput:

                            All CPUs barely go over 0.5%

                            That seems hard to believe. That's whilst passing ~2Gbps? That should be loading the CPUs significantly.

                            You can hit 'q' to quite top and it will leave the info available to copy/paste out. Can you show the actual results?

                            V 1 Reply Last reply Reply Quote 0
                            • V
                              vertigo8 @stephenw10
                              last edited by

                              @stephenw10 whoops. yes, here's the output

                                PID USERNAME    PRI NICE   SIZE    RES STATE    C   TIME     CPU COMMAND
                                 11 root        187 ki31     0B    64K RUN      3   6:38  74.86% [idle{idle:
                                  0 root        -60    -     0B  1664K CPU2     2   0:18  72.05% [kernel{if_i
                                 11 root        187 ki31     0B    64K RUN      0   6:42  62.27% [idle{idle:
                                  0 root        -60    -     0B  1664K -        1   0:12  57.30% [kernel{if_i
                                 11 root        187 ki31     0B    64K CPU1     1   6:39  38.82% [idle{idle:
                                  0 root        -60    -     0B  1664K -        0   0:12  31.24% [kernel{if_i
                                 11 root        187 ki31     0B    64K CPU2     2   6:39  27.40% [idle{idle:
                                  0 root        -60    -     0B  1664K CPU3     3   0:13  20.39% [kernel{if_i
                                600 root         68    0   140M    50M accept   3   0:17   0.27% php-fpm: poo
                                  0 root        -60    -     0B  1664K -        3   0:02   0.13% [kernel{if_c
                                  7 root        -16    -     0B    16K pftm     0   0:00   0.10% [pf purge]
                              
                              
                              1 Reply Last reply Reply Quote 0
                              • V
                                vertigo8 @vertigo8
                                last edited by

                                This post is deleted!
                                1 Reply Last reply Reply Quote 0
                                • V
                                  vertigo8 @Gblenn
                                  last edited by

                                  @Gblenn said in Poor 10gbps WAN throughput:

                                  @vertigo8 Perhaps a long shot, but I am having trouble with my 10G card on my Win11 machine. It's a TP-Link TX401, but I believe it's the same Marvell AQtion chipset as you have on ASUS.

                                  My card caps out at ~2 Gig unless I do a "repair" of the driver. The one I found working and getting best speeds is version 3.1.7, downloaded directly from Marvell's site.

                                  https://www.marvell.com/support/downloads.html#
                                  Select Public Drivers and then AQC107
                                  It sais version 3.1.8 dated 11/29/23 but when you extract it it's 3.1.7

                                  I am in the unfortunate situation that I have to do a repair of the driver every time I start up my PC. It works fine with a reboot, after a shutdown and start something happens that makes it cap out at 2 Gbit.

                                  it would seem this does matter, I've been using another box of mine, with an Intel X550 10gbps onboard. Better speeds but still

                                  1 Reply Last reply Reply Quote 0
                                  • stephenw10S
                                    stephenw10 Netgate Administrator
                                    last edited by

                                    Ok that looks more like what I'd expect. Are you able to get the full output including the headers like:

                                    last pid: 99664;  load averages:  0.07,  0.20,  0.21                                                                                up 33+11:14:15  13:04:25
                                    365 threads:   3 running, 341 sleeping, 21 waiting
                                    CPU 0:  0.0% user,  0.4% nice,  1.2% system,  0.0% interrupt, 98.4% idle
                                    CPU 1:  0.0% user,  0.0% nice,  1.6% system,  0.0% interrupt, 98.4% idle
                                    Mem: 206M Active, 1361M Inact, 218M Wired, 84M Buf, 206M Free
                                    
                                      PID USERNAME    PRI NICE   SIZE    RES STATE    C   TIME    WCPU COMMAND
                                       10 root        187 ki31     0B    16K CPU0     0 744.7H  98.73% [idle{idle: cpu0}]
                                       10 root        187 ki31     0B    16K RUN      1 743.5H  97.83% [idle{idle: cpu1}]
                                    68975 root         20    0    12M  5700K select   1 406:19   1.03% /usr/local/sbin/ntpd -g -c /var/etc/ntpd.conf -p /var/run/ntpd.pid{ntpd}
                                     8617 root         53   20   449M   418M bpf      1 112:32   0.60% /usr/local/bin/snort -R _6830 -M -D -q --suppress-config-log --daq pcap --daq-mode passiv
                                        0 root        -64    -     0B   176K -        0 186:10   0.36% [kernel{dummynet}]
                                    99664 root         20    0  7452K  3440K CPU1     1   0:00   0.30% top -HaSP
                                       14 root        -60    -     0B    88K -        0 105:45   0.22% [usb{usbus1}]
                                    
                                    V 4 Replies Last reply Reply Quote 0
                                    • V
                                      vertigo8 @stephenw10
                                      last edited by vertigo8

                                      This post is deleted!
                                      1 Reply Last reply Reply Quote 0
                                      • V
                                        vertigo8 @stephenw10
                                        last edited by

                                        This post is deleted!
                                        1 Reply Last reply Reply Quote 0
                                        • V
                                          vertigo8 @stephenw10
                                          last edited by vertigo8

                                          This post is deleted!
                                          1 Reply Last reply Reply Quote 0
                                          • V
                                            vertigo8 @stephenw10
                                            last edited by

                                            @stephenw10 said in Poor 10gbps WAN throughput:

                                            Ok that looks more like what I'd expect. Are you able to get the full output including the headers like:

                                            last pid: 99664;  load averages:  0.07,  0.20,  0.21                                                                                up 33+11:14:15  13:04:25
                                            365 threads:   3 running, 341 sleeping, 21 waiting
                                            CPU 0:  0.0% user,  0.4% nice,  1.2% system,  0.0% interrupt, 98.4% idle
                                            CPU 1:  0.0% user,  0.0% nice,  1.6% system,  0.0% interrupt, 98.4% idle
                                            Mem: 206M Active, 1361M Inact, 218M Wired, 84M Buf, 206M Free
                                            
                                              PID USERNAME    PRI NICE   SIZE    RES STATE    C   TIME    WCPU COMMAND
                                               10 root        187 ki31     0B    16K CPU0     0 744.7H  98.73% [idle{idle: cpu0}]
                                               10 root        187 ki31     0B    16K RUN      1 743.5H  97.83% [idle{idle: cpu1}]
                                            68975 root         20    0    12M  5700K select   1 406:19   1.03% /usr/local/sbin/ntpd -g -c /var/etc/ntpd.conf -p /var/run/ntpd.pid{ntpd}
                                             8617 root         53   20   449M   418M bpf      1 112:32   0.60% /usr/local/bin/snort -R _6830 -M -D -q --suppress-config-log --daq pcap --daq-mode passiv
                                                0 root        -64    -     0B   176K -        0 186:10   0.36% [kernel{dummynet}]
                                            99664 root         20    0  7452K  3440K CPU1     1   0:00   0.30% top -HaSP
                                               14 root        -60    -     0B    88K -        0 105:45   0.22% [usb{usbus1}]
                                            
                                            last pid: 52380;  load averages:  1.18,  0.75,  0.44                                                                                                           up 0+00:13:11  12:42:43
                                            312 threads:   6 running, 272 sleeping, 34 waiting
                                            CPU 0:  0.0% user,  0.0% nice, 62.2% system,  0.0% interrupt, 37.8% idle
                                            CPU 1:  0.0% user,  0.0% nice, 41.3% system,  0.0% interrupt, 58.7% idle
                                            CPU 2:  0.0% user,  0.0% nice, 69.7% system,  0.0% interrupt, 30.3% idle
                                            CPU 3:  0.0% user,  0.0% nice, 23.7% system,  0.0% interrupt, 76.3% idle
                                            Mem: 127M Active, 111M Inact, 506M Wired, 56K Buf, 7038M Free
                                            ARC: 118M Total, 21M MFU, 93M MRU, 132K Anon, 771K Header, 3098K Other
                                                 88M Compressed, 222M Uncompressed, 2.53:1 Ratio
                                            Swap: 1024M Total, 1024M Free
                                            
                                              PID USERNAME    PRI NICE   SIZE    RES STATE    C   TIME    WCPU COMMAND
                                               11 root        187 ki31     0B    64K RUN      3  11:44  75.72% [idle{idle: cpu3}]
                                                0 root        -60    -     0B  1664K CPU2     2   1:06  71.20% [kernel{if_io_tqg_2}]
                                                0 root        -60    -     0B  1664K -        0   0:59  60.35% [kernel{if_io_tqg_0}]
                                               11 root        187 ki31     0B    64K CPU1     1  11:33  57.13% [idle{idle: cpu1}]
                                                0 root        -60    -     0B  1664K -        1   1:02  42.81% [kernel{if_io_tqg_1}]
                                               11 root        187 ki31     0B    64K CPU0     0  11:41  39.58% [idle{idle: cpu0}]
                                               11 root        187 ki31     0B    64K RUN      2  11:31  28.48% [idle{idle: cpu2}]
                                                0 root        -60    -     0B  1664K -        3   0:52  24.20% [kernel{if_io_tqg_3}]
                                                0 root        -60    -     0B  1664K -        2   0:02   0.13% [kernel{if_config_tqg_0}]
                                            24441 root         20    0    14M  4396K CPU3     3   0:00   0.09% top -HaSP
                                                7 root        -16    -     0B    16K pftm     3   0:00   0.04% [pf purge]
                                            74843 root         20    0    13M  3628K bpf      0   0:00   0.04% /usr/local/sbin/filterlog -i pflog0 -p /var/run/filterlog.pid
                                            99573 root         20    0    13M  2992K kqread   3   0:00   0.02% /usr/sbin/syslogd -s -c -c -l /var/dhcpd/var/run/log -P /var/run/syslog.pid -f /etc/syslog.conf
                                                2 root        -60    -     0B    64K WAIT     0   0:00   0.01% [clock{clock (0)}]
                                            85053 unbound      20    0    85M    54M kqread   1   0:00   0.01% /usr/local/sbin/unbound -c /var/unbound/unbound.conf{unbound}
                                                8 root        -16    -     0B    16K -        1   0:00   0.01% [rand_harvestq]
                                            29967 root         20    0    22M    11M select   2   0:00   0.01% sshd: admin@pts/0 (sshd)
                                               21 root        -16    -     0B    48K psleep   3   0:00   0.01% [pagedaemon{dom0}]
                                            88168 dhcpd        20    0    27M    13M select   3   0:00   0.01% /usr/local/sbin/dhcpd -user dhcpd -group _dhcp -chroot /var/dhcpd -cf /etc/dhcpd.conf -pf /var/run/dhcpd.pid ix1 ig
                                            

                                            Oops, truncated the output. This is what it's like during the test

                                            1 Reply Last reply Reply Quote 0
                                            • First post
                                              Last post
                                            Copyright 2025 Rubicon Communications LLC (Netgate). All rights reserved.