Netgate 8200 what tests to do with iPerf3 -> problems
-
Do you mean while the test is running? Or that it still fails after the test has finished?
Do you see anything logged? Anything on the Interfaces > Status page? Is the NIC still showing as linked?
Steve
-
Hello Steve,
I'll put the parameters I used to run my tests here later.
In fact, I've “noticed” one thing... if I run (in a CMD” command) every test BUT waiting for pfsense's CPU and memory usage to come down, I have a harder time blocking everything.
Typically, I run the “iperf3” command and in the best case I get 2 or 3 lines displayed, then nothing in the CMD window, iperf seems frozen (I have to press ctrl-C to stop the process).
Then my PC is still connected (GUI) to pfsense and fortunately I can still access the “reboot” command... in the meantime, I have no wifi, no access to my switches and others (which are on my LAN like my VLANs).
I'm sorry my explanations aren't always very clear... my English is just Google translated English.
I'm currently reading the https://forum.netgate.com/topic/182534/just-purchased-a-netgate-8200-having-a-few-issues/12 topic and I've just put in the proposed modifications. I'll wait until I get home to run a new test with these values and see if I freeze pfsense again.
EDIT
With the modifications made (thanks) on the link above, here are the results AND, above all, I was no longer able to block pfsense (just slow it down a little).iperf3.exe -c 192.168.1.1 -P 100
[SUM] 0.00-10.00 sec 8.30 GBytes 7.13 Gbits/sec sender
[SUM] 0.00-10.00 sec 8.27 GBytes 7.11 Gbits/sec receiveriperf3.exe -c 192.168.1.1 -P 10
[SUM] 0.00-10.00 sec 5.69 GBytes 4.89 Gbits/sec sender
[SUM] 0.00-10.00 sec 5.69 GBytes 4.88 Gbits/sec receiveriperf3.exe -c 192.168.1.1 -P 50
[SUM] 0.00-10.00 sec 8.14 GBytes 6.99 Gbits/sec sender
[SUM] 0.00-10.00 sec 8.13 GBytes 6.99 Gbits/sec receiveriperf3.exe -c 192.168.1.1 -P 8
[SUM] 0.00-10.00 sec 5.47 GBytes 4.70 Gbits/sec sender
[SUM] 0.00-10.00 sec 5.47 GBytes 4.70 Gbits/sec receivervmstat -i
cpu0:timer 438153 208
cpu1:timer 851223 403
cpu2:timer 442786 210
cpu3:timer 551482 261
cpu4:timer 331664 157
cpu5:timer 434263 206
cpu6:timer 517970 245
cpu7:timer 305809 145 -
There is little point using more than 8 parallel streams because the ix NICs have 8 queues.
How exactly are you testing? From a Windows client to pfSense directly as the server?
-
Thanks for clarifying the “8” parameter

Yes, Pfsense iPerf server and on my Windows 11 I run iPerf
I currently have these settings:
net.isr.maxthreads="-1"
net.isr.bindthreads="1"
machdep.hyperthreading_intr_allowed="1"legal.intel_iwi.license_ack="1"
kern.ipc.nmbclusters="1000000"
kern.ipc.nmbjumbop="524288"
dev.ix.0.iflib.override_nrxqs="8"
dev.ix.0.iflib.override_ntxqs="8"
dev.ix.1.iflib.override_nrxqs="8"
dev.ix.1.iflib.override_ntxqs="8"
dev.ix.0.iflib.separate_txrx="1"
dev.ix.1.iflib.separate_txrx="1"
dev.ix.0.iflib.rx_budget="65535"
dev.ix.1.iflib.rx_budget="65535"
dev.ix.0.iflib.override_nrxds="4096"
dev.ix.1.iflib.override_nrxds="4096"
dev.ix.0.iflib.override_ntxds="4096"
dev.ix.1.iflib.override_ntxds="4096"hw.intr_storm_threshold="10000"
What do you think of these “numbers”?
I read somewhere that you should double the value set for “Receive buffers” (here 4096) compared with the value for “Transmit buffers” (here 4096).Should I set “8192” for “ntxds”?
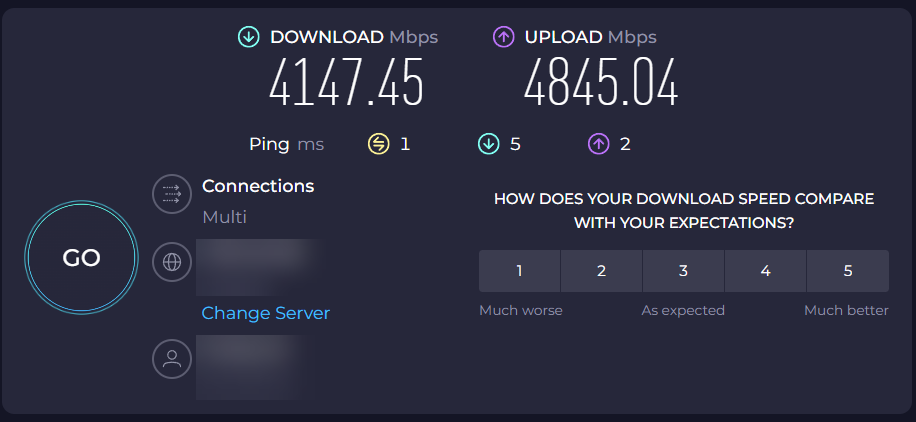
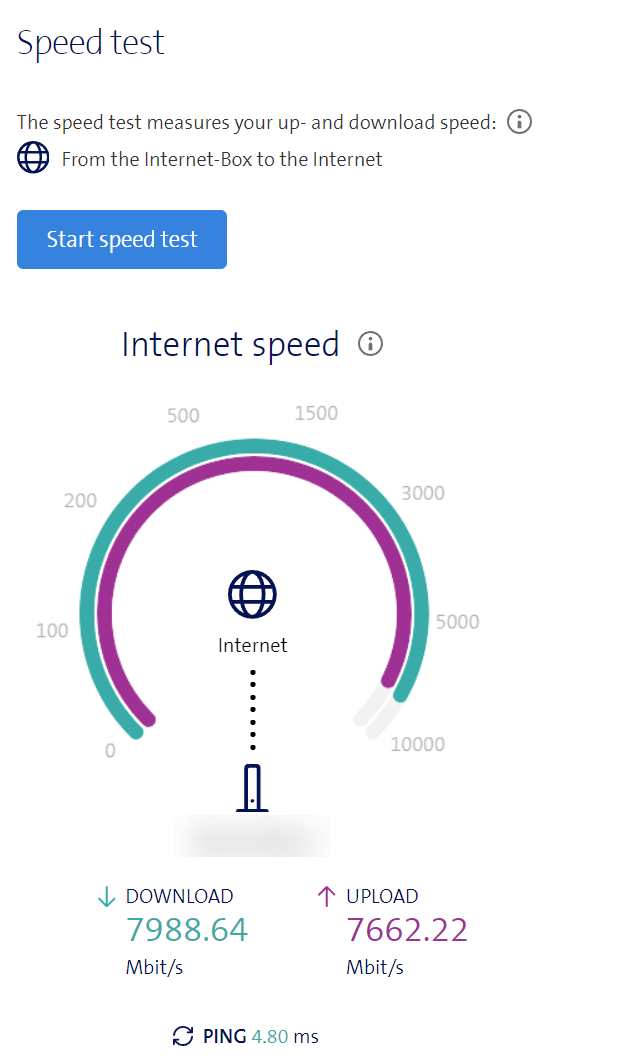
My speed directly from my FAI box
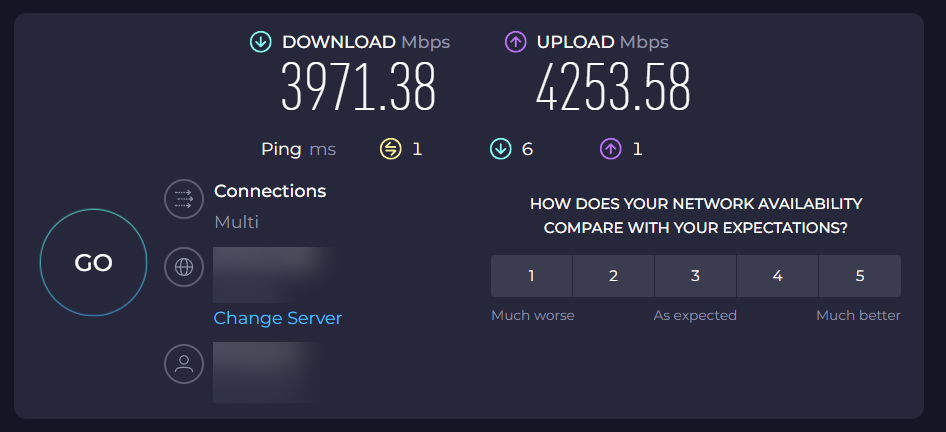
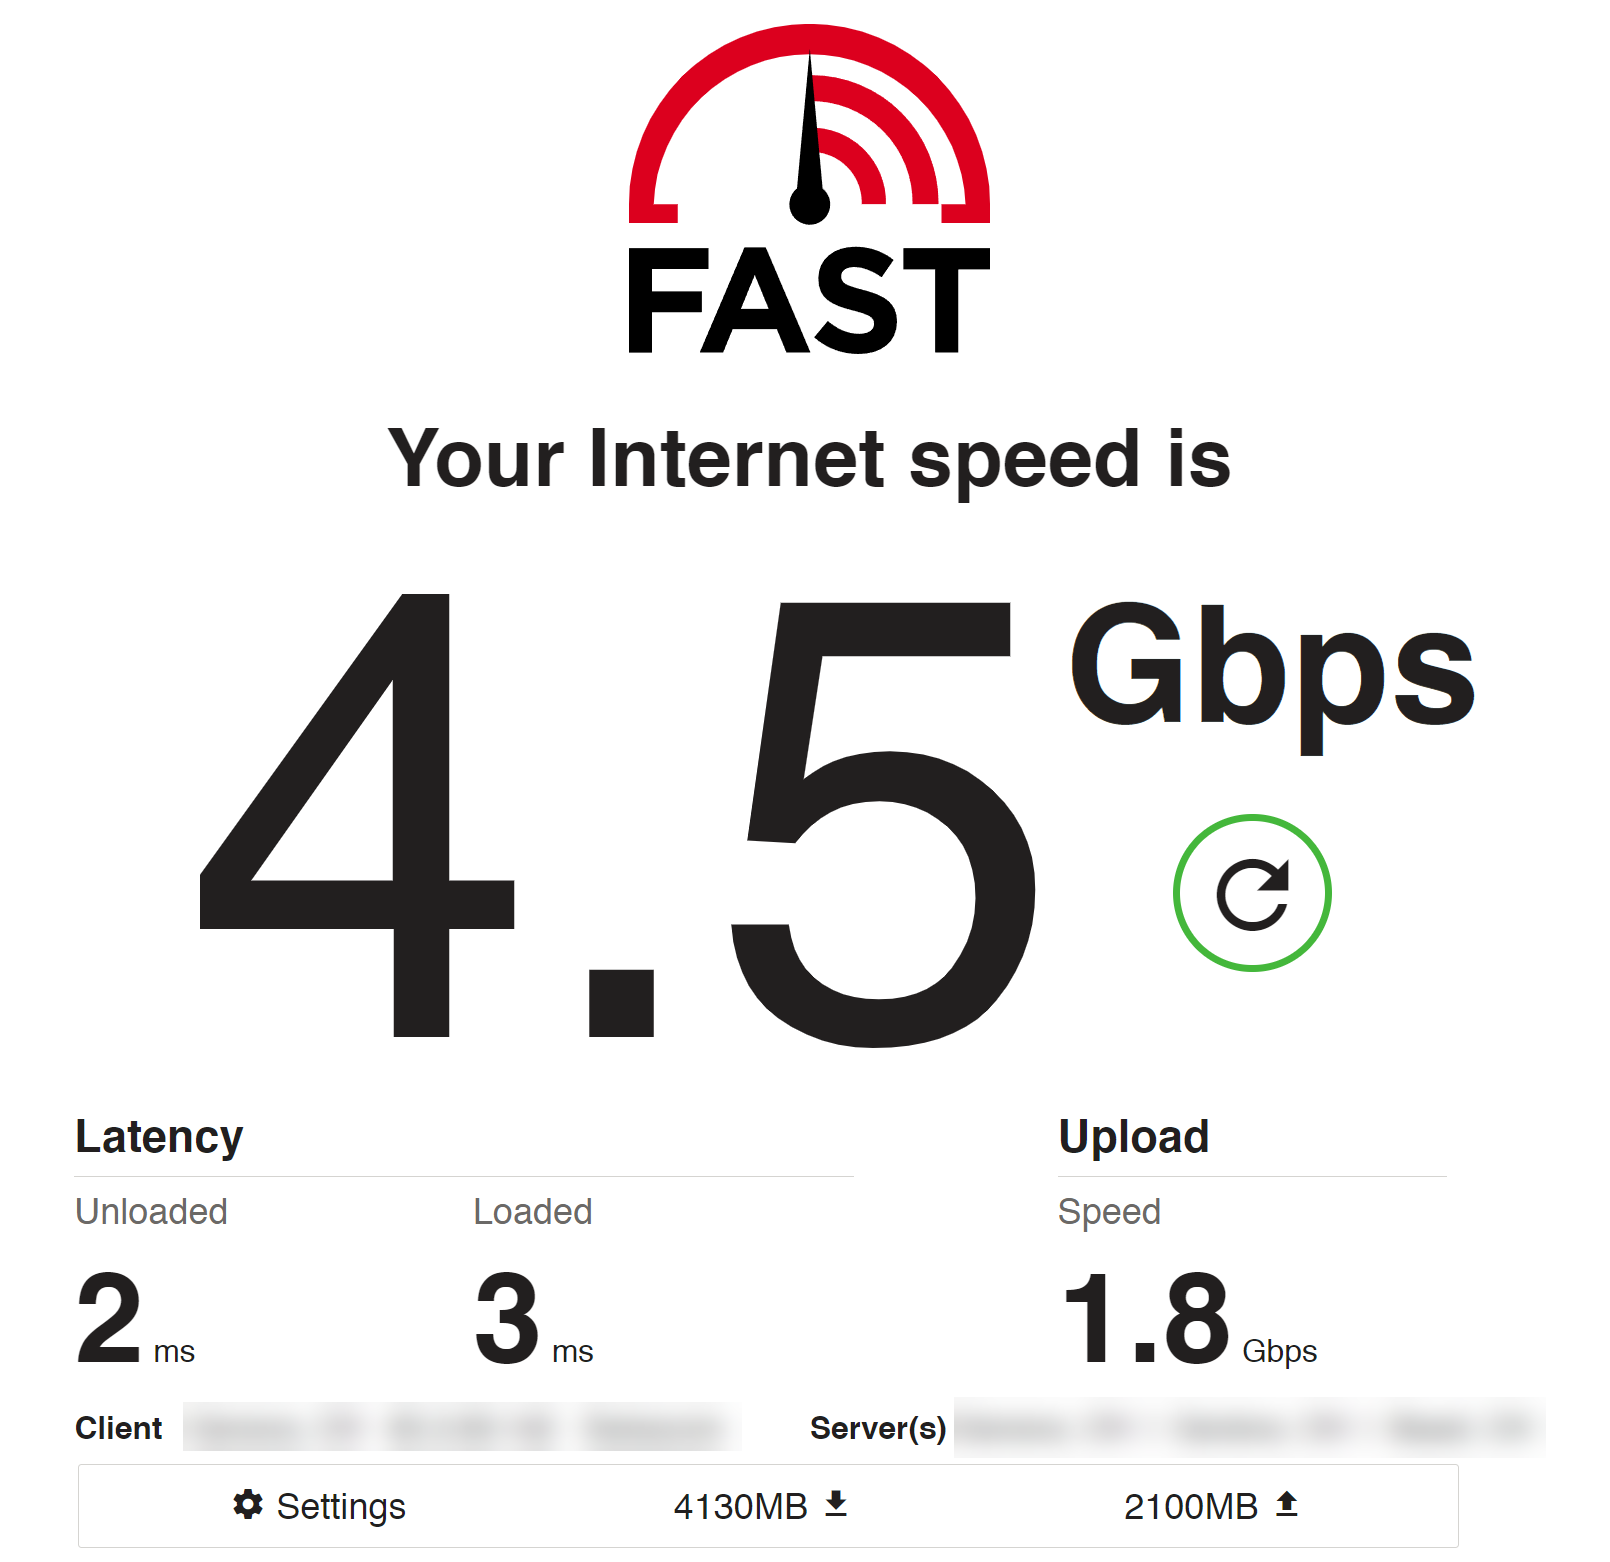
My speed from my PC (Windows 11) through my 8200
-
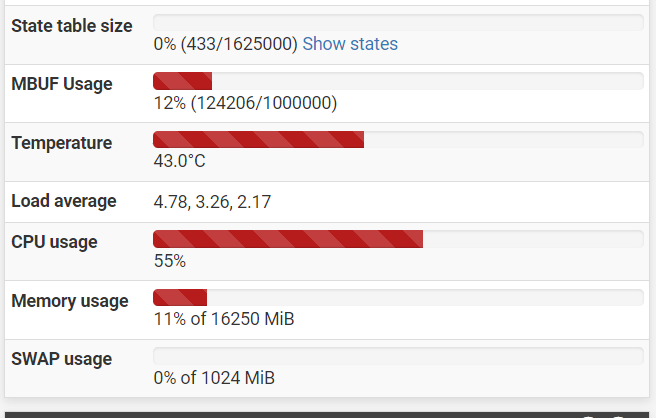
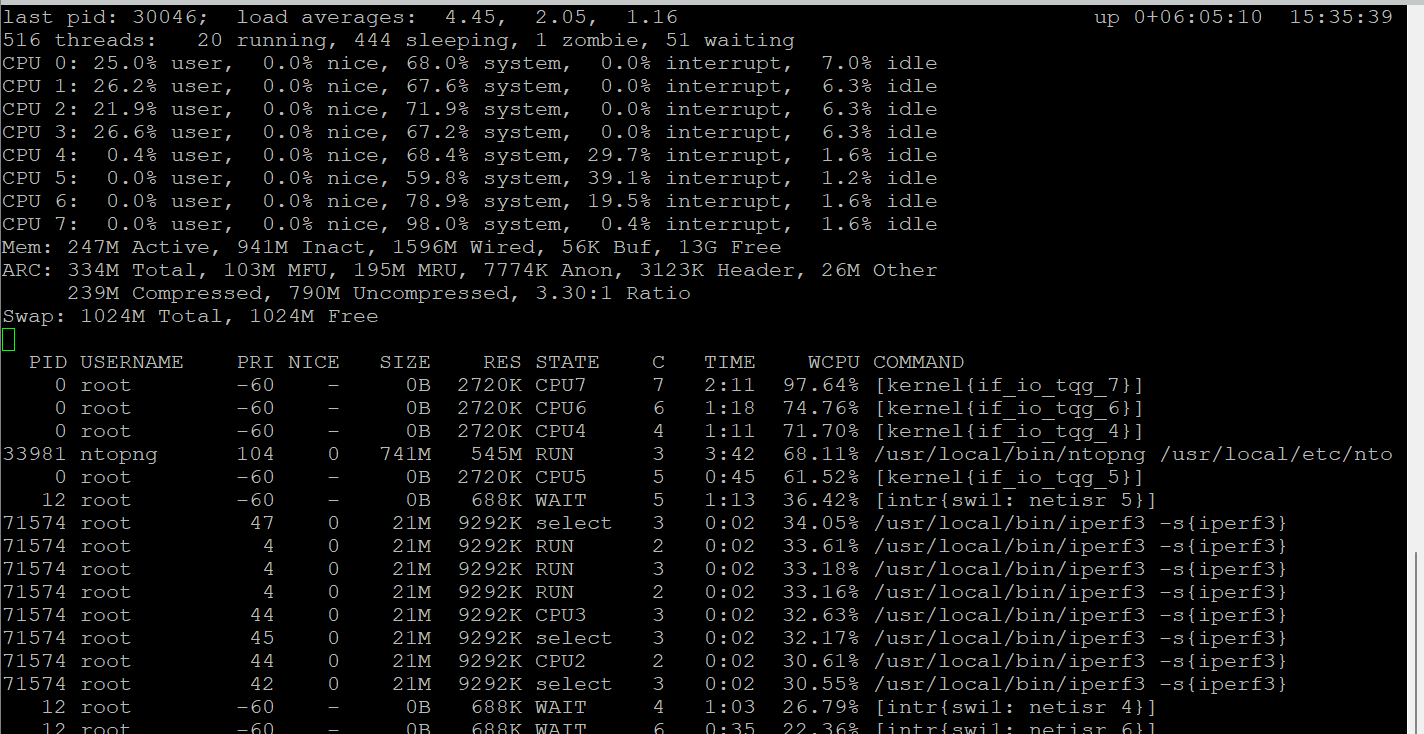
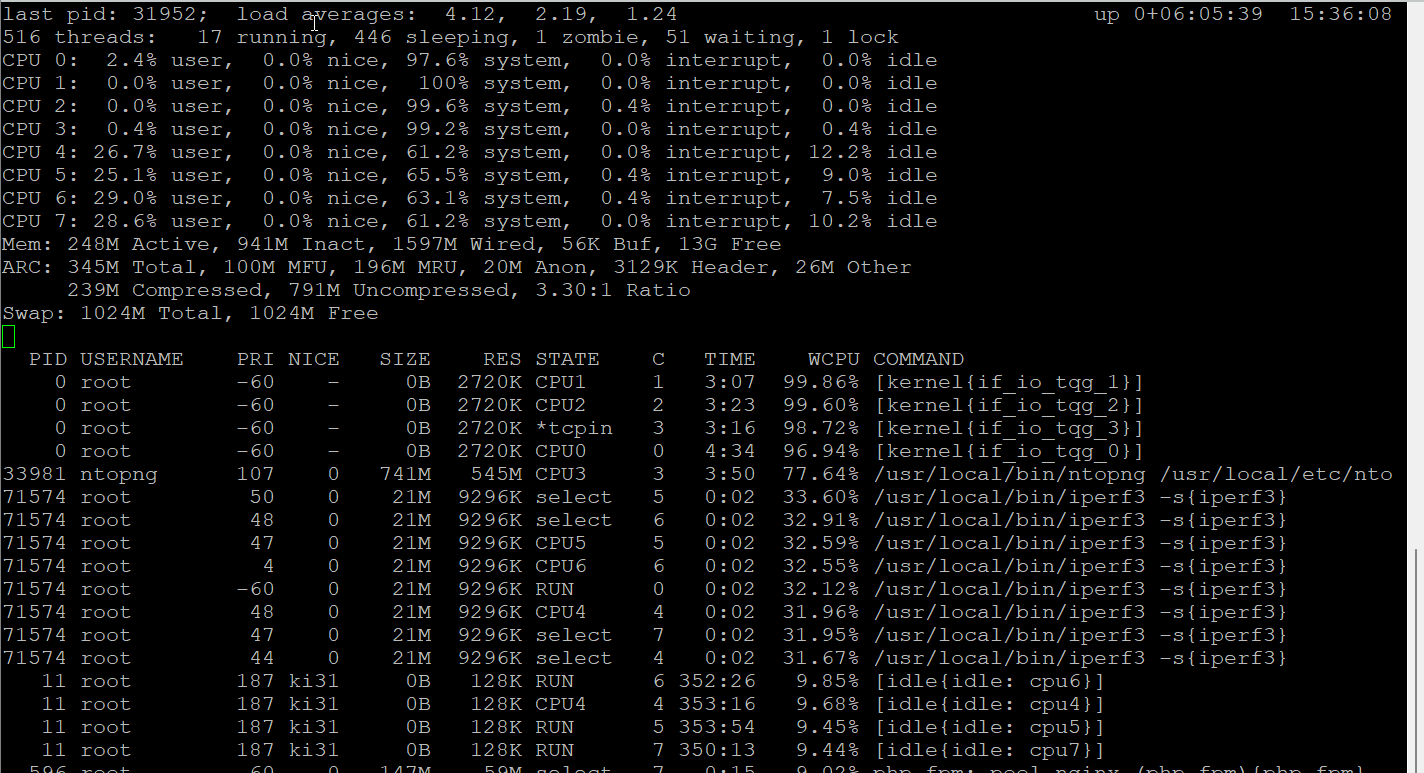
What does the CPU usage across the cores look like whilst that test is running?
-
-
The full output of
top -HaSPwill show the per core loading like:last pid: 13979; load averages: 0.15, 0.22, 0.21 up 0+08:08:55 21:13:08 307 threads: 5 running, 285 sleeping, 17 waiting CPU 0: 0.0% user, 0.0% nice, 0.8% system, 0.0% interrupt, 99.2% idle CPU 1: 0.0% user, 0.4% nice, 3.2% system, 0.0% interrupt, 96.4% idle CPU 2: 0.0% user, 0.8% nice, 1.2% system, 0.0% interrupt, 98.0% idle CPU 3: 0.0% user, 1.2% nice, 2.4% system, 0.0% interrupt, 96.5% idle Mem: 44M Active, 226M Inact, 378M Wired, 56K Buf, 3067M Free ARC: 152M Total, 36M MFU, 112M MRU, 128K Anon, 960K Header, 4201K Other 119M Compressed, 276M Uncompressed, 2.32:1 Ratio Swap: 1024M Total, 1024M Free PID USERNAME PRI NICE SIZE RES STATE C TIME WCPU COMMAND 11 root 187 ki31 0B 64K RUN 0 474:39 97.43% [idle{idle: cpu0}] 11 root 187 ki31 0B 64K CPU3 3 475:37 96.43% [idle{idle: cpu3}] 11 root 187 ki31 0B 64K CPU1 1 474:52 95.39% [idle{idle: cpu1}] 11 root 187 ki31 0B 64K CPU2 2 474:54 95.19% [idle{idle: cpu2}] 6150 root 68 20 13M 3076K piperd 2 0:04 0.24% /bin/sh /var/db/rrd/updaterrd 0 root -12 - 0B 1664K - 0 0:10 0.20% [kernel{z_wr_iss_0}] -
-
Ok so some CPU cores there are running at 100%. I would try testing with ntopng disabled since that's using 77% of one core. But it's unlikely you will get much faster than that.
-
Thank you very much for your analysis and advice!

With the configuration changes mentioned above, I no longer have pfsense blocking, it's a bit of a shame that some settings aren't more “original” configured for a (in my case) 8200.
I'm glad to have found the https://forum.netgate.com/topic/182534/just-purchased-a-netgate-8200-having-a-few-issues/13topic which helped me enormously to find a solution to my problem.
EDIT
Last test
