Enhanced Intel SpeedStep / Speed Shift - Are they fully supported?
-
@Sergei_Shablovsky said in Enhanced Intel SpeedStep / Speed Shift - Are they fully supported?:
@RobbieTT
Please, is the last screenshot the PingPlotter for Mac?If answer is “yes”, please told me how You find it ACCURATE (if RUNNING AS A SERVICE) rater than SmokePing ?
(I know that this is different class of software, and the best thing that PingPlotter opposite to SmokePing
Yes, PingPlotter on my Mac server so it runs 24/7 on my WAN and occasionally to other things under test. I don't have an opinion on the choices out there or how they compare with it as I have just run this for years.
 ️
️ -
@RobbieTT said in Enhanced Intel SpeedStep / Speed Shift - Are they fully supported?:
@Sergei_Shablovsky said in Enhanced Intel SpeedStep / Speed Shift - Are they fully supported?:
@RobbieTT
Please, is the last screenshot the PingPlotter for Mac?If answer is “yes”, please told me how You find it ACCURATE (if RUNNING AS A SERVICE) rater than SmokePing ?
(I know that this is different class of software, and the best thing that PingPlotter opposite to SmokePing
Yes, PingPlotter on my Mac server so it runs 24/7 on my WAN and occasionally to other things under test. I don't have an opinion on the choices out there or how they compare with it as I have just run this for years.
Thank You for answering!
Ping plotter are really the MUST HAVE for Mac server. ;)
So, do You make some scripting?
Do You start PingPlotter AS SERVICE?
-
 D Dobby_ referenced this topic on
-
On a N100 it seems impossible to get it to idle at min speeds, even setting to 100 (with per core), it will idle at around 1.4ghz.
However it needs to be no higher than about 70 to reliably exceed 2.5ghz clock speeds under openssl benchmark.
I might need to lower it further though as I have been seeing small CPU spikes enough to cause noticeable jitter on traffic, which I suspect isn't generating enough clocks.
It is PPPoE so no doubt that is making things harder.
-
How are you checking? The gui code will always make it ramp up. In my testing even running sysctl increased across each core as it read it.
-
@stephenw10
Surely that will be CPU & load specific, with weaker CPUs needing to work harder with minor tasks? ️
️ -
Yup. However SpeedShift appears so fast (sensitive) that even on something relatively powerful it will react where SpeedStep would not.
-
@stephenw10 with the sysctl freq variables.
Ironically I have dropped it to 60 now from 70, as 70 wasnt ramping up to highest clock speed during high throughput whilst 60 does.
These are the lowest clocks I have managed to see, I managed to get 1 core below 1ghz :) This is by luck, usually its above 1.4ghz.
Also I was logged out of UI.
# sysctl dev.cpu.0.freq dev.cpu.1.freq dev.cpu.2.freq dev.cpu.3.freq dev.cpu.0.freq: 926 dev.cpu.1.freq: 1125 dev.cpu.2.freq: 1337 dev.cpu.3.freq: 1410 -
@chrcoluk The CPU capabilities are probably more dominant than the fine controls provided by pfSense.
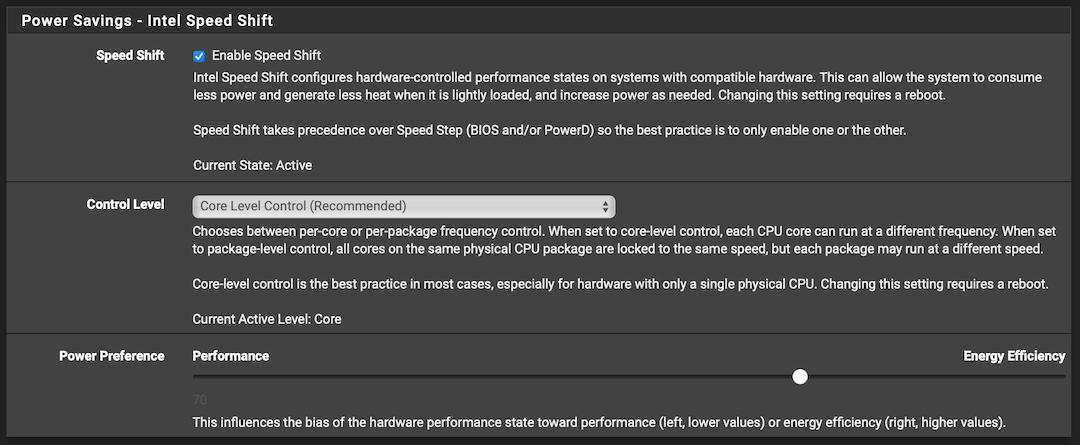
I also happen to have my SpeedShift set at 70 and with my router doing regular work (no VPNs or invasive tasks) the 8 physical cores sit at the figures below (NB I have disabled hyper-threading as it arguably gets more in the way than actually helping):

[24.03-RELEASE][admin@Router-7]/root: sysctl dev.cpu.0.freq dev.cpu.1.freq dev.cpu.2.freq dev.cpu.3.freq sysctl dev.cpu.4.freq sysctl dev.cpu.5.freq sysctl dev.cpu.6.freq sysctl dev.cpu.7.freq
dev.cpu.0.freq: 799
dev.cpu.1.freq: 799
dev.cpu.2.freq: 799
dev.cpu.3.freq: 799
dev.cpu.4.freq: 799
dev.cpu.5.freq: 799
dev.cpu.6.freq: 799
dev.cpu.7.freq: 799
[24.03-RELEASE][admin@Router-7]/root:
I suspect if I switched over to my Netgate 6100 I would see frequencies routinely above the minimum values.
 ️
️ -
@RobbieTT Sensitivity is CPU dependent it seems.
Also the N100 has no HT.
-
Some more observation.
This I think backs up stephenw10's observation that the sysctl commmand itself is ramping up clock speeds.
If I run the sysctl command to check clock speed, there is no major difference between 100 and 60, I got the sub 1ghz output when it was set to 60.
At values below 50 it will be visibly different.
However if I look at CPU temperatures, when it is set to 70 as the baseline, dropping it to 60 (which I did to allow higher clock speeds under heavy throughput) the average CPU temp increases by around 2C, a small difference indicating average clocks with the system mostly idle are affected, and when I increased it all the way to 100, even though the sysctl command gives similar output there was a whopping 14C drop on plotted temperatures.
Interestingly setting it to a very low number like 0 or 10, the temps are lower compared to setting it to 60. I am guessing the CPU going back to an idle state quicker has a positive effect. Really low they similar to using a value of 100. -
@RobbieTT said in Enhanced Intel SpeedStep / Speed Shift - Are they fully supported?:
@tman222
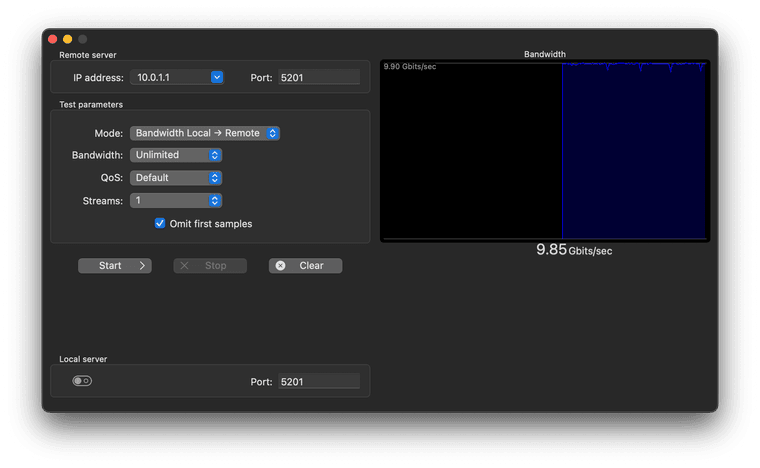
If I generate 10GbE using the router as the server or client I can detect a small ripple in the graph with 1 stream but the 9.90 Gbps average remains:
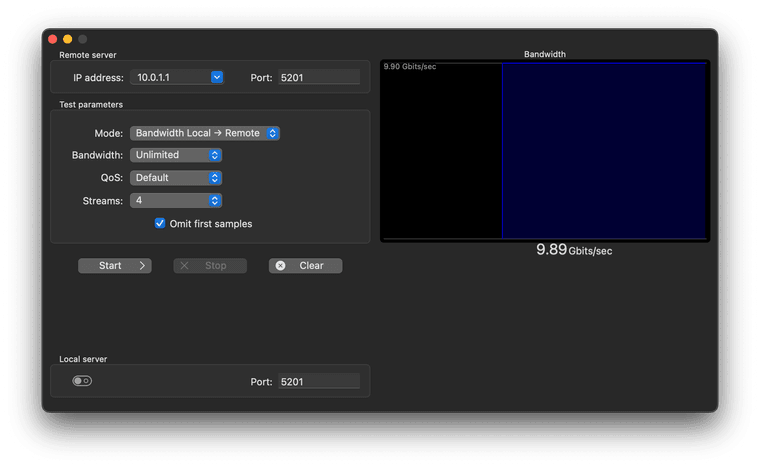
4 streams is still a flat line though:

Which Mac app You using here to generate traffic of this kind?
-
@Sergei_Shablovsky
It's just iPerf generating or receiving traffic. In this specific example I am just using it with the GUI that is iPerfUtil but it remains iPerf under the easy controls so it works with any other iPerf network client. -
@RobbieTT said in Enhanced Intel SpeedStep / Speed Shift - Are they fully supported?:
@Sergei_Shablovsky
It's just iPerf generating or receiving traffic. In this specific example I am just using it with the GUI that is iPerfUtil but it remains iPerf under the easy controls so it works with any other iPerf network client.Thank You for answering!
Do You testing iPerfUtil with iperf3?
Could You be so please to give me a link on iPerfUtil ?
Thank You!
