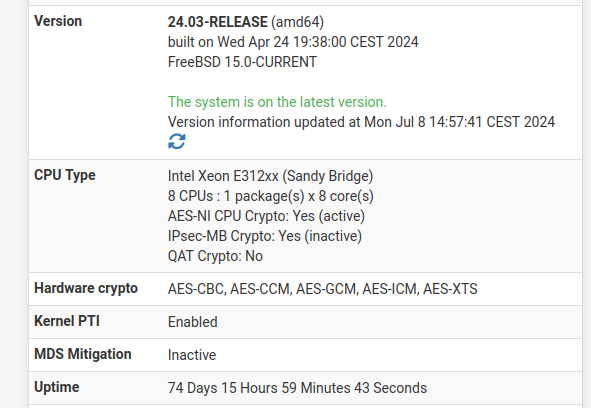
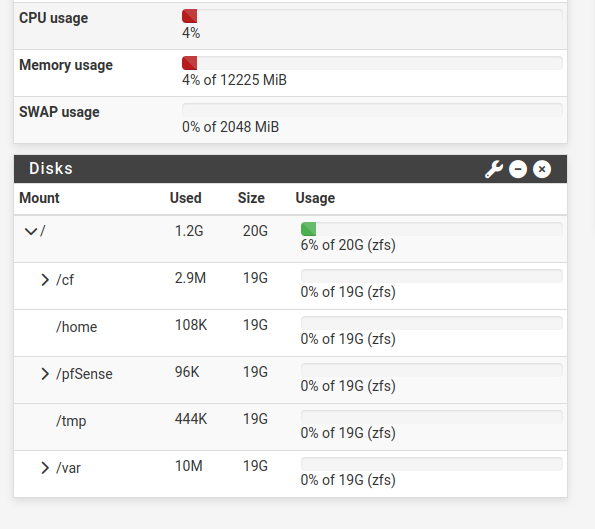
24.03 crashing (again)
-
Backtrace:
db:1:pfs> bt
Tracing pid 2 tid 100039 td 0xfffff800019d4740
kdb_enter() at kdb_enter+0x33/frame 0xfffffe00281be8f0
panic() at panic+0x43/frame 0xfffffe00281be950
trap_fatal() at trap_fatal+0x40f/frame 0xfffffe00281be9b0
trap_pfault() at trap_pfault+0x4f/frame 0xfffffe00281bea10
calltrap() at calltrap+0x8/frame 0xfffffe00281bea10
--- trap 0xc, rip = 0xffffffff80f246e2, rsp = 0xfffffe00281beae0, rbp = 0xfffffe00281beb70 ---
tcp_m_copym() at tcp_m_copym+0x62/frame 0xfffffe00281beb70
tcp_default_output() at tcp_default_output+0x1294/frame 0xfffffe00281bed60
tcp_timer_rexmt() at tcp_timer_rexmt+0x53c/frame 0xfffffe00281bedc0
tcp_timer_enter() at tcp_timer_enter+0x101/frame 0xfffffe00281bee00
softclock_call_cc() at softclock_call_cc+0x12e/frame 0xfffffe00281beec0
softclock_thread() at softclock_thread+0xe9/frame 0xfffffe00281beef0
fork_exit() at fork_exit+0x7f/frame 0xfffffe00281bef30
fork_trampoline() at fork_trampoline+0xe/frame 0xfffffe00281bef30
--- trap 0, rip = 0, rsp = 0, rbp = 0 ---
Panic:
Fatal trap 12: page fault while in kernel mode
cpuid = 2; apic id = 02
fault virtual address	= 0x1c
fault code		= supervisor read data, page not present
instruction pointer	= 0x20:0xffffffff80f246e2
stack pointer	        = 0x28:0xfffffe00281beae0
frame pointer	        = 0x28:0xfffffe00281beb70
code segment		= base 0x0, limit 0xfffff, type 0x1b
			= DPL 0, pres 1, long 1, def32 0, gran 1
processor eflags	= interrupt enabled, resume, IOPL = 0
current process		= 2 (clock (2))
rdi: 0000000000000000 rsi: 0000000000000000 rdx: fffffe00281becf8
rcx: 0000000000000000  r8: 00000000000005a0  r9: 0000000000000000
rax: 0000000000000000 rbx: 0000000000000000 rbp: fffffe00281beb70
r10: 0000000000002014 r11: 000000000000e08c r12: 0000000000000000
r13: 00000000000005a0 r14: fffff801358b8000 r15: 0000000000000034
trap number		= 12
panic: page fault
That looks more like a bug in the TCP stack. This is interesting though:
<5>arp: packet with unknown hardware format 0x06 received on ix0.20Did your other panic also show that?
Edit: Doesn't look like it did....
-
@stephenw10 said in 24.03 crashing (again):
tcp_m_copym
Ah Ok this looks exactly like this: https://redmine.pfsense.org/issues/15457
There is a new HAProxy package available in 24.03 that has that fixed. It now uses HAProxy 2.9.7.
-
I'm on the latest HAProxy package (IIRC there was an update a few days ago).
One thing I found interesting is that after the crash and reboot two site-to-site OpenVPN connections refused to come up even after restarting the service. They only came up after a reboot.
-
Check the HAProxy stats page. Make sure you're really running 2.9.7. That panic looks exactly like the one triggered by HAProxy 2.9.1.
-
@stephenw10 0 Correct, it did not.
-
@stephenw10 -
Yep, stats page shows: HAProxy version 2.9.7-5742051, released 2024/04/05 -
Hmm, so that latest crash was with HAProxy 2.9.7 installed?
-
Yep, it occurred last night.
-
-
Hmm, same crash again. So it appears that panic is unrelated to that known issue with HAProxy using 100% CPU which should now be fixed.
-
@stephenw10
Yes I can confirm. HAProxy 2.9.7 never use 100% CPU -
But.
I have another PfSense plus with HAproxy 2.9.7, very little traffic, almost nothing. Well, that PfSense has never presented any problems.
The problem is related not only to the presence of HAProxy 2.9.7 but also to the traffic or use of it.
-
or....
is there a correlation between HAProxy 2.9.7 with the VM's virtual CPU ? In my case both VM running in Proxmox 8.2.2 (same version of QEMU, identical).
On the version that has NEVER given problems (and is very low traffic):
And on the version that has crashes:

-
Hmm, possibly some new instruction that HAProxy is using (or trying to use)?
If it was that expect to see it in some crypto operation but the backtrace doesn't look like that, it's in the network stack.
Is there any difference in the network config of those VMs?
-
mmmmm no.
I just checked and the configuration of the two network interfaces going to Pfsense is completely identical.
N.2 virtio type NICs with same configuration running on the same version of QEMU. -
Hmm, OK the next step here is probably to enable a full kernel core dump and wait for it to happen again.
Do you have SWAP enabled on that VM? How much?
-
OK, if I can help, by installing a new kernel configured for debugging in case of core dump on the production HAProxy server, I'm available.

-
Ok the first step is to enable a full core dump. Edit the file /etc/pfSense-ddb.conf and add a new kdb.enter.default script line like:
# $FreeBSD$
#
#  This file is read when going to multi-user and its contents piped thru
#  ``ddb'' to define debugging scripts.
#
# see ``man 4 ddb'' and ``man 8 ddb'' for details.
#

script lockinfo=show locks; show alllocks; show lockedvnods
script pfs=bt ; show registers ; show pcpu ; run lockinfo ; acttrace ; ps ; alltrace

# kdb.enter.panic       panic(9) was called.
# script kdb.enter.default=textdump set; capture on; run pfs ; capture off; textdump dump; reset
script kdb.enter.default=bt ; show registers ; dump ; reset

# kdb.enter.witness	witness(4) detected a locking error.
script kdb.enter.witness=run lockinfo
So there I commented out the old line and added:
script kdb.enter.default=bt ; show registers ; dump ; resetNow reboot as that is only read in at boot.
Then check it's present at the CLI with:
[24.08-DEVELOPMENT][root@7100.stevew.lan]/root: sysctl debug.ddb.scripting.scripts
debug.ddb.scripting.scripts: lockinfo=show locks; show alllocks; show lockedvnods
pfs=bt ; show registers ; show pcpu ; run lockinfo ; acttrace ; ps ; alltrace
kdb.enter.default=bt ; show registers ; dump ; reset
kdb.enter.witness=run lockinfo
It will now dump the full vmcore after a panic.
You can check it by manually triggering a panic with:sysctl sysctl debug.kdb.panic=1At the console you will see something like:
db:0:kdb.enter.default>  dump
Dumping 586 out of 8118 MB:..3%..11%..22%..33%..41%..52%..63%..71%..82%..93%
Dump complete
db:0:kdb.enter.default>  reset
Uptime: 17m8s
The available SWAP space must be larger than the used RAM though. That 7100 is only using 586MB because it's a test box.
-
For reference:
https://redmine.pfsense.org/issues/15618 -
C cboenning referenced this topic on