Tracing cause of cpu spike - SG1100
-
@michmoor Very good question Indeed.
My first attempt would be to stop One service at a time to see if One of them indirectly is causing the issue.I assume you have tried rebooting and the problem remains?
-
@keyser Yep i rebooted and the problem is there. Im going to disable pfBlocker but i cant see that being the issue.
-
@michmoor just stop the services One at the time. No need to disable them
-
@keyser @Gertjan
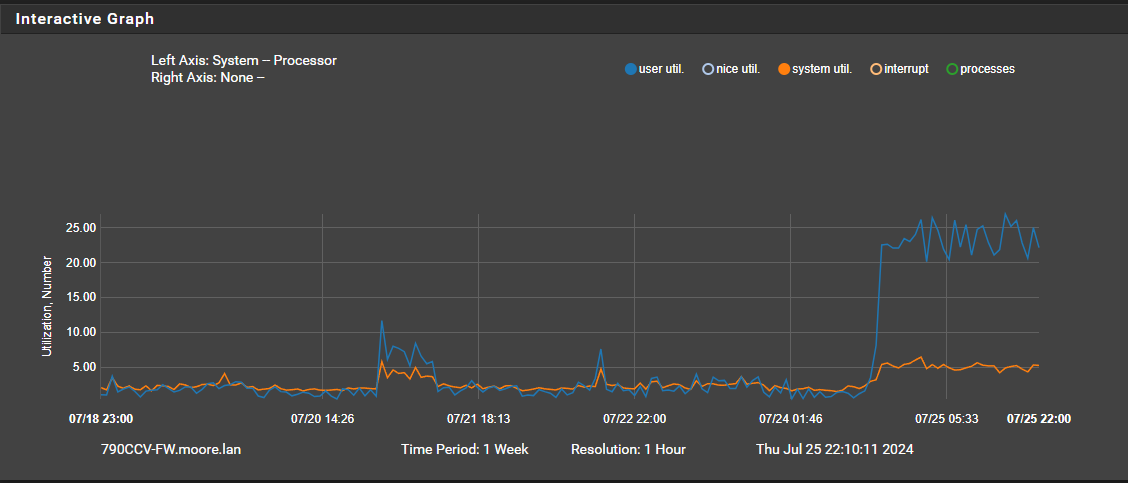
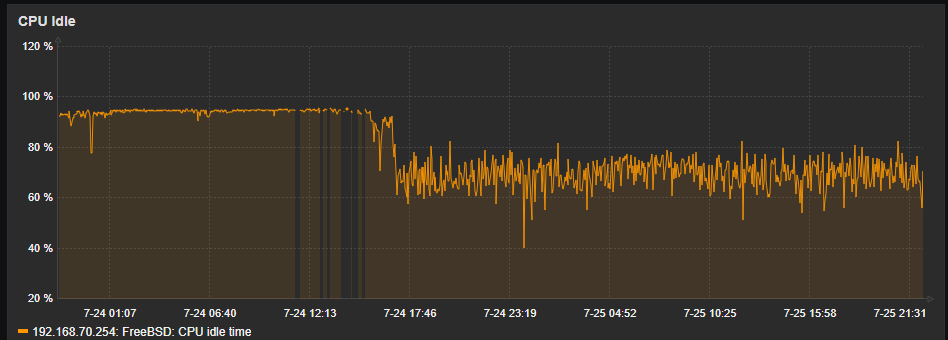
It was a process....it was pfBlocker. pfBlocker and Zabbix and FRR are the only packages of consequence on this 1100. Once i stopped pfblocker CPU idle shot back up to 95%.
From the monitoring graph alone you can see system util and user util dropped
So that being the case...I never deployed anything as small as an 1100 but i want to re-enable pfBlocker again.
Any concerns? This ARM CPU is working its butt off.
-
@michmoor Good to know the culprit

There is definitively something wrong with your pfblocker config - perhaps a corrupted file or list download?
Pfblocker should never spend even remotely that kind of CPU - even om a 1100.I have 2100 - same Arm cpu - and pfblocker has a fairly advanced config on My box. CPU usage is only about 5-8% for the whole system unless i really start pushing traffic through. And pfblocker never uses any CPU to speak off unless its updating.
Look into the error logfile in pfblocker (can be done in the UI)
Perhaps try and disable your list feeds One at a time if the pfblocker error log file does not reveal the error. -
@keyser
The error logs are empty. I think this may just be a sizing issue in the end. SG1100 just isn't a powerful box and having to check a block list before creating state might be the issue.
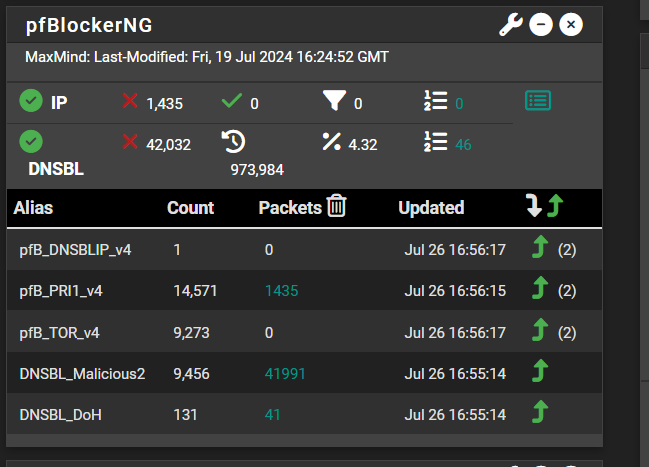
I don't think the list count is bad...
-
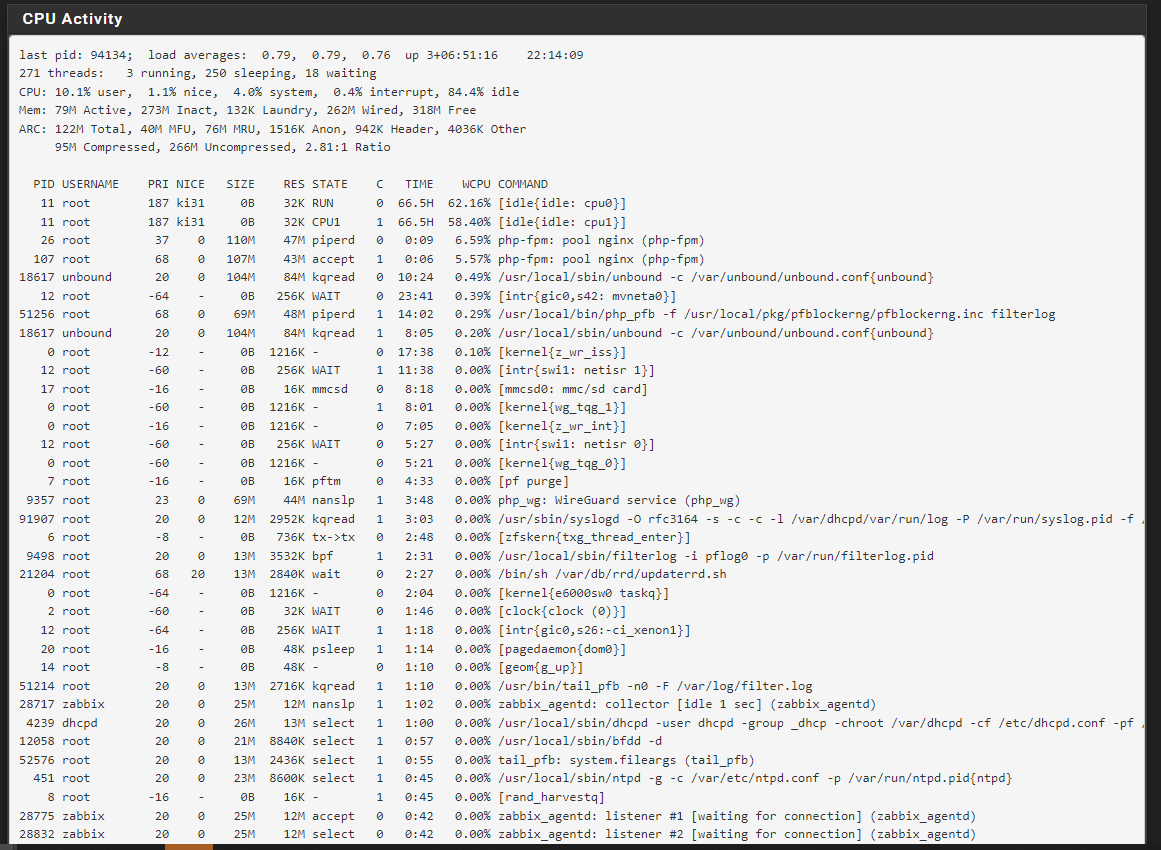
@michmoor That is 100% NOT the issue since pfBlocker processes are not involved in all the firewall/state stuff - that’s pfSense doing that.
PfBlocker processes are responsible for fetching and parsing lists, creating firewall ALIAS’es out of the lists, and if configured to create/sort the firewall rules to include rules using the ALIAS’es. The other pfBlocker process is responsible for scraping the pfSense firewall log file for entries that are created from rules that contain pfBlocker ALIAS’es - to gather information to create all the statistics reports in the pfBlocker module.To compare I have these lists on a SG-2100 (Same CPU) that sees about 5-8% CPU utilisation all day exept when updating lists (once every night):
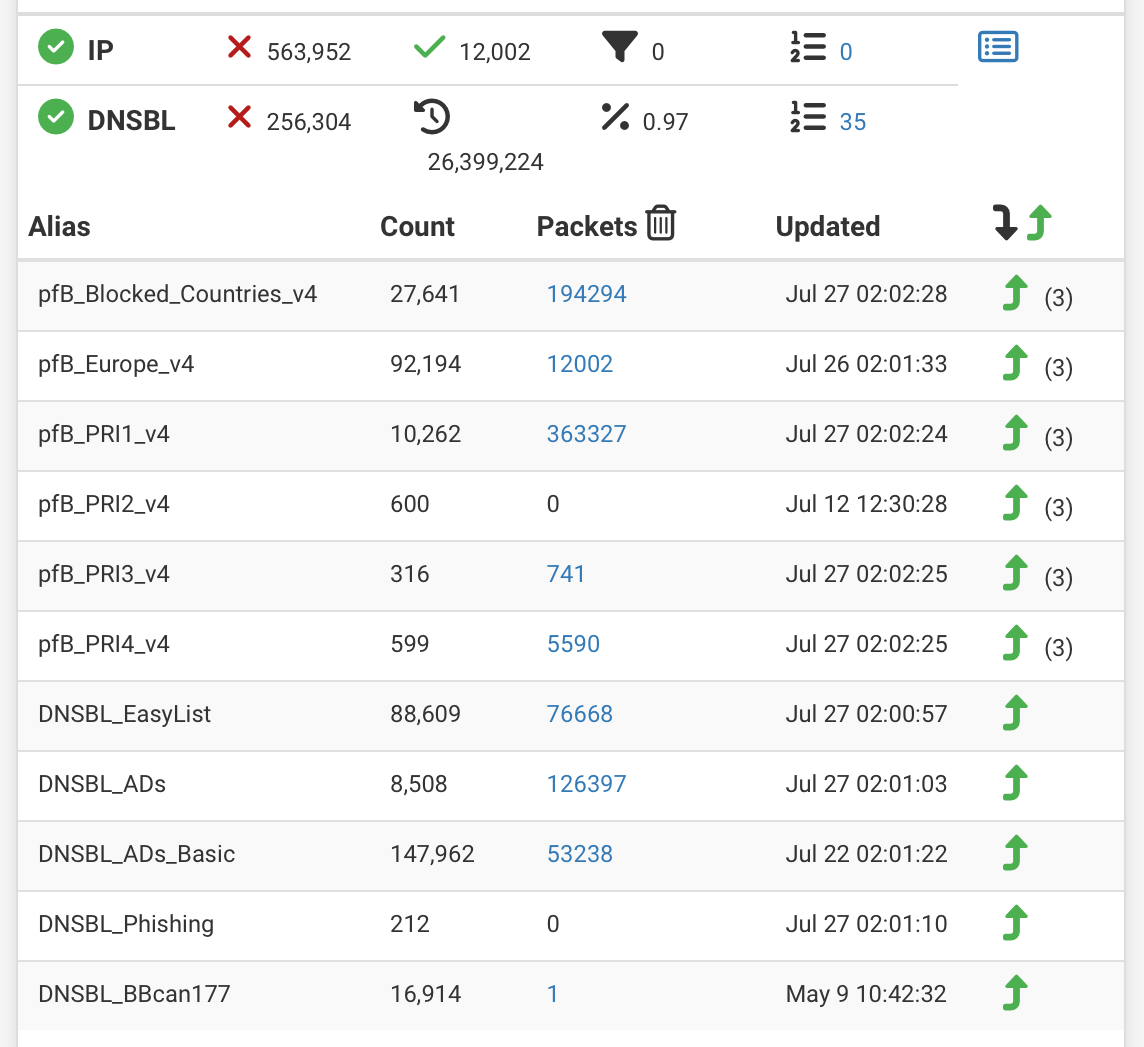
One guess could be that you have a LOT of firewall logging on your box (hundreds of entries a second). That logging needs not be related to pfBlocker rules specifically as it still has to scrape every log entry. That will cause pfBlocker log scraping to consuming all that CPU. If that is the case make sure to reconfigure your firewall to log A LOT less. Your eMMC (storage) will only last maybe 4 - 8 months before being dead/entering readonly mode if you are really hitting it with logs.
-
@keyser hmmm ok. then something is indeed wrong but I have no clue what it is then.
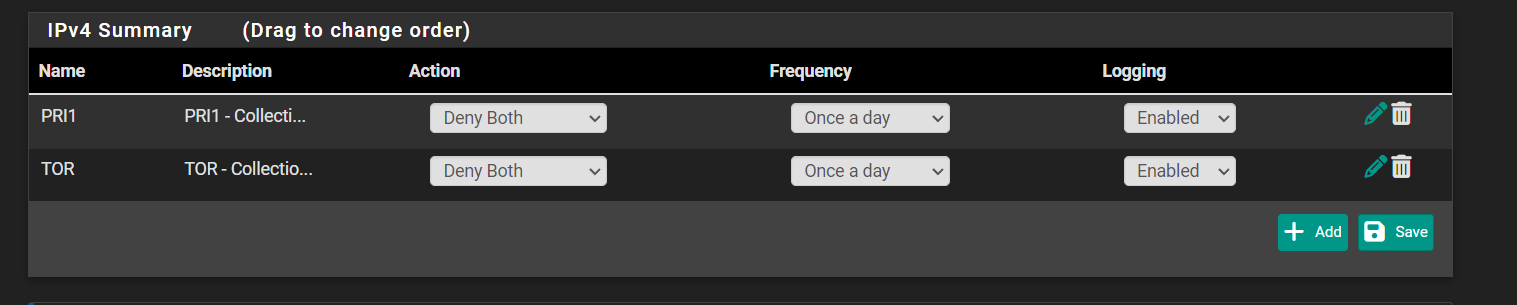
Traffic logging has been disabled for all firewall rules.
Im not sure what else to turn off or disable for nowLogging is enabled here but I don't think this would have much impact on CPU
py_error.log file is empty
error.log file only has stats from 7/4 regarding a download fail..
Anything else you think I can/should check? -
@michmoor Not really, but It could be related to the Unbound DNS <-> DNSBL integration. I would probabaly remove the checkbox in keep settings, and then remove the package completely (with all settings).
After a reboot and confirming everything is peachy, I would install the package again - check everything - do basic config (no DNSBL or lists) - check everything - enable IP blocking - check everything - configure feeds - check everything - enable DNSBL and so on and so on.To determine when in the configuration process the CPU usage arises.
-
@keyser Took the advice and re-installed pfblocker without keeping settings. So far so good. I have no idea what was wrong with the configuration prior. I'll keep monitoring but so far it looks good. Strange one indeed.