Netgate 2100 Stalling - HW issue?
-
Hi all,
I have a Netgate 2100 that I've really been struggling to troubleshoot for several months now. The behavior I'm troubleshooting is random network stalls. When it happens, devices on VPN or ZTNA connections keep traffic moving as usual across the device. However, everything not sending traffic across the 2100 in a tunnel has all network activity just stall.
What do I mean by stall? Well for a while I thought it was DNS. First, I checked the pfBlocker-ng logs, but didn't see anything being blocked during the time any of the devices were stalled. Desperate, I turned it off anyway. That didn't help, so I tried switching from DNS Resolver full resolution to DNS Resolver forwarding mode, then tried switching that off and going with DNS Forwarder, then I tried just turning off both and letting devices just use external DNS servers. I thought for a while that my ISP (Spectrum) was causing problems with IPv6 so I turned that off - no improvement.
I've realized over the course of doing all of these things a few things:
- It's intermittent and not predictable. But the outage is predictably-length, at least 100 seconds, never more than 4 minutes.
- It happens more frequently the longer the Netgate 2100 has been running since last reboot.
- Sometimes rebooting a package that causes a filter reload on the firewall seems to help (but again with the intermittent nature of all of this, very hard to really measure and prove this).
- When the outage happens, ongoing streams are not affected (i.e. a Zoom call in progress) but anything making a new connection (web browsing, open phone app, etc.) is affected. AND, async streams ARE affected (i.e. while writing this post, one of the outages happened, and this site briefly reported that my internet connection went down in the bottom right corner).
I'm starting to be afraid I've got hardware issues. This is my 2nd 2100 (first one had a hardware issue RMA'd in my first year of warranty, this one is now about 2 years old.
Anybody got any ideas? I'm a big supporter of paying for open-source dev and that's why I bought the 2100 instead of rolling my own, but getting to the point of suspecting a 2nd hardware failure in ~3 years is disconcerting.
Sam
-
3 suggestions :
Check the file system - see video on Youtube, channel 'Netgate' - look for the filesystem video.
Install pfSense Plus clean - no packages, no whistles, no thrills. No VPN nothing. Just the 'out of the box' experience.
Important : no messing around with DNS : use all default DNS settings - don't add commercial or external DNS servers - leave everything to default.You are allowed to chose your own password ^^You are using a '2100' and you've mentioned pfBlockerng. That package can create a lot of logging (== write cycles) and that's not the strongest point of a 2100 (that is : the drive).
Run a drive check : smartctl ?! -
Your description sounds like it's unable to open new states during that time. Check the system logs when that happens. If pf gets stuck, for example, I'd expect to see something logged.
-
I checked the SMART status, and determined from that there were no errors being reported.
On that basis, I downloaded a clean package and wiped and reinstalled. Benefit was the device finally got the ZFS file system, so seemed like a worthwhile thing to try.
For the first ~9-10 hours, things were euphorically great. Then, disaster. The stalls are back!
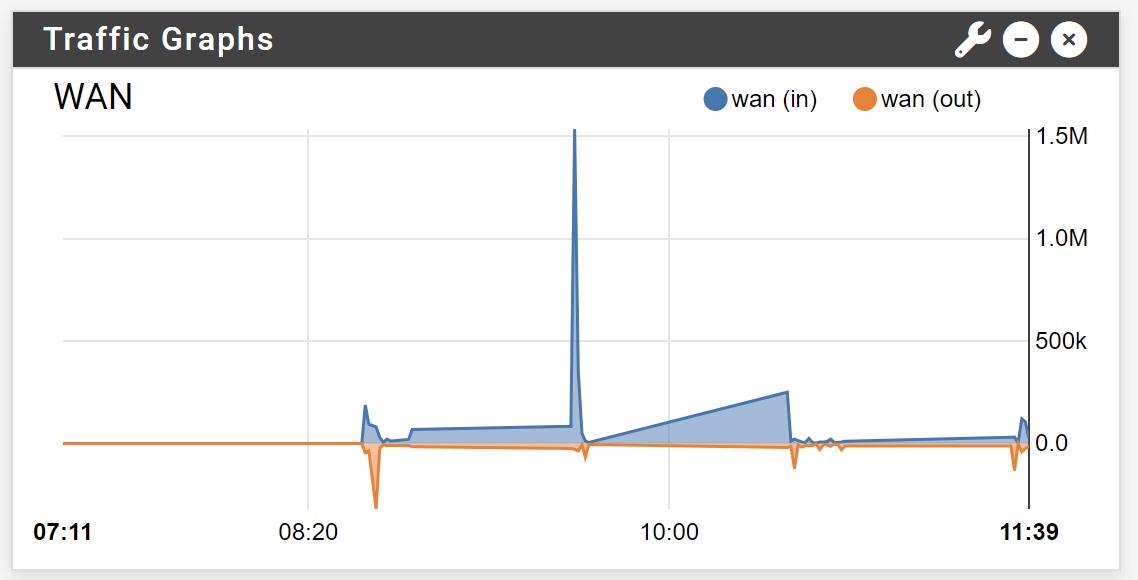
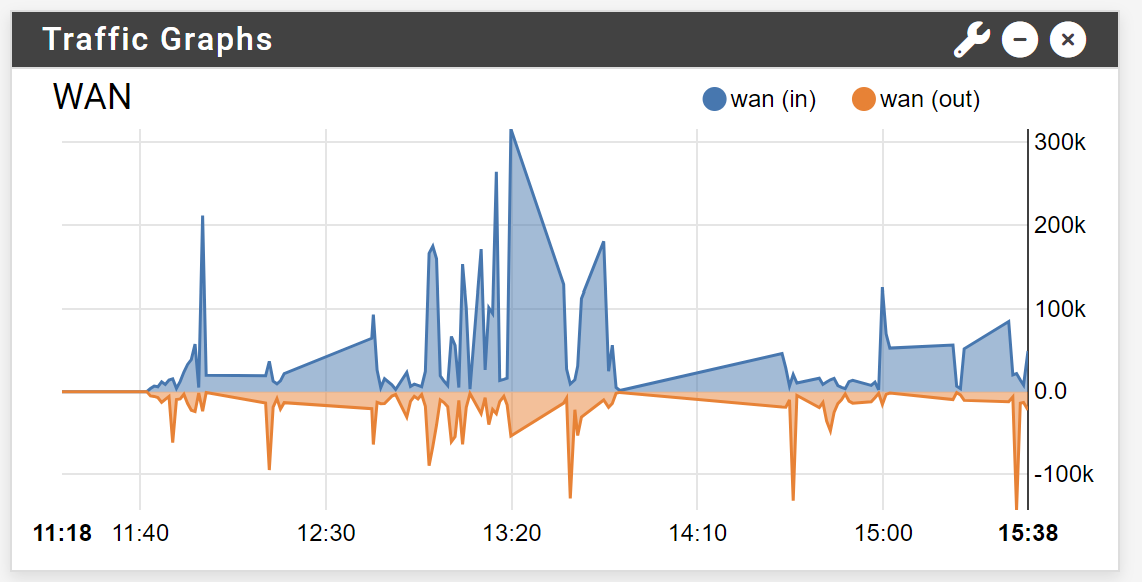
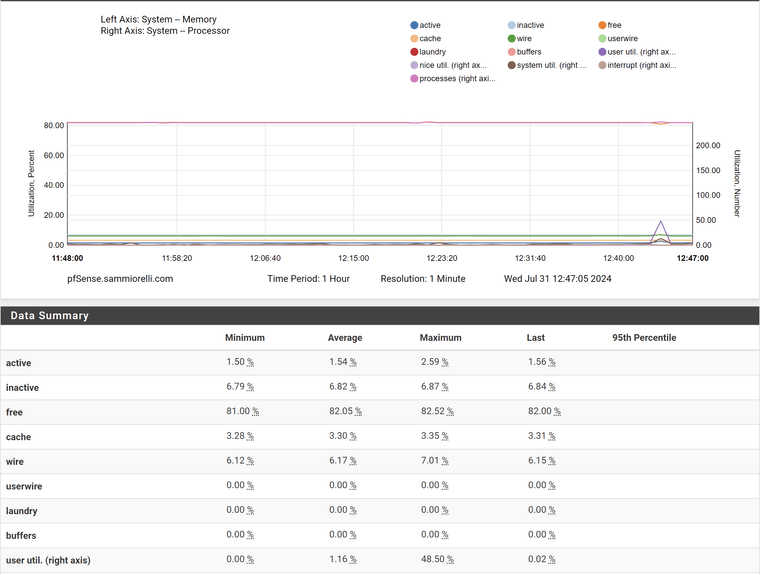
I checked the logs, and there's absolutely nothing logged at all. But, I do have a hint in that the traffic graphs on the main status page stall at the same time as the internet traffic through the firewall does. The internet goes out about 1s before the traffic graph stalls, and comes back about 2s before the traffic graph recovers. The pictures attached show the straight lines where the graph stalls.
The other thing it shows, however, is the entirely random nature of the duration of the stalls. I sadly have to admit, this is EXACTLY the same behavior that led to the hardware RMA of the prior device. :(
Anybody got a good thought? Does Netgate collect dead hardware? I sadly don't think I'll be buying another after this track record.
-
WAN speed just by itself doesn'tb say much, it'sv the final result.
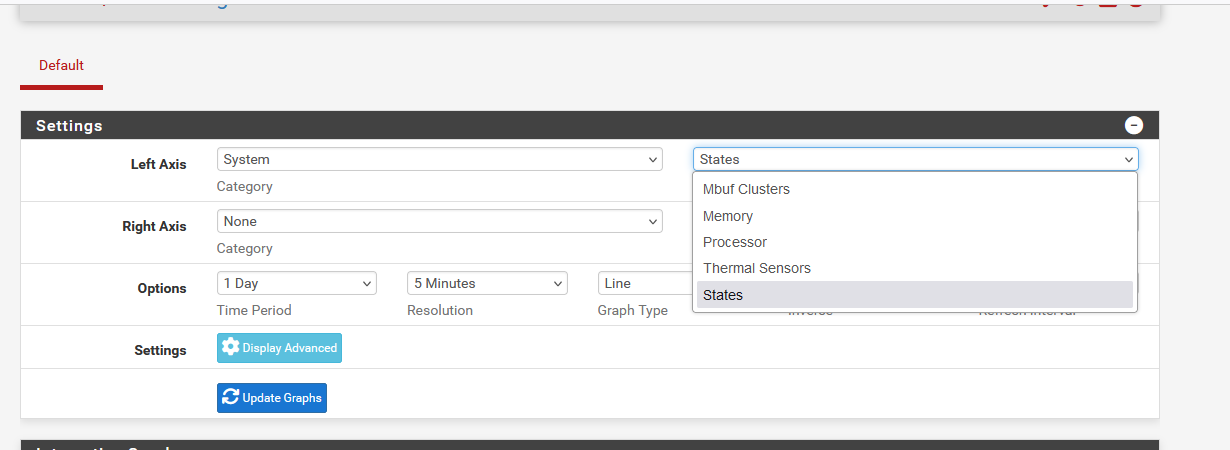
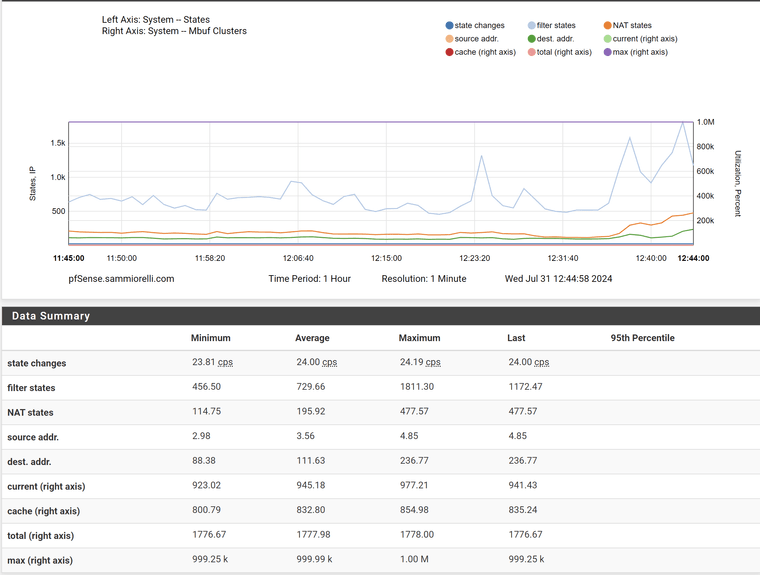
Can you show all these also mBuf, Memory, Processor, States (thermal : no not really, we know, its hot):
-
Yup, the other monitoring graphs may show something there; a spike in CPU usage or states perhaps. Or a gap in data would also be telling.
This doesn't look like a hardware issue to me. Or at least if it is it's unlike any hardware issue I've seen before!
Are you running from eMMC or SSD?
-
See attached. To be honest I'm not seeing any hints here. I took some time to really try to quantify exactly how long the stalls are. I think my 4 minute upward bound estimate previously was just bad luck. Watching carefully over about a half hour, the longest stall was 97s, shortest was 4s, average was about 31s.
Since the minimum resolution of these graphs is 1m, I think it ends up smoothing over these stall durations.
It's running on the eMMC that came with the device.
-
Other metric in the monitoring graphs may show something.
The fact the traffic graphs appear to stop updating rather than go to zero implies something significant is happening. Either the RRD-update process stops or it's unable to get the data. Since it looks like other graphs continue it seems more like it can't get data. I'm surprised there is nothing in the system log at that time. It really feels like pf stops responding.
-
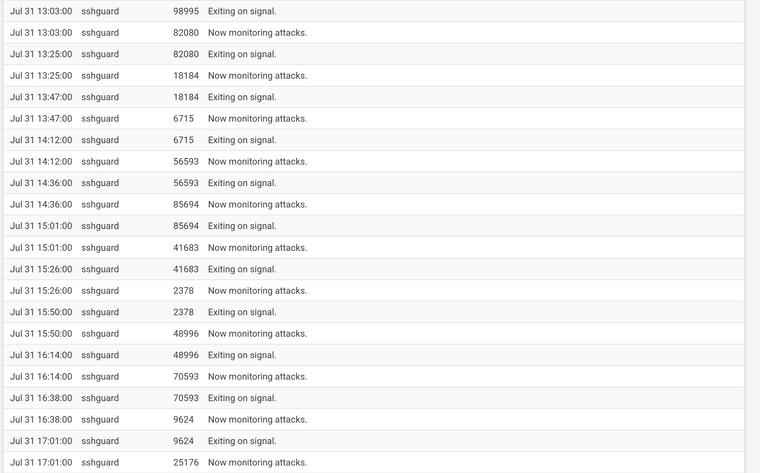
So just to be clear, here's the entirety of the logs in System Logs / System / General for this afternoon while this behavior was ongoing. Logs are the same earlier in the morning when I was doing the screenshots of the performance metrics. Just a bunch of the sshguard spam which seems like a known benign issue (https://forum.netgate.com/topic/169923/tons-sshguard-log-entries-and-its-not-enabled/14).
But also, the frequency of the sshguard log entries is much less than the drop-outs, which happen every 1-2 minutes while the sshguard entries are approximately every 24 minutes.
I agree with the instinct that this is pf hanging because active connections are never affected during the outage, but zero new connections can be established during the outage time regardless of device. I've also confirmed that during the outage, the WebUI of pfSense itself is also stuck. No clicks to other screens etc work until the outage clears. But I'm at a loss for how to investigate further since the logs are so silent on this topic.
-
Yes that sshguard restart is usually just log spam and not important. However we have seen issues where the log compression can put significant loading on the firewall. The fact sshguard is restarting implies the logs are rotating every ~20mins. You should check which log is filling and rotating. And I would disable log compression at least as a test. That's in Status > System Logs > Settings.
-
@sammiorelli
https://docs.netgate.com/pfsense/troubleshooting/disk-lifetime.html
Check the eMMC status, just to be sure it is OK and not the root cause. -
It looks like the default checks to log blocked traffic were putting a lot of logs in the Firewall logs so I turned those off. Confirmed that compression was in the default "none" configuration.
What I'm really struggling with on all of this is we're now dealing with a factory-default device. I reflashed it and did not restore my backup and the behavior is unchanged. This feels like a glaring red flag to me.
Also checked the eMMC and looks like it's healthy with 0-10% of life consumed and Pre-EOL of Normal. Full report below.
=============================================
Extended CSD rev 1.8 (MMC 5.1)Card Supported Command sets [S_CMD_SET: 0x01]
HPI Features [HPI_FEATURE: 0x01]: implementation based on CMD13
Background operations support [BKOPS_SUPPORT: 0x01]
Max Packet Read Cmd [MAX_PACKED_READS: 0x3f]
Max Packet Write Cmd [MAX_PACKED_WRITES: 0x3f]
Data TAG support [DATA_TAG_SUPPORT: 0x01]
Data TAG Unit Size [TAG_UNIT_SIZE: 0x03]
Tag Resources Size [TAG_RES_SIZE: 0x03]
Context Management Capabilities [CONTEXT_CAPABILITIES: 0x05]
Large Unit Size [LARGE_UNIT_SIZE_M1: 0x00]
Extended partition attribute support [EXT_SUPPORT: 0x03]
Generic CMD6 Timer [GENERIC_CMD6_TIME: 0x19]
Power off notification [POWER_OFF_LONG_TIME: 0x19]
Cache Size [CACHE_SIZE] is 512 KiB
Background operations status [BKOPS_STATUS: 0x01]
1st Initialisation Time after programmed sector [INI_TIMEOUT_AP: 0x5a]
Power class for 52MHz, DDR at 3.6V [PWR_CL_DDR_52_360: 0x00]
Power class for 52MHz, DDR at 1.95V [PWR_CL_DDR_52_195: 0xdd]
Power class for 200MHz at 3.6V [PWR_CL_200_360: 0xdd]
Power class for 200MHz, at 1.95V [PWR_CL_200_195: 0x00]
Minimum Performance for 8bit at 52MHz in DDR mode:
[MIN_PERF_DDR_W_8_52: 0x00]
[MIN_PERF_DDR_R_8_52: 0x00]
TRIM Multiplier [TRIM_MULT: 0x03]
Secure Feature support [SEC_FEATURE_SUPPORT: 0x55]
Boot Information [BOOT_INFO: 0x07]
Device supports alternative boot method
Device supports dual data rate during boot
Device supports high speed timing during boot
Boot partition size [BOOT_SIZE_MULTI: 0x20]
Access size [ACC_SIZE: 0x08]
High-capacity erase unit size [HC_ERASE_GRP_SIZE: 0x01]
i.e. 512 KiB
High-capacity erase timeout [ERASE_TIMEOUT_MULT: 0x03]
Reliable write sector count [REL_WR_SEC_C: 0x01]
High-capacity W protect group size [HC_WP_GRP_SIZE: 0x10]
i.e. 8192 KiB
Sleep current (VCC) [S_C_VCC: 0x05]
Sleep current (VCCQ) [S_C_VCCQ: 0x07]
Sleep/awake timeout [S_A_TIMEOUT: 0x12]
Sector Count [SEC_COUNT: 0x00e90e80]
Device is block-addressed
Minimum Write Performance for 8bit:
[MIN_PERF_W_8_52: 0x0a]
[MIN_PERF_R_8_52: 0x0a]
[MIN_PERF_W_8_26_4_52: 0x0a]
[MIN_PERF_R_8_26_4_52: 0x0a]
Minimum Write Performance for 4bit:
[MIN_PERF_W_4_26: 0x0a]
[MIN_PERF_R_4_26: 0x0a]
Power classes registers:
[PWR_CL_26_360: 0x00]
[PWR_CL_52_360: 0x00]
[PWR_CL_26_195: 0xdd]
[PWR_CL_52_195: 0xdd]
Partition switching timing [PARTITION_SWITCH_TIME: 0x03]
Out-of-interrupt busy timing [OUT_OF_INTERRUPT_TIME: 0x0a]
I/O Driver Strength [DRIVER_STRENGTH: 0x1f]
Card Type [CARD_TYPE: 0x57]
HS400 Dual Data Rate eMMC @200MHz 1.8VI/O
HS200 Single Data Rate eMMC @200MHz 1.8VI/O
HS Dual Data Rate eMMC @52MHz 1.8V or 3VI/O
HS eMMC @52MHz - at rated device voltage(s)
HS eMMC @26MHz - at rated device voltage(s)
CSD structure version [CSD_STRUCTURE: 0x02]
Command set [CMD_SET: 0x00]
Command set revision [CMD_SET_REV: 0x00]
Power class [POWER_CLASS: 0x0d]
High-speed interface timing [HS_TIMING: 0x01]
Enhanced Strobe mode [STROBE_SUPPORT: 0x01]
Erased memory content [ERASED_MEM_CONT: 0x00]
Boot configuration bytes [PARTITION_CONFIG: 0x03]
Not boot enable
R/W Replay Protected Memory Block (RPMB)
Boot config protection [BOOT_CONFIG_PROT: 0x00]
Boot bus Conditions [BOOT_BUS_CONDITIONS: 0x00]
High-density erase group definition [ERASE_GROUP_DEF: 0x01]
Boot write protection status registers [BOOT_WP_STATUS]: 0x00
Boot Area Write protection [BOOT_WP]: 0x00
Power ro locking: possible
Permanent ro locking: possible
partition 0 ro lock status: not locked
partition 1 ro lock status: not locked
User area write protection register [USER_WP]: 0x00
FW configuration [FW_CONFIG]: 0x00
RPMB Size [RPMB_SIZE_MULT]: 0x20
Write reliability setting register [WR_REL_SET]: 0x1f
user area: the device protects existing data if a power failure occurs during a write operation
partition 1: the device protects existing data if a power failure occurs during a write operation
partition 2: the device protects existing data if a power failure occurs during a write operation
partition 3: the device protects existing data if a power failure occurs during a write operation
partition 4: the device protects existing data if a power failure occurs during a write operation
Write reliability parameter register [WR_REL_PARAM]: 0x15
Device supports writing EXT_CSD_WR_REL_SET
Device supports the enhanced def. of reliable write
Enable background operations handshake [BKOPS_EN]: 0x02
H/W reset function [RST_N_FUNCTION]: 0x00
HPI management [HPI_MGMT]: 0x00
Partitioning Support [PARTITIONING_SUPPORT]: 0x07
Device support partitioning feature
Device can have enhanced tech.
Max Enhanced Area Size [MAX_ENH_SIZE_MULT]: 0x0001b5
i.e. 3579904 KiB
Partitions attribute [PARTITIONS_ATTRIBUTE]: 0x00
Partitioning Setting [PARTITION_SETTING_COMPLETED]: 0x00
Device partition setting NOT complete
General Purpose Partition Size
[GP_SIZE_MULT_4]: 0x000000
[GP_SIZE_MULT_3]: 0x000000
[GP_SIZE_MULT_2]: 0x000000
[GP_SIZE_MULT_1]: 0x000000
Enhanced User Data Area Size [ENH_SIZE_MULT]: 0x000000
i.e. 0 KiB
Enhanced User Data Start Address [ENH_START_ADDR]: 0x00000000
i.e. 0 bytes offset
Bad Block Management mode [SEC_BAD_BLK_MGMNT]: 0x00
Periodic Wake-up [PERIODIC_WAKEUP]: 0x00
Program CID/CSD in DDR mode support [PROGRAM_CID_CSD_DDR_SUPPORT]: 0x01
Vendor Specific Fields [VENDOR_SPECIFIC_FIELD[127]]: 0x00
Vendor Specific Fields [VENDOR_SPECIFIC_FIELD[126]]: 0x00
Vendor Specific Fields [VENDOR_SPECIFIC_FIELD[125]]: 0x00
Vendor Specific Fields [VENDOR_SPECIFIC_FIELD[124]]: 0x00
Vendor Specific Fields [VENDOR_SPECIFIC_FIELD[123]]: 0x01
Vendor Specific Fields [VENDOR_SPECIFIC_FIELD[122]]: 0x00
Vendor Specific Fields [VENDOR_SPECIFIC_FIELD[121]]: 0x00
Vendor Specific Fields [VENDOR_SPECIFIC_FIELD[120]]: 0x01
Vendor Specific Fields [VENDOR_SPECIFIC_FIELD[119]]: 0x00
Vendor Specific Fields [VENDOR_SPECIFIC_FIELD[118]]: 0x00
Vendor Specific Fields [VENDOR_SPECIFIC_FIELD[117]]: 0x00
Vendor Specific Fields [VENDOR_SPECIFIC_FIELD[116]]: 0x00
Vendor Specific Fields [VENDOR_SPECIFIC_FIELD[115]]: 0x00
Vendor Specific Fields [VENDOR_SPECIFIC_FIELD[114]]: 0x00
Vendor Specific Fields [VENDOR_SPECIFIC_FIELD[113]]: 0x00
Vendor Specific Fields [VENDOR_SPECIFIC_FIELD[112]]: 0x00
Vendor Specific Fields [VENDOR_SPECIFIC_FIELD[111]]: 0x00
Vendor Specific Fields [VENDOR_SPECIFIC_FIELD[110]]: 0x00
Vendor Specific Fields [VENDOR_SPECIFIC_FIELD[109]]: 0x00
Vendor Specific Fields [VENDOR_SPECIFIC_FIELD[108]]: 0x00
Vendor Specific Fields [VENDOR_SPECIFIC_FIELD[107]]: 0x00
Vendor Specific Fields [VENDOR_SPECIFIC_FIELD[106]]: 0x00
Vendor Specific Fields [VENDOR_SPECIFIC_FIELD[105]]: 0x00
Vendor Specific Fields [VENDOR_SPECIFIC_FIELD[104]]: 0x00
Vendor Specific Fields [VENDOR_SPECIFIC_FIELD[103]]: 0x00
Vendor Specific Fields [VENDOR_SPECIFIC_FIELD[102]]: 0x00
Vendor Specific Fields [VENDOR_SPECIFIC_FIELD[101]]: 0x00
Vendor Specific Fields [VENDOR_SPECIFIC_FIELD[100]]: 0x00
Vendor Specific Fields [VENDOR_SPECIFIC_FIELD[99]]: 0x00
Vendor Specific Fields [VENDOR_SPECIFIC_FIELD[98]]: 0x00
Vendor Specific Fields [VENDOR_SPECIFIC_FIELD[97]]: 0x00
Vendor Specific Fields [VENDOR_SPECIFIC_FIELD[96]]: 0x00
Vendor Specific Fields [VENDOR_SPECIFIC_FIELD[95]]: 0x02
Vendor Specific Fields [VENDOR_SPECIFIC_FIELD[94]]: 0x00
Vendor Specific Fields [VENDOR_SPECIFIC_FIELD[93]]: 0x01
Vendor Specific Fields [VENDOR_SPECIFIC_FIELD[92]]: 0x00
Vendor Specific Fields [VENDOR_SPECIFIC_FIELD[91]]: 0x00
Vendor Specific Fields [VENDOR_SPECIFIC_FIELD[90]]: 0x00
Vendor Specific Fields [VENDOR_SPECIFIC_FIELD[89]]: 0x00
Vendor Specific Fields [VENDOR_SPECIFIC_FIELD[88]]: 0x00
Vendor Specific Fields [VENDOR_SPECIFIC_FIELD[87]]: 0x00
Vendor Specific Fields [VENDOR_SPECIFIC_FIELD[86]]: 0x00
Vendor Specific Fields [VENDOR_SPECIFIC_FIELD[85]]: 0x00
Vendor Specific Fields [VENDOR_SPECIFIC_FIELD[84]]: 0x00
Vendor Specific Fields [VENDOR_SPECIFIC_FIELD[83]]: 0x00
Vendor Specific Fields [VENDOR_SPECIFIC_FIELD[82]]: 0x00
Vendor Specific Fields [VENDOR_SPECIFIC_FIELD[81]]: 0x00
Vendor Specific Fields [VENDOR_SPECIFIC_FIELD[80]]: 0x00
Vendor Specific Fields [VENDOR_SPECIFIC_FIELD[79]]: 0x00
Vendor Specific Fields [VENDOR_SPECIFIC_FIELD[78]]: 0x00
Vendor Specific Fields [VENDOR_SPECIFIC_FIELD[77]]: 0x00
Vendor Specific Fields [VENDOR_SPECIFIC_FIELD[76]]: 0x00
Vendor Specific Fields [VENDOR_SPECIFIC_FIELD[75]]: 0x00
Vendor Specific Fields [VENDOR_SPECIFIC_FIELD[74]]: 0x00
Vendor Specific Fields [VENDOR_SPECIFIC_FIELD[73]]: 0x00
Vendor Specific Fields [VENDOR_SPECIFIC_FIELD[72]]: 0x00
Vendor Specific Fields [VENDOR_SPECIFIC_FIELD[71]]: 0x00
Vendor Specific Fields [VENDOR_SPECIFIC_FIELD[70]]: 0x00
Vendor Specific Fields [VENDOR_SPECIFIC_FIELD[69]]: 0x00
Vendor Specific Fields [VENDOR_SPECIFIC_FIELD[68]]: 0x00
Vendor Specific Fields [VENDOR_SPECIFIC_FIELD[67]]: 0x00
Vendor Specific Fields [VENDOR_SPECIFIC_FIELD[66]]: 0x00
Vendor Specific Fields [VENDOR_SPECIFIC_FIELD[65]]: 0x00
Vendor Specific Fields [VENDOR_SPECIFIC_FIELD[64]]: 0x00
Native sector size [NATIVE_SECTOR_SIZE]: 0x00
Sector size emulation [USE_NATIVE_SECTOR]: 0x00
Sector size [DATA_SECTOR_SIZE]: 0x00
1st initialization after disabling sector size emulation [INI_TIMEOUT_EMU]: 0x0a
Class 6 commands control [CLASS_6_CTRL]: 0x00
Number of addressed group to be Released[DYNCAP_NEEDED]: 0x00
Exception events control [EXCEPTION_EVENTS_CTRL]: 0x0000
Exception events status[EXCEPTION_EVENTS_STATUS]: 0x0000
Extended Partitions Attribute [EXT_PARTITIONS_ATTRIBUTE]: 0x0000
Context configuration [CONTEXT_CONF[51]]: 0x00
Context configuration [CONTEXT_CONF[50]]: 0x00
Context configuration [CONTEXT_CONF[49]]: 0x00
Context configuration [CONTEXT_CONF[48]]: 0x00
Context configuration [CONTEXT_CONF[47]]: 0x00
Context configuration [CONTEXT_CONF[46]]: 0x00
Context configuration [CONTEXT_CONF[45]]: 0x00
Context configuration [CONTEXT_CONF[44]]: 0x00
Context configuration [CONTEXT_CONF[43]]: 0x00
Context configuration [CONTEXT_CONF[42]]: 0x00
Context configuration [CONTEXT_CONF[41]]: 0x00
Context configuration [CONTEXT_CONF[40]]: 0x00
Context configuration [CONTEXT_CONF[39]]: 0x00
Context configuration [CONTEXT_CONF[38]]: 0x00
Context configuration [CONTEXT_CONF[37]]: 0x00
Packed command status [PACKED_COMMAND_STATUS]: 0x00
Packed command failure index [PACKED_FAILURE_INDEX]: 0x00
Power Off Notification [POWER_OFF_NOTIFICATION]: 0x00
Control to turn the Cache ON/OFF [CACHE_CTRL]: 0x01
Control to turn the Cache Barrier ON/OFF [BARRIER_CTRL]: 0x00
eMMC Firmware Version: 73103517
eMMC Life Time Estimation A [EXT_CSD_DEVICE_LIFE_TIME_EST_TYP_A]: 0x01
eMMC Life Time Estimation B [EXT_CSD_DEVICE_LIFE_TIME_EST_TYP_B]: 0x01
eMMC Pre EOL information [EXT_CSD_PRE_EOL_INFO]: 0x01
Secure Removal Type [SECURE_REMOVAL_TYPE]: 0x08
information is configured to be removed by an erase of the physical memory
Supported Secure Removal Type:
information removed using a vendor defined
Command Queue Support [CMDQ_SUPPORT]: 0x01
Command Queue Depth [CMDQ_DEPTH]: 32
Command Enabled [CMDQ_MODE_EN]: 0x00 -
Hmm, I've never seen a hardware issue present like that though. If it's not a config problem it could be an environmental issue, something in the local network causing a connectivity problem. Somehow.
-
@stephenw10 the prior device that RMA'd with this behavior was ticket INC-96963. Any chance that device was investigated when it came back?
-
@sammiorelli
Is it possible that you have enabled flow control on the network, for example, on the switch?
Did you try to continuously ping pfSense from the PC and vice versa? -
Hmm, that must have been a while ago, we no longer use that ticket system. Do you have the serial number or NDI from it? You can send it to me in chat.
Was that 2100 installed in the same location? Same network?