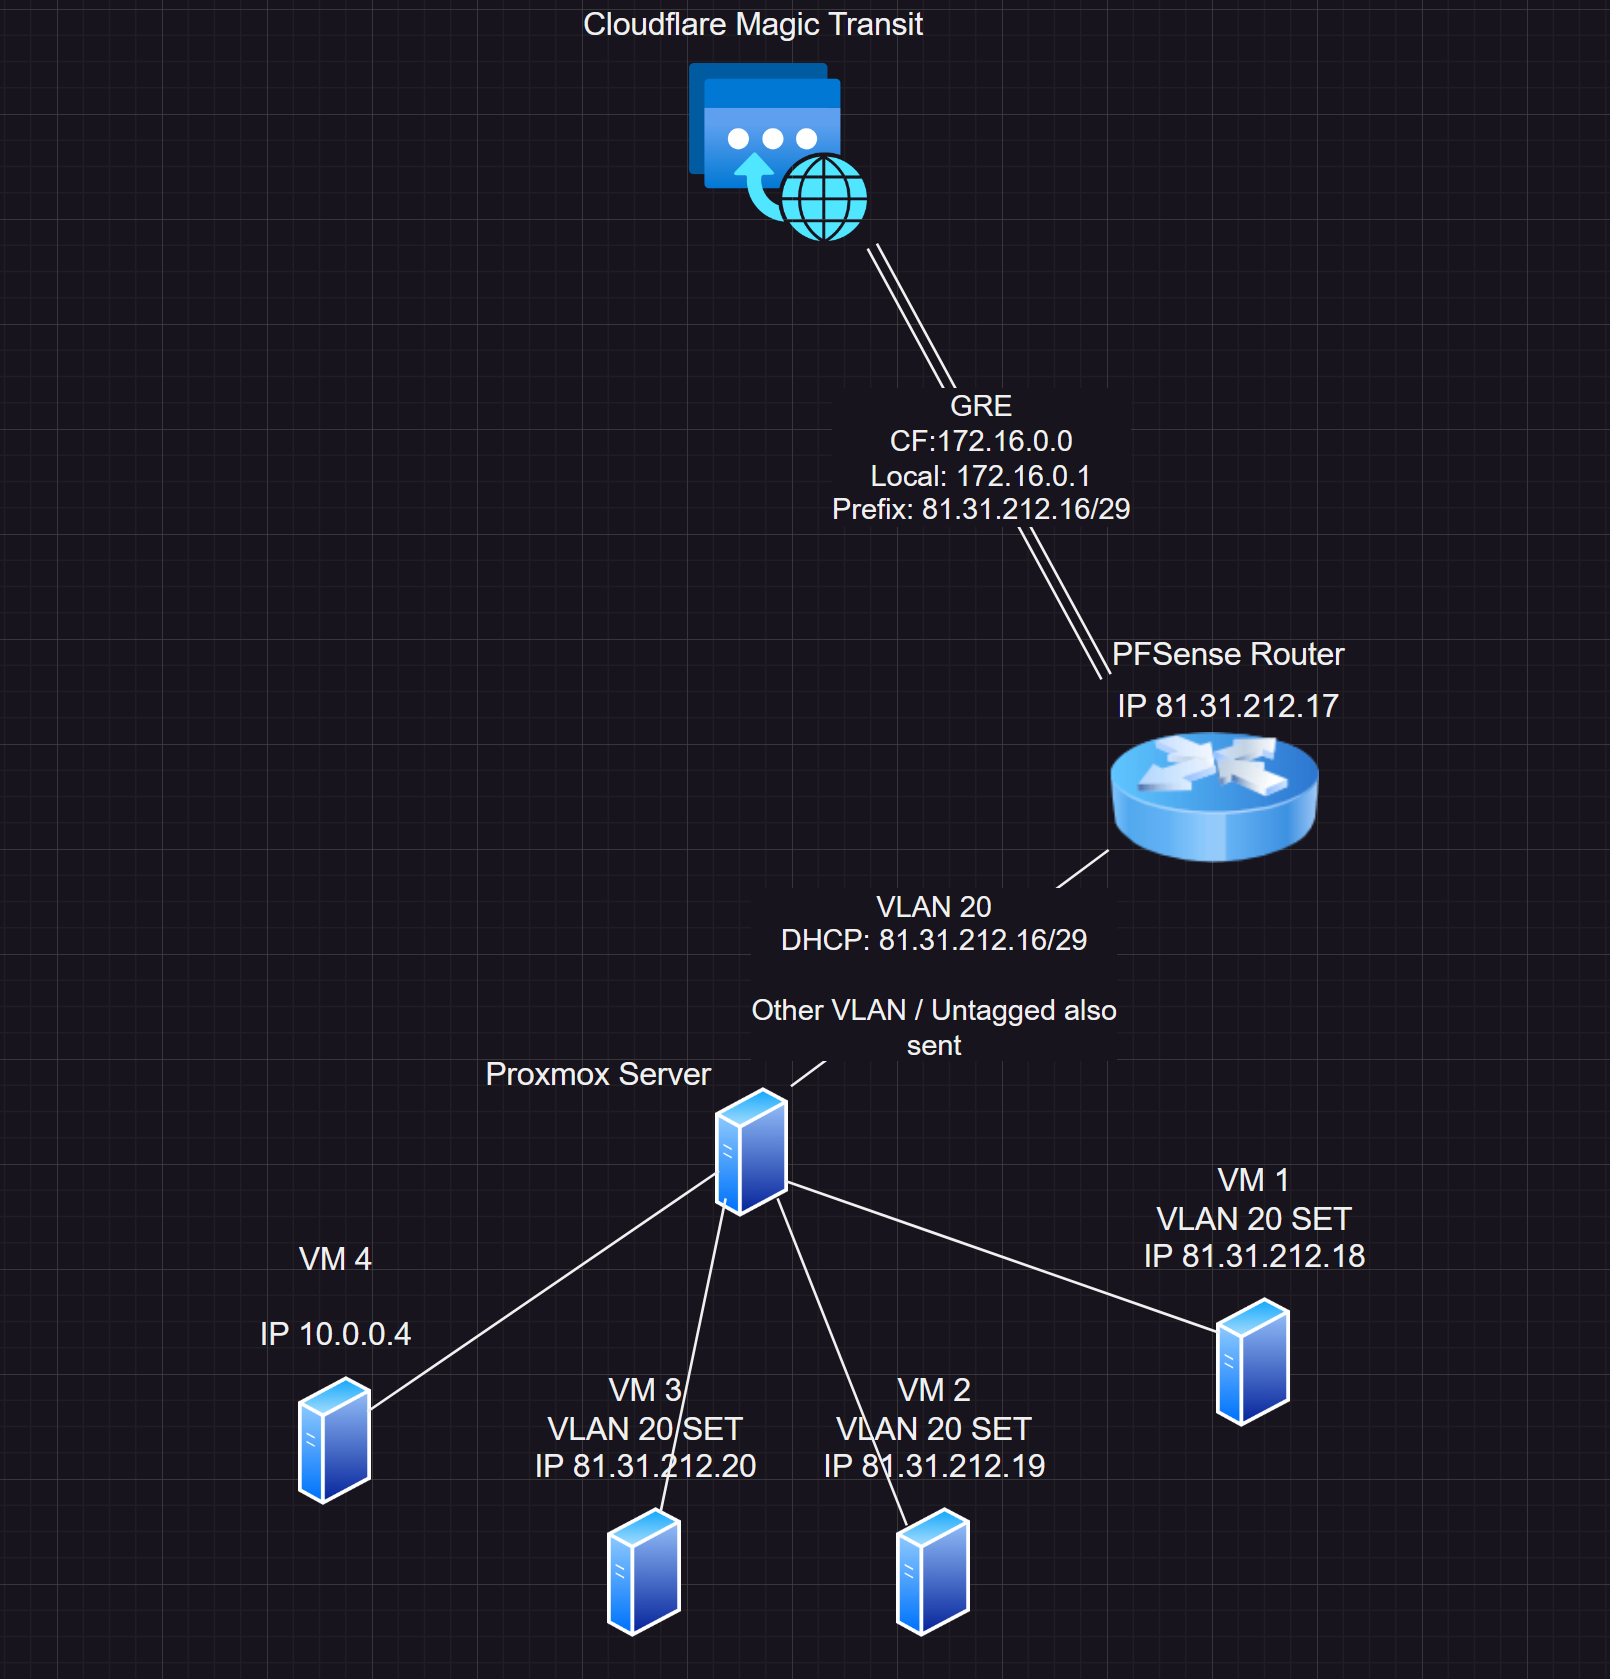
Assigning IPs from subnet over GRE to Proxmox VM's
-
Ah, OK. Yes, if a VIP added to LAN does respond to external pings then it must be routed to you correctly.
You should just be able to add the subnet to the VLAN20 interface in pfSense directly. So probably as the first IP in the subnet: 81.1.212.17/29
Then on the VMs add them statically as the other IPs, so 81.1.212.18/29 etc. Set 81.1.212.17 as the default route/gateway for those VMs.
-
@stephenw10 So i’m still unable to get this to work…
I’ve come across this which mentions having a dedicated interface with the subnet attached (I’m using a VLAN for this) and then directly assigning the IPs to the VMs but it mentions bridging the interface to WAN, now in this scenario I believe the GRE interface would be acting as a WAN for the subnet? only issue here is you can’t bridge a GRE to a VLAN…? what can I do here?
So far I have:
GRE1: local 172.16.0.1 remote 172.16.0.0
VLAN20 (igb3.20):
Static IPv4: x.x.x.16/29VM (test-vm:m; debian 12):
ens3 - 10.128.0.2/16 gw 10.128.0.1
ens4 (vlan20) - x.x.x.17/32 gw x.x.x.16outbound NAT disabled on VLAN20 and pfsense in Hybrid Outbound NAT mode
I’ve also tested outbound NAT with a virtual ip (proxy arp) on VLAN20 and it can do inbound just fine but the second it comes to translating it outbound it fails with nothing but the outbound request printed in
tcpdumpforigb3.20thegre0interface sees nothing… -
I've just logged on to my laptop now to get some screenshots and details of the configuration to show better detail of how everything is setup.
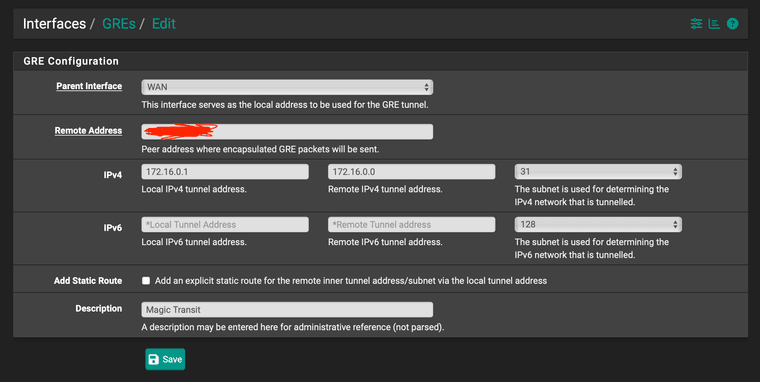
Firstly the GRE Tunnel is configured as such:
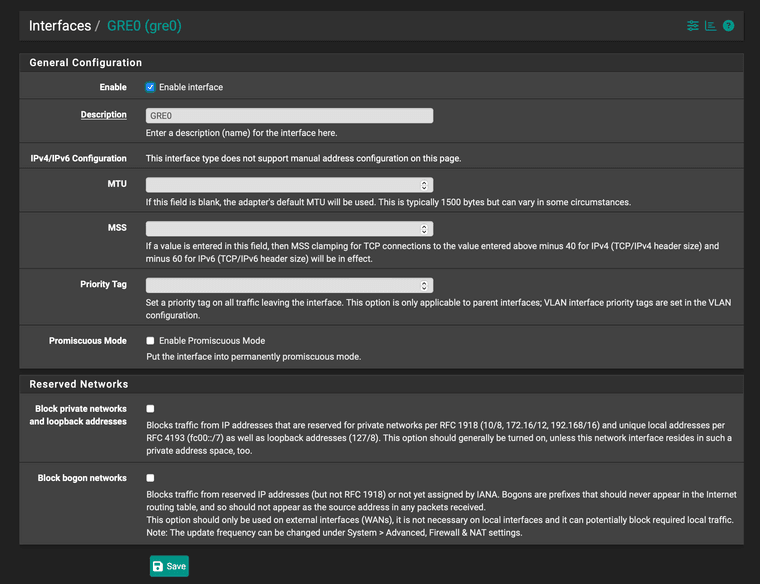
Then the GRE0 interface is configured like this:
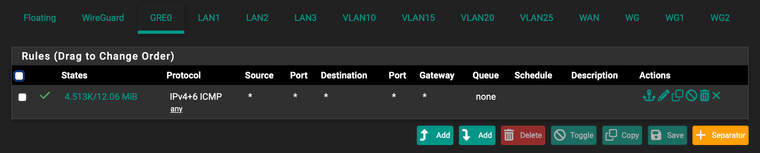
I have the firewall rules for the GRE0 interface set to allow ICMP only at the moment (for Cloudflare health checks on the tunnel):
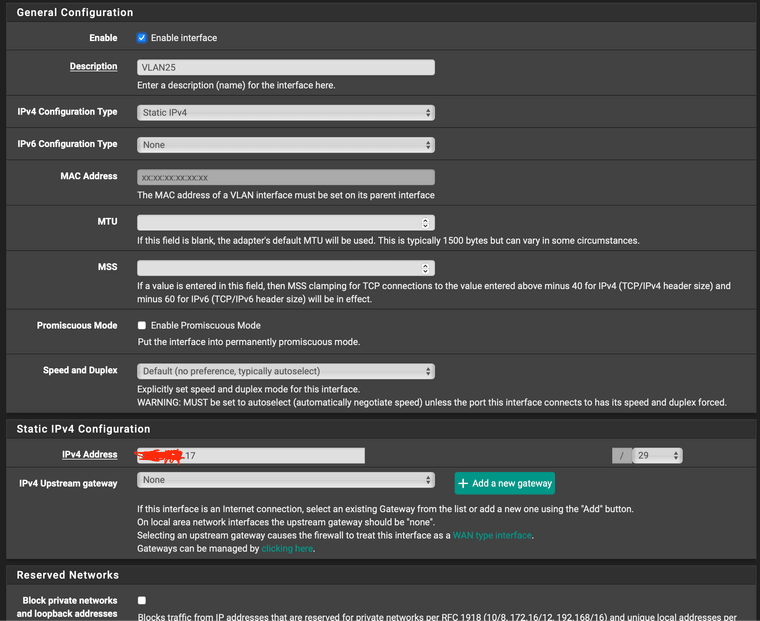
Then VLAN25 is configured as such:
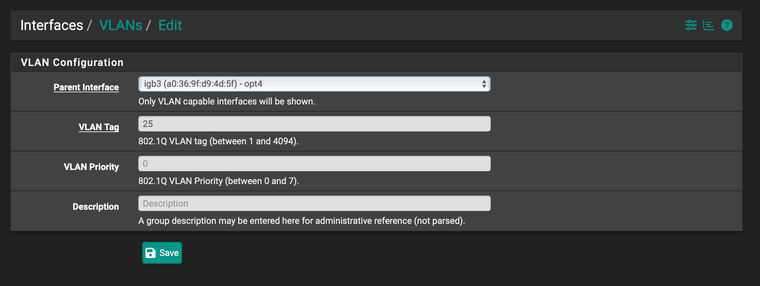
The VLAN25 Interface is configured with
x.x.x.17at the moment but the subnet starts atx.x.x.16I have tried both of these though...
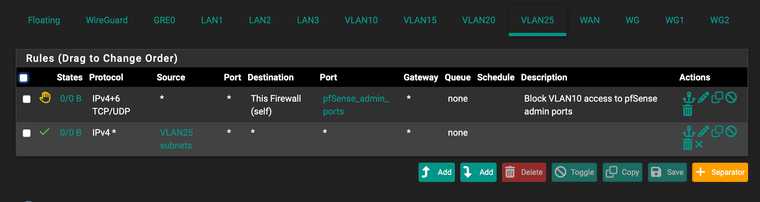
The Firewall rules for VLAN25 are configured as such:
Now on the test vm the network is configured as such:
ip addr add dev enp6s19 x.x.x.18/32
ip link set dev enp6s19 up
and this is the
ip a&ip routeoutput for that machine:root@test-vm:~ # ip a 1: lo: <LOOPBACK,UP,LOWER_UP> mtu 65536 qdisc noqueue state UNKNOWN group default qlen 1000 link/loopback 00:00:00:00:00:00 brd 00:00:00:00:00:00 inet 127.0.0.1/8 scope host lo valid_lft forever preferred_lft forever inet6 ::1/128 scope host noprefixroute valid_lft forever preferred_lft forever 2: eth0: <BROADCAST,MULTICAST,UP,LOWER_UP> mtu 1500 qdisc fq_codel state UP group default qlen 1000 link/ether bc:24:11:20:1a:aa brd ff:ff:ff:ff:ff:ff altname enp6s18 inet 10.128.0.2/16 brd 10.128.255.255 scope global eth0 valid_lft forever preferred_lft forever inet6 fe80::be24:11ff:fe20:1aaa/64 scope link valid_lft forever preferred_lft forever 4: enp6s19: <BROADCAST,MULTICAST,UP,LOWER_UP> mtu 1500 qdisc fq_codel state UP group default qlen 1000 link/ether bc:24:11:73:54:b6 brd ff:ff:ff:ff:ff:ff inet x.x.x.18/32 scope global enp6s19 valid_lft forever preferred_lft forever inet6 fe80::be24:11ff:fe73:54b6/64 scope link valid_lft forever preferred_lft forever root@test-vm:~ # ip route default via 10.128.0.1 dev eth0 proto static 10.128.0.0/16 dev eth0 proto kernel scope link src 10.128.0.2 root@test-vm:~ #Now initial testing on the test vm to see if that interface can reach the outside world fails:
root@test-vm:~ # curl --interface enp6s19 ipinfo.io
curl: (7) Failed to connect to ipinfo.io port 80 after 3081 ms: Couldn't connect to server
root@test-vm:~ # ping -I enp6s19 1.1.1.1
PING 1.1.1.1 (1.1.1.1) from 81.31.212.18 enp6s19: 56(84) bytes of data.
^C
--- 1.1.1.1 ping statistics ---
7 packets transmitted, 0 received, 100% packet loss, time 6145ms
pipe 4
root@test-vm:~ #
Leaving
ping -I enp6s19 1.1.1.1running on the test vm and watchingtcpdump -i gre0andtcpdump -i igb3.25output on the pfsense box shows the following...For
igb3.25:root@pfSense:~ # tcpdump -i igb3.25 tcpdump: verbose output suppressed, use -v[v]... for full protocol decode listening on igb3.25, link-type EN10MB (Ethernet), snapshot length 262144 bytes 11:43:30.627432 ARP, Request who-has one.one.one.one tell x.x.x.18, length 42 11:43:31.651369 ARP, Request who-has one.one.one.one tell x.x.x.18, length 42 11:43:32.675386 ARP, Request who-has one.one.one.one tell x.x.x.18, length 42 11:43:33.699424 ARP, Request who-has one.one.one.one tell x.x.x.18, length 42 11:43:34.723326 ARP, Request who-has one.one.one.one tell x.x.x.18, length 42 11:43:35.747338 ARP, Request who-has one.one.one.one tell x.x.x.18, length 42 11:43:36.772000 ARP, Request who-has one.one.one.one tell x.x.x.18, length 42 11:43:37.795302 ARP, Request who-has one.one.one.one tell x.x.x.18, length 42 ^C 8 packets captured 8 packets received by filter 0 packets dropped by kernel root@pfSense:~ #You can see that this is doing "something" but it only appears to be sending ARP requests and nothing is responding to those requests...
Now running
tcpdump -i gre0 not icmp | grep "x.x.x.18"on pfSense gets a little bit interesting, you can't see any of the ICMP requests heading outbound on the GRE0 interface at all, BUT! you can see the inbound requests from my mail server which I performed a traceroute on to "x.x.x.18" (shown further down):root@pfSense:~ # tcpdump -i gre0 not icmp | grep "x.x.x.18" tcpdump: verbose output suppressed, use -v[v]... for full protocol decode listening on gre0, link-type NULL (BSD loopback), snapshot length 262144 bytes 11:46:29.871382 IP scan-52g.shadowserver.org.35479 > x.x.x.18.9001: Flags [S], seq 599764770, win 65535, length 0 11:46:31.516766 IP 222.89.13.82.50919 > x.x.x.18.telnet: Flags [S], seq 1361040402, win 58055, options [mss 536], length 0 11:46:32.701287 IP mail.redacted.56399 > x.x.x.18.33471: UDP, length 32 11:46:32.701307 IP mail.redacted.51094 > x.x.x.18.33472: UDP, length 32 11:46:32.701310 IP mail.redacted.32176 > x.x.x.18.33468: UDP, length 32 11:46:32.702410 IP mail.redacted.23634 > x.x.x.18.33470: UDP, length 32 11:46:33.992008 IP mail.redacted.3235 > x.x.x.18.33477: UDP, length 32 11:46:33.992030 IP mail.redacted.20704 > x.x.x.18.33473: UDP, length 32 11:46:33.992134 IP mail.redacted.65246 > x.x.x.18.33474: UDP, length 32 11:46:33.992148 IP mail.redacted.25379 > x.x.x.18.33479: UDP, length 32And here you can see the failed ping test and the traceroute from my mail server (external) to
x.x.x.18:toor@mail:~ % ping x.x.x.18 PING x.x.x.18 (x.x.x.18) 56(84) bytes of data. ^C --- x.x.x.18 ping statistics --- 7 packets transmitted, 0 received, 100% packet loss, time 6121ms toor@mail:~ % traceroute x.x.x.18 traceroute to x.x.x.18 (x.x.x.18), 30 hops max, 60 byte packets 1 10.207.6.111 (10.207.6.111) 0.208 ms 0.086 ms 0.066 ms 2 10.207.35.20 (10.207.35.20) 0.249 ms 10.207.35.19 (10.207.35.19) 0.240 ms 10.207.35.20 (10.207.35.20) 0.149 ms 3 10.207.32.2 (10.207.32.2) 0.157 ms 0.238 ms 10.207.32.1 (10.207.32.1) 0.203 ms 4 lo0-0.gw2.lon1.gb.linode.com (109.74.207.102) 0.455 ms 0.311 ms lo0-0.gw1.lon1.gb.linode.com (109.74.207.101) 0.548 ms 5 ae17.r02.lon03.ien.netarch.akamai.com (23.210.50.24) 1.294 ms ae20.r21.lon01.ien.netarch.akamai.com (23.210.48.106) 0.703 ms ae19.r22.lon01.ien.netarch.akamai.com (23.210.48.108) 0.649 ms 6 ae5.r22.lon01.mag.netarch.akamai.com (23.197.64.70) 1.072 ms ae4.r22.lon01.mag.netarch.akamai.com (23.197.64.66) 0.934 ms 0.772 ms 7 ae2.r23.lon01.ien.netarch.akamai.com (23.197.64.75) 0.665 ms 0.637 ms 141.101.71.61 (141.101.71.61) 2.760 ms 8 a23-210-48-145.deploy.static.akamaitechnologies.com (23.210.48.145) 24.593 ms 172.70.88.254 (172.70.88.254) 1.538 ms a23-210-48-235.deploy.static.akamaitechnologies.com (23.210.48.235) 1.309 ms 9 141.101.71.105 (141.101.71.105) 5.685 ms 141.101.71.47 (141.101.71.47) 1.666 ms 141.101.71.91 (141.101.71.91) 1.220 ms 10 141.101.70.91 (141.101.70.91) 0.873 ms 172.70.161.124 (172.70.161.124) 1.168 ms 141.101.70.45 (141.101.70.45) 1.573 ms 11 172.69.193.224 (172.69.193.224) 1.474 ms 172.70.84.53 (172.70.84.53) 1.268 ms 172.70.89.11 (172.70.89.11) 1.378 ms 12 172.69.43.38 (172.69.43.38) 1.472 ms * 172.69.193.134 (172.69.193.134) 1.361 ms 13 * * * 14 * * * 15 * * * 16 * * * 17 * * * 18 * * * 19 * * * 20 * * * 21 * * * 22 * * * 23 * * * 24 * * * 25 * * * 26 * * * 27 * * * 28 * * * 29 * * * 30 * * * toor@mail:~ %I am completely out of ideas at this point, as it's entirely unclear why this isn't just working at this point?
I do hope this helps expand on how my setup is running though.
EDIT: performed a further test and
x.x.x.17is pingable from my mail servertoor@mail:~ % ping x.x.x.17 PING x.x.x.17 (x.x.x.17) 56(84) bytes of data. 64 bytes from x.x.x.17: icmp_seq=1 ttl=53 time=18.0 ms 64 bytes from x.x.x.17: icmp_seq=2 ttl=53 time=18.8 ms ^C --- x.x.x.17 ping statistics --- 2 packets transmitted, 2 received, 0% packet loss, time 1001ms rtt min/avg/max/mdev = 17.973/18.385/18.797/0.412 ms toor@mail:~ %But not the
x.x.x.18ip assigned to the vm...EDIT 2: Decided it may be helpful to show the routing table on pfSense here as well
y.y.y.yis my ISP related addresses
x.x.x.xis my GRE tunnel/Magic Transit related addressesroot@pfSense:~ # netstat -rn Routing tables Internet: Destination Gateway Flags Netif Expire default y.y.y.1 UGS igb0 10.0.0.0/16 link#2 U igb1 10.0.0.1 link#7 UHS lo0 10.2.0.0/16 link#3 U igb2 10.2.0.1 link#7 UHS lo0 10.4.0.0/16 link#4 U igb3 10.4.0.1 link#7 UHS lo0 10.7.0.0/24 link#10 U tun_wg0 10.7.0.2 link#7 UHS lo0 10.32.0.0/16 link#13 U igb3.10 10.32.0.1 link#7 UHS lo0 10.64.0.0/16 link#14 U igb3.15 10.64.0.1 link#7 UHS lo0 10.69.0.0/24 link#11 U tun_wg1 10.69.0.1 link#7 UHS lo0 10.70.0.0/24 link#12 U tun_wg2 10.70.0.1 link#7 UHS lo0 10.128.0.0/24 link#15 U igb3.20 10.128.0.1 link#7 UHS lo0 x.x.x.16/29 link#17 U igb3.25 x.x.x.17 link#7 UHS lo0 x.x.x.0/23 link#1 U igb0 y.y.y.1 link#1 UHS igb0 y.y.y.152 link#7 UHS lo0 127.0.0.1 link#7 UH lo0 172.16.0.0 link#16 UH gre0 172.16.0.0/31 172.16.0.0 UGS lo0 172.16.0.0/31 172.16.0.1 UGS lo0 172.16.0.1 link#7 UHS lo0 172.17.0.0/30 172.17.0.2 UGS lo0 172.19.0.0/31 172.19.0.1 UGS lo0 172.19.0.0/24 172.19.0.2 UGS lo0 194.168.4.100 link#1 UHS igb0 194.168.8.100 link#1 UHS igb0 -
If the /29 is routed to you then you should just be able to use it on VLAN20 as you have done. And it looks like it must be routed to you because a VIP on LAN could not respond to ARP requests on WAN/GRE.
Can you ping the .16 IP address you assigned to the VLAN20 interface from an external source? Assuming you have rules to pass that on GRE.
If that works then VMs using IPs in that subnet should also work.
-
@stephenw10 Sorry I didn't see your reply, I have edited my previous reply with output of a ping from my mail server (external) to the .17 IP on VLAN25 (I am using a new vlan; 25 is the one for this test now)
So the .17 IP address does indeed ping from externally just fine, it's assigned directly to the interface (no virtual IP is used here):
toor@mail:~ % ping x.x.x.17 PING x.x.x.17 (x.x.x.17) 56(84) bytes of data. 64 bytes from x.x.x.17: icmp_seq=1 ttl=53 time=18.0 ms 64 bytes from x.x.x.17: icmp_seq=2 ttl=53 time=18.8 ms ^C --- x.x.x.17 ping statistics --- 2 packets transmitted, 2 received, 0% packet loss, time 1001ms rtt min/avg/max/mdev = 17.973/18.385/18.797/0.412 ms toor@mail:~ %I also provided the routing table from pfSense as an edit to my previous response just now as well :)
-
Ok you need to set the subnet mask to /29 on the VMs too. And set a gateway/default route on the VMs as the pfSense interface IP so they are able to route out.
-
@stephenw10 Okay so I've deleted the IP and re-added it as a /29 on the VM:
ip addr del dev enp6s19 x.x.x.18/32
ip addr add dev enp6s19 x.x.x.18/29
ip route add default via x.x.x.17
I set the default route via
x.x.x.17(vlan25 gw ip), here is the output fromroute -n:root@test-vm:~ # route -n Kernel IP routing table Destination Gateway Genmask Flags Metric Ref Use Iface 0.0.0.0 x.x.x.17 0.0.0.0 UG 0 0 0 enp6s19 10.128.0.0 0.0.0.0 255.255.0.0 U 0 0 0 eth0 x.x.x.16 0.0.0.0 255.255.255.248 U 0 0 0 enp6s19 root@test-vm:~ #Now it feels like we are getting somewhat closer here...?
I lost connectivity to the VM over SSH to the VLAN20 IP
10.128.0.2but I am now able to SSH tox.x.x.18which is assigned to the VM and ping it from my MacBook on LAN1:rtbt@Toms-MacBook-Pro ~ % ping x.x.x.18 PING x.x.x.18 (x.x.x.18): 56 data bytes 64 bytes from x.x.x.18: icmp_seq=0 ttl=63 time=8.685 ms 64 bytes from x.x.x.18: icmp_seq=1 ttl=63 time=9.524 ms ^C --- x.x.x.18 ping statistics --- 2 packets transmitted, 2 packets received, 0.0% packet loss round-trip min/avg/max/stddev = 8.685/9.104/9.524/0.419 ms rtbt@Toms-MacBook-Pro ~ %So internally the IP addresses are working, but there's still no external connectivity whatsoever from the VM besides to the VLAN20 gw or the VLAN25 gw:
root@test-vm:~ # ping 1.1.1.1 PING 1.1.1.1 (1.1.1.1) 56(84) bytes of data. ^C --- 1.1.1.1 ping statistics --- 2 packets transmitted, 0 received, 100% packet loss, time 1026ms root@test-vm:~ # ping -I enp6s19 1.1.1.1 PING 1.1.1.1 (1.1.1.1) from x.x.x.18 enp6s19: 56(84) bytes of data. ^C --- 1.1.1.1 ping statistics --- 3 packets transmitted, 0 received, 100% packet loss, time 2047ms root@test-vm:~ # curl ipinfo.io ^C root@test-vm:~ # curl --interface x.x.x.18 ipinfo.io ^C root@test-vm:~ # curl --interface enp6s19 ipinfo.io ^C root@test-vm:~ # ping 10.128.0.1 PING 10.128.0.1 (10.128.0.1) 56(84) bytes of data. 64 bytes from 10.128.0.1: icmp_seq=1 ttl=64 time=0.274 ms 64 bytes from 10.128.0.1: icmp_seq=2 ttl=64 time=0.322 ms ^C --- 10.128.0.1 ping statistics --- 2 packets transmitted, 2 received, 0% packet loss, time 1032ms rtt min/avg/max/mdev = 0.274/0.298/0.322/0.024 ms root@test-vm:~ # ping x.x.x.17 PING x.x.x.17 (x.x.x.17) 56(84) bytes of data. 64 bytes from x.x.x.17: icmp_seq=1 ttl=64 time=0.283 ms ^C --- x.x.x.17 ping statistics --- 1 packets transmitted, 1 received, 0% packet loss, time 0ms rtt min/avg/max/mdev = 0.283/0.283/0.283/0.000 ms root@test-vm:~ # -
So some new information has been uncovered here...
I performed a traceroute to
1.1.1.1and the Cloudflare side of the GRE tunnel responded!172.16.0.0 (remote; cloudflare end)
172.16.0.1 (local; pfsense end)root@test-vm:~ # traceroute 1.1.1.1 traceroute to 1.1.1.1 (1.1.1.1), 30 hops max, 60 byte packets 1 172.16.0.0 (172.16.0.0) 15.463 ms 15.431 ms 15.400 ms 2 * * * 3 * * * 4 * * * 5 * * * 6 * * * 7 * * * 8 * * * 9 * * * 10 * * * 11 * * * 12 * * * 13 * * * 14 * * * 15 * * * 16 * * * 17 * * * 18 * * * 19 * * * 20 * * * 21 * * * 22 * * * 23 * * * 24 * * * 25 * * * 26 * * * 27 * * * 28 * * * 29 * * * 30 * * * root@test-vm:~ #During the test I performed a
tcpdumpongre0and seen the following:13:08:31.455182 IP 172.16.0.1.19976 > one.one.one.one.33435: UDP, length 32 13:08:31.455215 IP 172.16.0.1.26370 > one.one.one.one.33434: UDP, length 32 13:08:31.455246 IP 172.16.0.1.57490 > one.one.one.one.33436: UDP, length 32 13:08:31.455272 IP 172.16.0.1.19245 > one.one.one.one.33438: UDP, length 32 13:08:31.455288 IP 172.16.0.1.28308 > one.one.one.one.33439: UDP, length 32 13:08:31.455302 IP 172.16.0.1.17065 > one.one.one.one.33440: UDP, length 32 13:08:31.455314 IP 172.16.0.1.25154 > one.one.one.one.33437: UDP, length 32 13:08:31.455328 IP 172.16.0.1.16824 > one.one.one.one.33441: UDP, length 32 13:08:31.455416 IP 172.16.0.1.58503 > one.one.one.one.33442: UDP, length 32 13:08:31.455442 IP 172.16.0.1.41873 > one.one.one.one.33443: UDP, length 32 13:08:31.455456 IP 172.16.0.1.58879 > one.one.one.one.33444: UDP, length 32 13:08:31.455469 IP 172.16.0.1.35433 > one.one.one.one.33445: UDP, length 32 13:08:31.455538 IP 172.16.0.1.12616 > one.one.one.one.33447: UDP, length 32 13:08:31.455572 IP 172.16.0.1.11424 > one.one.one.one.33448: UDP, length 32 13:08:31.455584 IP 172.16.0.1.35466 > one.one.one.one.33446: UDP, length 32 13:08:31.455597 IP 172.16.0.1.9850 > one.one.one.one.33449: UDP, length 32 13:08:31.466959 IP 172.16.0.1.5969 > one.one.one.one.33452: UDP, length 32 13:08:31.466993 IP 172.16.0.1.30486 > one.one.one.one.33450: UDP, length 32 13:08:31.467017 IP 172.16.0.1.35717 > one.one.one.one.33451: UDP, length 32So to me this feels like the traffic is now traversing the GRE tunnel and landing at Cloudflare?
Could this potentially now be an issue on the Cloudflare end considering the above?
-
I think I realised why traffic is being sent down the tunnel:
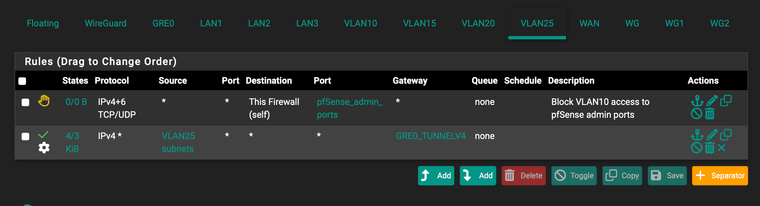
I have the any/any rule forcing traffic down the tunnel which if I remove then traffic flows outbound but only through my ISP IP and doesn't use the assigned IP from the /29
-
Another quick progress report, I started a web server on the test vm and opened port 80 for
x.x.x.18on thegre0interface and I am able to access the web server externally:toor@mail:~ % curl http://x.x.x.18 <p>This is the test VM!!</p> toor@mail:~ %I just cannot get outbound working at all! :(
-
Okay so I've got this working!
I disabled all Outbound NAT rules for
GRE0andVLAN25and added two 'NO NAT' outbound rules to theGRE0andVLAN25interface and after testing on the VM I can see that it's working now!!! -
Nice! Yeah there's a lot of ways to get that to fail! Sounds like you removed them all though.
