Repeating problem: (unbound), jid 0, uid 59, was killed: failed to reclaim memory
-
open the pfblockerng.log
Firewall -> pfBlockerNG -> Logs. (log type = Log Files, Log/file selection: pfblockerng.log)
scroll near the end of the file -- look for the section
pfSense Table Statslet us know what values you see below that heading.
there should be two lines
table-entries hard limit (with a value)
Table Usage Count (with a value)but your recent post suggests you don't think the issue it is related to pfBlockerNG based on timestamps..
-
@Mission-Ghost said in Repeating problem: (unbound), jid 0, uid 59, was killed: failed to reclaim memory:
^This suggests that servicewatchdog isn't typically jumping on the pfBlocker initiated restart. I would, I suspect, see this in the logs if it happened at the designated pfBlocker update time, which I do not.
Service Watchdog is a troubleshooting/workaround package. It was not designed to be a regular production feature. It simply periodically checks if the specified daemon is running, and restarts it immediately if it's not. With daemons that periodically either restart themselves, or are restarted by third-party packages, ignorance of such an automatic restart by Service Watchdog can result in it gumming up the works. That's why we suggest not running that package as a normal production feature.
@Mission-Ghost said in Repeating problem: (unbound), jid 0, uid 59, was killed: failed to reclaim memory:
Memory usage is at about 65%, which is typical. Seeing higher is uncommon and I have never seen full memory usage. How can I find any other evidence of what free memory was at the times these process killings occurred to test the hypothesis that memory is filling up?
This will be a dynamic failure. That means you would need to be constantly watching the memory utilization on the box to notice. You can scan the logs for any messages such as "out of swap space" or similar low-memory log messages.
@Mission-Ghost said in Repeating problem: (unbound), jid 0, uid 59, was killed: failed to reclaim memory:
Could using the Python module be a factor?
Very possible. There were some Python memory leak bugs in older versions of
unbound. Perhaps not all the bugs have been slain ???But I believe you need the Python Module enabled to fully utilize the DNSBL function (but I don't use that feature and thus am not an authority in this area).
-
@bmeeks said in Repeating problem: (unbound), jid 0, uid 59, was killed: failed to reclaim memory:
Perhaps not all the bugs have been slain ???
seems he is running 24.03 which should be running
start of service (unbound 1.19.3). <- at least on my 2100Zero memory leaks here, system will stay pretty flat lined with regards to memory use for weeks. (about the only time it really fluctuates is when I reboot - then it drops to zero - LOL) so almost never..
During this timeframe (past week shown) unbound has restarted exactly one time, due to one of the lists being updated for DNSBL the lists I use refresh every 3 / 4 days. That's when unbound will restart, but It is pretty stable. Other lists may / may not update more often.
Some settings to confirm.
Might be a fair question, even though @Mission-Ghost doesn't think it is related to pfblocker based on time stamps of events, but that we also ask for the version of pfblocker that is installed on the system?
I still also say - turn the service watchdog off.
-
@jrey said in Repeating problem: (unbound), jid 0, uid 59, was killed: failed to reclaim memory:
open the pfblockerng.log
Firewall -> pfBlockerNG -> Logs. (log type = Log Files, Log/file selection: pfblockerng.log)
scroll near the end of the file -- look for the section
pfSense Table Statslet us know what values you see below that heading.
there should be two lines
table-entries hard limit (with a value)
Table Usage Count (with a value)pfSense Table Stats
table-entries hard limit 400000
Table Usage Count 17743but your recent post suggests you don't think the issue it is related to pfBlockerNG based on timestamps..
Correct. pfBlocker updates about 3am, last crash I reported here was in the 5am and 2pm hours.
-
seems to be a recurring issue for you going back to 23.05 and 23.09?
So has the problem ever gone away?
https://forum.netgate.com/topic/184130/23-09-unbound-killed-failing-to-reclaim-memory
-
@Mission-Ghost said in Repeating problem: (unbound), jid 0, uid 59, was killed: failed to reclaim memory:
table-entries hard limit 400000
Table Usage Count 17743those don't look like a problem -- pretty small list
-
@bmeeks said in Repeating problem: (unbound), jid 0, uid 59, was killed: failed to reclaim memory:
@Mission-Ghost said in Repeating problem: (unbound), jid 0, uid 59, was killed: failed to reclaim memory:
^This suggests that servicewatchdog isn't typically jumping on the pfBlocker initiated restart. I would, I suspect, see this in the logs if it happened at the designated pfBlocker update time, which I do not.
Service Watchdog is a troubleshooting/workaround package. It was not designed to be a regular production feature. It simply periodically checks if the specified daemon is running, and restarts it immediately if it's not. With daemons that periodically either restart themselves, or are restarted by third-party packages, ignorance of such an automatic restart by Service Watchdog can result in it gumming up the works. That's why we suggest not running that package as a normal production feature.
I understand. But this instability causes random downtime that doesn't correct itself, so the tradeoff is worth it. Until unbound is stable, I need something to keep the dns and by extension the network running so I'm not always running to restart unbound and fielding complaints.
@Mission-Ghost said in Repeating problem: (unbound), jid 0, uid 59, was killed: failed to reclaim memory:
Memory usage is at about 65%, which is typical. Seeing higher is uncommon and I have never seen full memory usage. How can I find any other evidence of what free memory was at the times these process killings occurred to test the hypothesis that memory is filling up?
This will be a dynamic failure. That means you would need to be constantly watching the memory utilization on the box to notice. You can scan the logs for any messages such as "out of swap space" or similar low-memory log messages.
In the last 10,000 system/general log messages, which takes me back to mid-August, there are only the unbound messages previously reported here and the following which only appeared on August 31 in the middle of many unbound failed to reclaim memory error messages before and after:
solisten_clone: pcb 0xffffa000297dc000: New socket allocation failure: limit reached or out of memoryI'll highlight again the unbound error is about reclaiming memory, not failing to allocate or running out of memory.
@Mission-Ghost said in Repeating problem: (unbound), jid 0, uid 59, was killed: failed to reclaim memory:
Could using the Python module be a factor?
Very possible. There were some Python memory leak bugs in older versions of
unbound. Perhaps not all the bugs have been slain ???But I believe you need the Python Module enabled to fully utilize the DNSBL function (but I don't use that feature and thus am not an authority in this area).
I believe that's correct; I need Python Module to run pfBlocker.
-
@jrey said in Repeating problem: (unbound), jid 0, uid 59, was killed: failed to reclaim memory:
@bmeeks said in Repeating problem: (unbound), jid 0, uid 59, was killed: failed to reclaim memory:
Perhaps not all the bugs have been slain ???
seems he is running 24.03 which should be running
start of service (unbound 1.19.3). <- at least on my 2100Might be a fair question, even though @Mission-Ghost doesn't think it is related to pfblocker based on time stamps of events, but that we also ask for the version of pfblocker that is installed on the system?
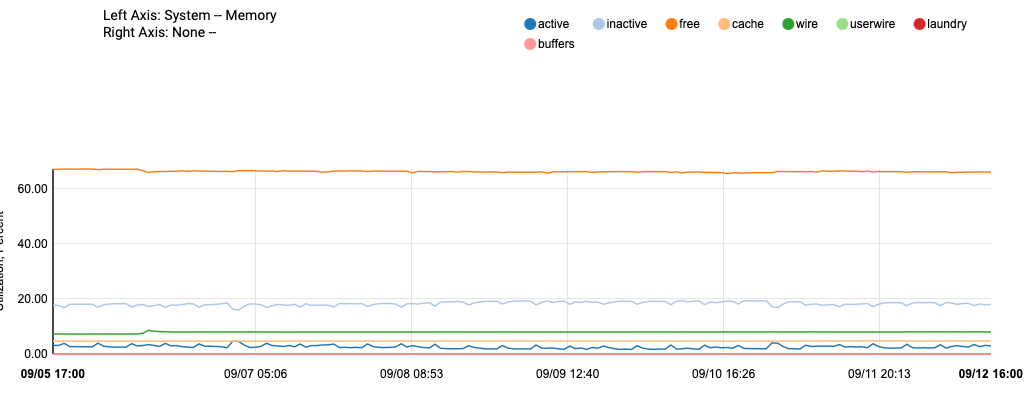
Here's my memory chart for the last month; uptime now is 28 days:
I still also say - turn the service watchdog off.
I'd love to...once this stops killing production at random times and requiring manual intervention.
-
@jrey said in Repeating problem: (unbound), jid 0, uid 59, was killed: failed to reclaim memory:
seems to be a recurring issue for you going back to 23.05 and 23.09?
So has the problem ever gone away?
https://forum.netgate.com/topic/184130/23-09-unbound-killed-failing-to-reclaim-memory
No. It ebbs and flows. It seemed better enough for a while that I turned off service watchdog and then it recurred killing the network, so I turned service watchdog back on. So I'm trying again to figure it out with this forum's generous help.
So, after my last post I have changed in unbound the following:
- memory cache size down from 10 to 4mb
- in and out tcp buffers down from 20 to 10
- EDNS buffer to default from automatic
We'll see if this has a material effect on the errors posting to the log and unbound being killed for failing to reclaim memory.
-
@Mission-Ghost said in Repeating problem: (unbound), jid 0, uid 59, was killed: failed to reclaim memory:
We'll see if this has a material effect on the errors posting to the log and unbound being killed for failing to reclaim memory.
Do not get confused by the unfortunate poor wording of the kernel's error message. The OOM killer is a kernel process that is launched to unconditionally terminate the largest consumer of user space memory in order to prevent the system from becoming unstable. It's the kernel saying "
unboundhas continued to consume more and more memory and has not returned any back to the system pool". The fault here is withunboundconsuming memory. It isunboundconsuming memory and never releasing it back to the system. -
@Mission-Ghost said in Repeating problem: (unbound), jid 0, uid 59, was killed: failed to reclaim memory:
The only Advanced check boxes I have in the DNS Resolver (unbound) are Prefetch Support and Keep Probing.
just for fun try to Turn off Prefetch support and restart unbound
-
@jrey said in Repeating problem: (unbound), jid 0, uid 59, was killed: failed to reclaim memory:
@Mission-Ghost said in Repeating problem: (unbound), jid 0, uid 59, was killed: failed to reclaim memory:
The only Advanced check boxes I have in the DNS Resolver (unbound) are Prefetch Support and Keep Probing.
just for fun try to Turn off Prefetch support and restart unbound
This was my first experiment. Unfortunately it was ineffective, so I turned it back on.
So far no failures following the changes I mentioned a couple of posts ago. I may return them to original values one at a time until a failure is noted so I can isolate the issue.
Someday a project to substantially improve the log messages to aid in end-user understanding of what is happening and proper recovery procedures would add tremendous value to the product.
-
@Mission-Ghost said in Repeating problem: (unbound), jid 0, uid 59, was killed: failed to reclaim memory:
This was my first experiment.
Ah sorry, I missed that. How long did it run then ?
I just mentioned it because it was mentioned in an earlier bug on NLnet Labs
(that should have been fixed by 1.19.3 (the version I am running, as should you on 24.03).Do you keep a log of your setting and the runtime you get from each test before it fails, it may or may not prove helpful in trying to find the answer if you don't.
although it is manifesting as a unbound memory error, I wouldn't rule out anything else reducing the available memory over time or running past something at a given point in time. You have established (by lack of matching event times) that when it occurs not being consistent with say pfBlockerNG, what about say mailreport?. I've never used it but if it is doing something that requires lookups when generating the reports,(again I don't know that it does) on a system with limited memory it might stretch to the point the unbound isn't releasing fast enough in a limited pool and it gets wacked because that is what the kernel sees as the "bad guy" at that time.
at a glance mailreport doesn't really say much about what it is reporting on (or what you are reporting on) saying only that:
"Allows you to setup periodic e-mail reports containing command output, and log file contents"huge spikes in memory likely wouldn't show on a 28 day memory graph with a 1 day resolution in the sample.
when it happens try a narrow the graph with less time and more frequent resolution and see what is going on, maybe something like an hour/with 1 minute resolution.
OR
Since the data is still there, you could use the custom feature of the graph and specify the time range and graph resolution from a previous time it gave up. again not to small time slice, but lean toward more time leading up to the logged event.
Again may or may not be helpful or give some clues.really just trying to see why unbound is the unwilling victim getting killed so randomly. It should run for days and days, weeks and weeks without this and only restart when something like pfBlocker tell it to restart (those restart events will be listed in the pfblockerng.log. as well as the resolver log On most system that restart is usually pretty quick and you wouldn't normally notice. (but one would also assume at that point in time unbound would flush everything during the restart. The service is stopping and starting. So any memory it had would/should be cleared at that time.
It is at that point in time (when unbound is restarting) that if things are a little sluggish the watchdog may see it down and try to start another or worse multiple copies. things will usually go really bad, really fast. I understand that you believe the watchdog is in your best interest, but it is really not, in this case. Still up to you how to proceed, of course.
Edit: if you looking for the restarts in pfblockerng.log they will look like this (but may not be there every time pfblocker runs as it only restarts when it has to (ie a list has changed) )
Saving DNSBL statistics... completed Reloading Unbound Resolver (DNSBL python) Stopping Unbound Resolver. Unbound stopped in 2 sec. Additional mounts (DNSBL python): No changes required. Starting Unbound Resolver... completed [ 09/13/24 14:15:09 ] -
Thank you for your thoughtful reply. It's interesting and gave me some things to think about.
@jrey said in Repeating problem: (unbound), jid 0, uid 59, was killed: failed to reclaim memory:
@Mission-Ghost said in Repeating problem: (unbound), jid 0, uid 59, was killed: failed to reclaim memory:
This was my first experiment.
Ah sorry, I missed that. How long did it run then ?
Just a day or two before the next event occurred.
Do you keep a log of your setting and the runtime you get from each test before it fails, it may or may not prove helpful in trying to find the answer if you don't.
No. I imagine it might be helpful.
although it is manifesting as a unbound memory error, I wouldn't rule out anything else reducing the available memory over time or running past something at a given point in time.
An interesting idea. Without logs or symptoms pointing specifically to an item it seems it would be a bit of a fishing expedition.
at a glance mailreport doesn't really say much about what it is reporting on (or what you are reporting on) saying only that:
"Allows you to setup periodic e-mail reports containing command output, and log file contents"I use mailreport to email the last several lines of some logs to myself once a day to keep tabs on possible problems without having to sign in every day and review logs in detail. It's how I flagged this problem.
really just trying to see why unbound is the unwilling victim getting killed so randomly. It should run for days and days, weeks and weeks without this and only restart when something like pfBlocker tell it to restart
Indeed, I have not had a failure event since I lowered the memory cache size, in/out buffers and edns buffer three days ago.
So far the evidence supports the hypothesis that while these higher settings didn't precipitate an unbound failure right away, it did allow it to grow at a later time outside of the resources available on the 1100. Clearly the 1100 can't support more than the default settings in at least a couple of areas. I previously had an update fail because I'd used non-default settings in another part of the system. It was tricky to diagnose.
It would be helpful to have some more discussion in the manuals that recommend against adjusting the defaults upward on an 1100 due to the limitations.
-
Do you use swap ?? If so you should have a crash report in the crash logs
-
@JonathanLee said in Repeating problem: (unbound), jid 0, uid 59, was killed: failed to reclaim memory:
Do you use swap ?? If so you should have a crash report in the crash logs
Best I can tell from documentation and forum posts is the 1100 does not have/use swap space.
-
@Mission-Ghost we you could always configure usb drive to be your swap
-
It's been a little over six days without an unbound related failure following my restoration of some advanced parameters to default values. However, unbound was killed last night by the kernel, again, for "failure to reclaim memory:"
Sep 20 23:44:01 	php-cgi 	55719 	servicewatchdog_cron.php: Service Watchdog detected service unbound stopped. Restarting unbound (DNS Resolver)
Sep 20 23:43:17 	kernel 		pid 24149 (unbound), jid 0, uid 59, was killed: failed to reclaim memory
No relationship to pfBlocker in the logs. pfBlocker did not restart at this time.
So reducing memory requirements via parameters a week ago helped, but did not completely resolve the problem.
So, I have now reduced the number of hosts to cache from 20,000 to 10,000 (the default) and increased unbound logging from level 1 to level 2 to see if I get any useful information from the unbound logs. At level 1 there are no unbound log messages prior to servicewatchdog restarting it...so it dies without a word. Only the system log offers a hint, shown earlier.
The system log message continues to suggest a memory leak or garbage collection failure and no error trapping for what is happening. Based on earlier comments, this issue does seem more specific to my 1100 than other models and pc or homebrew hardware.
I don't like having to run service watchdog, and, as other have suggested, it should not be necessary. But I like less having DNS go down randomly with few specific and actionable clues and kill production on the network in a way that requires my manual intervention at all hours of the day or night.
Where else should I look for better, relevant error messages that would more clearly diagnose what's going on?
-
@Mission-Ghost I am facing the same issue with a similar config (SG-1100 with pfblockerNG, but no watchdog - yet..., service restarts do not seem connected to pfblocker updating the block lists).
What I noticed today: Everything was fine until I logged in to the UI to check on uptime (had a separate issue in the past days). As soon as I logged in, unbound was killed with the same message in the logs you are seeing.
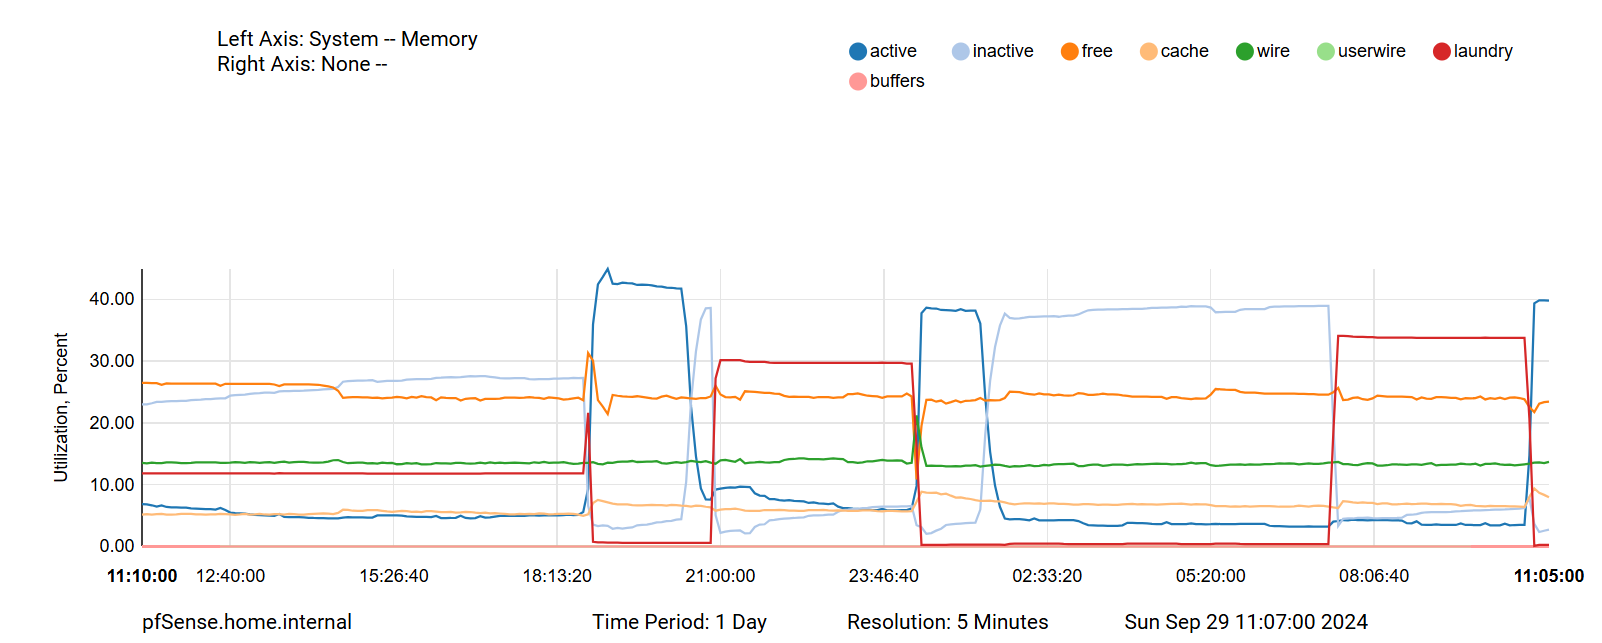
What I noticed when looking at the memory graph with a higher resolution is that right before unbound gets killed "laundry" was quite high - not sure what this could mean though (if at all)...

-
Still sounds like unbound is the unwilling victim.
What version are you running ?was quite high - not sure what this could mean though
Laundry
Queue for managing dirty inactive pages, which must be cleaned ("laundered") before they can be reused.
Managed by a separate thread, the laundry thread, instead of the page daemon
Laundry thread launders a small number of pages to balance the inactive and laundry queuesFrequency of laundering depends on:
How many clean pages the page daemon is freeing; more frees contributes to a higher frequency of laundering
The size of the laundry queue relative to the inactive queue; if the laundry queue is growing, we will launder more frequentlyPages are scanned by the laundry thread (starting from the head of the queue):
Pages which have been referenced are moved back to the active queue or the tail of the laundry queue
Dirty pages are laundered and then moved close to the head of the inactive queue--
Everything was fine until I logged in to the UI to check on uptime
https://forum.netgate.com/topic/177559/solved-23-01-r-20230202-1645-2500-mb-laundry
although this was a while ago -- and during an RC but
a) there are some diagnostics suggested in the thread. and;
b) it appears in that case laundry was impacted by the dashboard.
it doesn't say unbound died as a result, so the high "Laundry" may just be an artifact of the dashboard starting?You're using
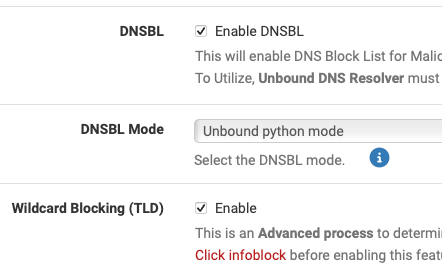
DNSBL Mode: Unbound python mode
right? (that would be the "less" memory consuming option