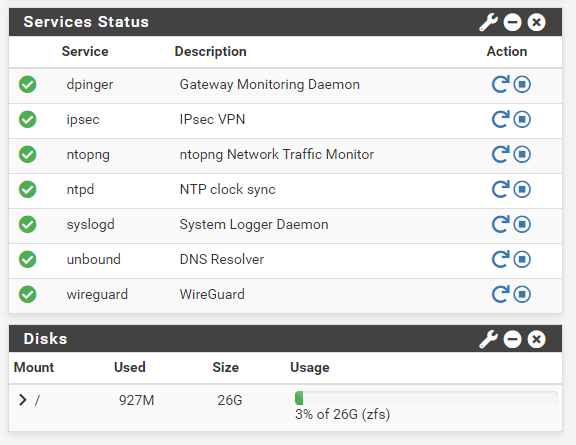
What uses storage space for pfsense?
-
@denitrosubmena Yeah, with your interface speeds its going to be expensive. For me the Embedded NtopNG Enterprise M for 149€ is enough as a Raspberry Pi 5 i just fine for my 1 Gbit needs.
-
@denitrosubmena Also - doing packet capture and analytics at 40 and 100Gbe speeds (like your interfaces), is going to require some potent hardware.
Not to mention you will have to license pfring ZC also. Otherwise there is no chance of NtopNG keeping up with those traffic speeds -
@keyser said in What uses storage space for pfsense?:
@denitrosubmena Also - doing packet capture and analytics at 40 and 100Gbe speeds (like your interfaces), is going to require some potent hardware.
Not to mention you will have to license pfring ZC also. Otherwise there is no chance of NtopNG keeping up with those traffic speedsyeah am not going to be pushing anything close to 10Gbps talk less 100Gbps
everyone, including just loves the idea of having 100G just for the hell of it :)
pushing 10G will be all i need for a while
nothing will be connected to the 100G just yet, probably wont even add the card to the pfsense yet. WAN and LAN will be at 10G
-
Logs. If you use a proxy package cache items also. Also boot environments if you have multiple of them each is a huge file.
-
@JonathanLee said in What uses storage space for pfsense?:
boot environments
what are those?
@JonathanLee said in What uses storage space for pfsense?:
Logs. If you use a proxy package cache items also
nopes, will not be using any proxy cache on pfsense
this will be in datacenter not homelab
firewall and router for servers -
@denitrosubmena if you’re rocking official Netgate gear you get multiple boot options for testing environments
-
there is one thing i am looking for and wanted to ask if you have some ideas
what i really want to have access to is the historical bandwidth usage but i want the graph that will show the proper real values and not log values
i know this is not just about bandwidth but with any graphs or utilization graphs
you usually have to zoom in to specific periods to see the closer to real values. For example a monthly usage view can have peak bandwidth at 10Mbps and then you zoom in and then you see peak is like 500Mbps during a short burst
is there a graphing tool that can either do this or both
#1. at least show me the real max and min values in the reporting data below the graphs even if not shown in the graph.
#2. show the real max and min values i dont care how ugly looking or jagged up the graph looks, i want that graphso if i cant get both then at least #1
this is to anyone else also, how can one view graphs without being converted to log format that hides real values. the graph then becomes almost useless as one always have to zoom in to have any say in validity
-
@denitrosubmena The problem is that most/any graphing tools that collects the data themselves does this smoothing of data (conversion of logvalues to graphing values) to save storage space.
Imagine this:You need to collect the bandwidthvalues every second - or faster - to actually get the peaks high/low values and so on. But that will take up a sizable chunk of storage to save every values years back in time. So all tools by default smooth that data into longer dataintervals over time - to save storage space.
To get what you want you will need either a montitoring tool that can you what you want - fx. Zabbix like i Suggested, og you need two tools. One that collects the data and saves ALL the second interval - fx. A SNMP monitoring tool with configurable storage policies.
Secondly you will need a visualization tool (fx. grafana) where you ask it to graph to values - but also makes fields with the higest and lowest values recorded.But I suggested Zabbix earlier on because it can do exactly what you are asking.
-
@keyser said in What uses storage space for pfsense?:
But I suggested Zabbix earlier on because it can do exactly what you are asking.
that is enough reason to get back to zabbix again then
you prefer zabbix to nagios?so will setup new zabbix instance and test out what i want and see how far i get
one other question, can one use ntop-ng with any firewall? like fortigate for example?
-
@denitrosubmena said in What uses storage space for pfsense?:
that is enough reason to get back to zabbix again then
you prefer zabbix to nagios?I prefer Zabbix, but for no other reason that it is the product I learned first/most about.
so will setup new zabbix instance and test out what i want and see how far i get
one other question, can one use ntop-ng with any firewall? like fortigate for example?
NtopNG is a standalone product when installed on another machine monitoring a Mirrorport in your switch. You can use it with whatever firewall product you like when setup like that.
In terms of installing it on the Firewall itself, it is not really recommended and it is only possible on pfSense/opnSense and any “selfmade” linux firewall you might setup.
