pfsense 2.7.2-RELEASE crashes several times a day
-
Backtrace:
db:0:kdb.enter.default>  bt
Tracing pid 43223 tid 100264 td 0xfffffe00af97f740
kdb_enter() at kdb_enter+0x32/frame 0xfffffe00ae1854d0
vpanic() at vpanic+0x163/frame 0xfffffe00ae185600
panic() at panic+0x43/frame 0xfffffe00ae185660
vm_fault() at vm_fault+0x15c5/frame 0xfffffe00ae185770
vm_fault_trap() at vm_fault_trap+0xb0/frame 0xfffffe00ae1857c0
trap_pfault() at trap_pfault+0x1d9/frame 0xfffffe00ae185820
calltrap() at calltrap+0x8/frame 0xfffffe00ae185820
--- trap 0xc, rip = 0xfffffe00ae185b60, rsp = 0xfffffe00ae1858f8, rbp = 0xfffff80005c7d740 ---
??() at 0xfffffe00ae185b60/frame 0xfffff80005c7d740
.L.str.22() at .L.str.22+0x1/frame 0xb7f2
Panic1:
Fatal trap 12: page fault while in kernel mode
cpuid = 2; apic id = 02
fault virtual address	= 0x0
fault code		= supervisor read data, page not present
instruction pointer	= 0x20:0xffffffff80dcd2df
stack pointer	        = 0x28:0xfffffe00ae171b60
frame pointer	        = 0x28:0xfffffe00ae171b60
code segment		= base 0x0, limit 0xfffff, type 0x1b
			= DPL 0, pres 1, long 1, def32 0, gran 1
processor eflags	= interrupt enabled, resume, IOPL = 0
current process		= 843 (sh)
rdi: fffff8000a6c5b58 rsi: 0000000000000001 rdx: 000000000000000d
rcx: fffff8000a5e3a80  r8: 0000000000000000  r9: 0000000307d96cb8
rax: 000000000000007f rbx: fffff8000a5e3a80 rbp: fffffe00ae171b60
r10: 0000000000000000 r11: 0000000000000000 r12: fffffe00af93b900
r13: 0000000000000001 r14: fffff8000596d000 r15: fffff8000a722cb0
trap number		= 12
panic: page fault
cpuid = 2
time = 1718885881
KDB: enter: panic
Panic2:
<6>pid 86703 (sh), jid 0, uid 0: exited on signal 11 (core dumped)
<6>pid 87613 (sh), jid 0, uid 0: exited on signal 11 (core dumped)


Fatal trap 9: general protection fault while in kernel mode
cpuid = 2; apic id = 02
instruction pointer	= 0x20:0xffffffff8128487c
stack pointer	        = 0x28:0xfffffe00ae1b3770
frame pointer	        = 0x28:0xfffffe00ae1b38c0
code segment		= base 0x0, limit 0xfffff, type 0x1b
			= DPL 0, pres 1, long 1, def32 0, gran 1
processor eflags	= interrupt enabled, resume, IOPL = 0
current process		= 8787 (sh)
rdi: fffff80001711600 rsi: 0010000000000008 rdx: fffffe00033f20c8
rcx: fffff801ee5718d0  r8: fffff801ee22f000  r9: 0000000000000111
rax: 0000000000000111 rbx: fffffffff0000000 rbp: fffffe00ae1b38c0
r10: fffff801ee2d35e8 r11: fffff801ee22f000 r12: 00000001ee2d3067
r13: fffffe001000ff80 r14: fffffe00033f2090 r15: 000000007fdea405
trap number		= 9
panic: general protection fault
cpuid = 2
time = 1718900423
KDB: enter: panic
Panic3:
<6>pid 28342 (grep), jid 0, uid 0: exited on signal 6 (core dumped)


Fatal trap 12: page fault while in kernel mode
cpuid = 2; apic id = 02
fault virtual address	= 0xa0
fault code		= supervisor read data, page not present
instruction pointer	= 0x20:0xffffffff81150557
stack pointer	        = 0x28:0xfffffe00b0e79c28
frame pointer	        = 0x28:0xfffffe00b0b92020
code segment		= base 0x0, limit 0xfffff, type 0x1b
			= DPL 0, pres 1, long 1, def32 0, gran 1
processor eflags	= interrupt enabled, resume, IOPL = 0
current process		= 25082 (grep)
rdi: fffff80220d80c60 rsi: 0000000000000000 rdx: 0000000000000000
rcx: 0000000000003210  r8: fffff8023f762300  r9: fffff8023f762300
rax: 0000000000000001 rbx: fffffe00b0b92020 rbp: fffffe00b0b92020
r10: 0000000007d74000 r11: 0000000007d73fff r12: fffffe00b02c80c0
r13: 0000000000000001 r14: fffff80220d80c60 r15: fffffe0086260000
trap number		= 12
panic: page fault
cpuid = 2
time = 1718917883
KDB: enter: panic
Panic4
Fatal trap 9: general protection fault while in kernel mode
cpuid = 3; apic id = 03
instruction pointer	= 0x20:0xffffffff80cc8299
stack pointer	        = 0x28:0xfffffe00ae18eea0
frame pointer	        = 0x28:0xfffffe00ae18eee0
code segment		= base 0x0, limit 0xfffff, type 0x1b
			= DPL 0, pres 1, long 1, def32 0, gran 1
processor eflags	= interrupt enabled, resume, IOPL = 0
current process		= 1014 (pgrep)
rdi: ffffffff83020980 rsi: 0000000000000000 rdx: 0000000000000004
rcx: 0010000000000000  r8: 0000000000000000  r9: fffffe00ae18f200
rax: 0000000000000010 rbx: fffffe00ae18f200 rbp: fffffe00ae18eee0
r10: 0000000000000000 r11: fffffe00afbfac40 r12: fffffe00afbfa720
r13: 0000000000000000 r14: fffffe0011955ae0 r15: ffffffff83020980
trap number		= 9
panic: general protection fault
cpuid = 3
time = 1718917930
KDB: enter: panic
---<<BOOT>>---
Panic5:
panic: vm_fault_lookup: fault on nofault entry, addr: 0xfffffe00b0739000
cpuid = 3
time = 1718920720
KDB: enter: panic
Panic6:
panic: vm_fault_lookup: fault on nofault entry, addr: 0xfffffe00ae185000
cpuid = 3
time = 1718920799
KDB: enter: panic
Unfortunately we only have the backtrace from the most recent panic and it's not very helpful.
Do you have other crash reports to compare?Potentially it could be bad RAM, but that's not clear.
Do you have anything custom running?
Steve
-
@stephenw10
Hi, Steve!
Thanks a lot for the reply.
I have attached a fresh dump.
textdump.tar.0
info.0When the frequent reboots started, the first thing I did was replace the RAM module. The problem did not go away, the system continued to reboot in the same way. Nothing has changed.
The following packages are installed in the system:
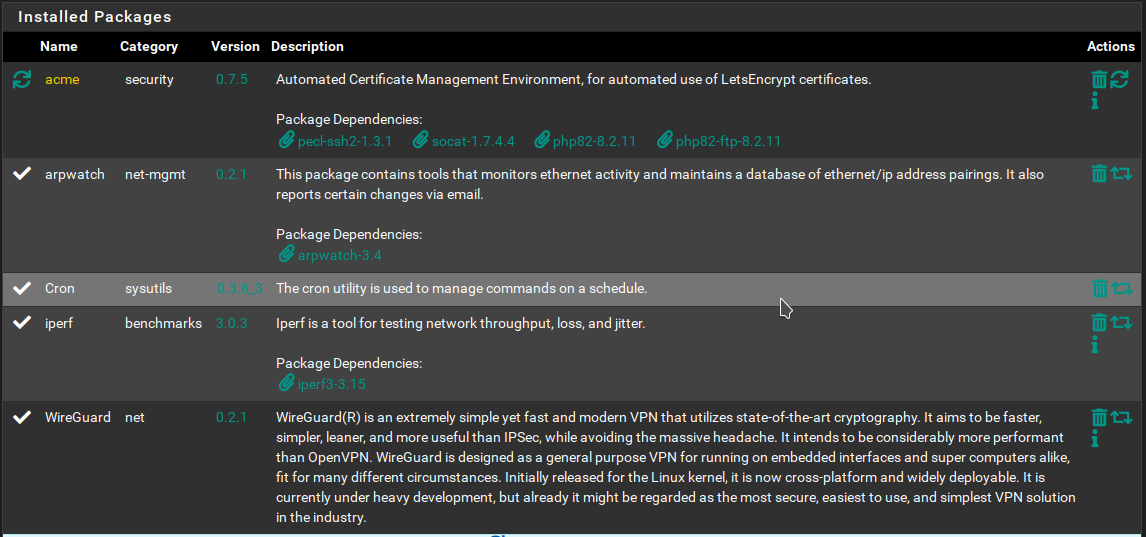
Packages only, there is nothing homemade.
The Cron, acme and iperf packages have just been installed, but are not in use yet. WireGuard is actively used. -
@wesselloff said in pfsense 2.7.2-RELEASE crashes several times a day:
Packages only, there is nothing homemade.
Except for one (arpwatch), none are up to date, not only 'acme'.
What pfSense version are you using ?edit : ah, ok, 2.7.2.
If possible, install pfSense on another device - or a VM, for a while.
This will pin point hardware- or not - issues straight away. -
@Gertjan
thanks for the reply.
I plan to move the SSD to another similar computer next weekend and look at further behavior.
In my opinion, it is impractical to install on a virtual machine, because I will not be able to create working conditions similar to the current home network. -
Hmm, unfortunately that's still pretty generic:
db:0:kdb.enter.default>  bt
Tracing pid 42874 tid 101438 td 0xfffffe00b04b3560
kdb_enter() at kdb_enter+0x32/frame 0xfffffe00b070c4d0
vpanic() at vpanic+0x163/frame 0xfffffe00b070c600
panic() at panic+0x43/frame 0xfffffe00b070c660
trap_fatal() at trap_fatal+0x40c/frame 0xfffffe00b070c6c0
trap_pfault() at trap_pfault+0x4f/frame 0xfffffe00b070c720
calltrap() at calltrap+0x8/frame 0xfffffe00b070c720
--- trap 0xc, rip = 0x7ffffffff, rsp = 0xfffffe00b070c7f0, rbp = 0xfffff80005dbb458 ---
??() at 0x7ffffffff/frame 0xfffff80005dbb458
??() at 0xfffff80001db0800
Some of those earlier panics looked more interesting so you might get lucky(er).
The panics are all in different processes which makes it much more difficult to diagnose.
-
Hello everyone.
The router rebooted 5 times that night. Right now I can't connect to it either via ssh or via the web interface. ssh just hangs, the web interface outputs "504 Gateway Time-out".
At the same time, the network is working fine, there is access to both the Internet and resources inside the home network.
We'll have to reboot it on power. After the reboot, I will attach a dump.Upd.
Hmm, there are no dumps.
What was it at night then? The electricity was definitely not lost.Upd2
Oh, there's just been a crash and a reboot.
The dump appeared.
textdump.tar.0
info.0 -
Hmm, backtrace still very generic:
db:0:kdb.enter.default>  bt
Tracing pid 47703 tid 100289 td 0xfffffe00b00c7ac0
kdb_enter() at kdb_enter+0x32/frame 0xfffffe00ae1ea830
vpanic() at vpanic+0x163/frame 0xfffffe00ae1ea960
panic() at panic+0x43/frame 0xfffffe00ae1ea9c0
vm_fault() at vm_fault+0x15c5/frame 0xfffffe00ae1eaad0
vm_fault_trap() at vm_fault_trap+0xb0/frame 0xfffffe00ae1eab20
trap_pfault() at trap_pfault+0x1d9/frame 0xfffffe00ae1eab80
calltrap() at calltrap+0x8/frame 0xfffffe00ae1eab80
--- trap 0xc, rip = 0xfffffe00ae1ead60, rsp = 0xfffffe00ae1eac58, rbp = 0x1 ---
??() at 0xfffffe00ae1ead60/frame 0x1
We do see the igb1 NIC going up and down repeatedly there but that shouldn't be an issue.
There are no timestamps on the message buffer, what is the timing here? How long after it boots does it panic?
Or is the NIC changing link immediately before the panic?
I would probably try disabling one or more services as a test at this point. It's likely some package is triggering this.
-
@stephenw10
I unplugged the cable from igb1. This is a backup Internet provider. Nothing has changed, reboots again.
What can be turned off for testing?
textdump.tar.0
info.0 -
Try disabling wireguard if you can. That appears close to last in all the logs and the processes in the panic could well be from the wireguard scripts. But that's a guess!
-
Hello everyone
In general, the cause of the problems was a physical malfunction of the computer.
I had a second computer that was completely identical to the problem one. I installed pfSense on it from scratch and transferred all the settings to it manually. I haven't installed any additional packages yet. Since then, there has not been a single unplanned reboot, the system is completely stable. It's been over two months. I plan to reinstall the necessary packages in the near future and continue monitoring.After transferring the system to a new computer, I decided to experiment with the old one.
To begin with, I decided to completely reinstall pfSense with SSD formatting. I booted from the LiveCD and started the installation. I didn't even have time to rebuild the disk, as I received an error and a reboot. I thought that the SSD was faulty (although his SMART is fine), I replaced it with another one. The error was repeated. That is, it's not about the disk or RAM, because I changed it earlier. But in the end, after 3-4 attempts, pfSense was still installed. But after standing on for a while, the computer spontaneously rebooted. Then again and again. No settings have been made yet.
Next, I decided to try installing Windows 10 on my computer to test it. The installation freezes completely after the first step.
As a result, the ideas ran out, the computer was turned off and put away. Maybe I'll throw it away later.Thank you all so much for your help!