Repeating problem: (unbound), jid 0, uid 59, was killed: failed to reclaim memory
-
@Mission-Ghost said in Repeating problem: (unbound), jid 0, uid 59, was killed: failed to reclaim memory:
This was my first experiment.
Ah sorry, I missed that. How long did it run then ?
I just mentioned it because it was mentioned in an earlier bug on NLnet Labs
(that should have been fixed by 1.19.3 (the version I am running, as should you on 24.03).Do you keep a log of your setting and the runtime you get from each test before it fails, it may or may not prove helpful in trying to find the answer if you don't.
although it is manifesting as a unbound memory error, I wouldn't rule out anything else reducing the available memory over time or running past something at a given point in time. You have established (by lack of matching event times) that when it occurs not being consistent with say pfBlockerNG, what about say mailreport?. I've never used it but if it is doing something that requires lookups when generating the reports,(again I don't know that it does) on a system with limited memory it might stretch to the point the unbound isn't releasing fast enough in a limited pool and it gets wacked because that is what the kernel sees as the "bad guy" at that time.
at a glance mailreport doesn't really say much about what it is reporting on (or what you are reporting on) saying only that:
"Allows you to setup periodic e-mail reports containing command output, and log file contents"huge spikes in memory likely wouldn't show on a 28 day memory graph with a 1 day resolution in the sample.
when it happens try a narrow the graph with less time and more frequent resolution and see what is going on, maybe something like an hour/with 1 minute resolution.
OR
Since the data is still there, you could use the custom feature of the graph and specify the time range and graph resolution from a previous time it gave up. again not to small time slice, but lean toward more time leading up to the logged event.
Again may or may not be helpful or give some clues.really just trying to see why unbound is the unwilling victim getting killed so randomly. It should run for days and days, weeks and weeks without this and only restart when something like pfBlocker tell it to restart (those restart events will be listed in the pfblockerng.log. as well as the resolver log On most system that restart is usually pretty quick and you wouldn't normally notice. (but one would also assume at that point in time unbound would flush everything during the restart. The service is stopping and starting. So any memory it had would/should be cleared at that time.
It is at that point in time (when unbound is restarting) that if things are a little sluggish the watchdog may see it down and try to start another or worse multiple copies. things will usually go really bad, really fast. I understand that you believe the watchdog is in your best interest, but it is really not, in this case. Still up to you how to proceed, of course.
Edit: if you looking for the restarts in pfblockerng.log they will look like this (but may not be there every time pfblocker runs as it only restarts when it has to (ie a list has changed) )
Saving DNSBL statistics... completed Reloading Unbound Resolver (DNSBL python) Stopping Unbound Resolver. Unbound stopped in 2 sec. Additional mounts (DNSBL python): No changes required. Starting Unbound Resolver... completed [ 09/13/24 14:15:09 ] -
Thank you for your thoughtful reply. It's interesting and gave me some things to think about.
@jrey said in Repeating problem: (unbound), jid 0, uid 59, was killed: failed to reclaim memory:
@Mission-Ghost said in Repeating problem: (unbound), jid 0, uid 59, was killed: failed to reclaim memory:
This was my first experiment.
Ah sorry, I missed that. How long did it run then ?
Just a day or two before the next event occurred.
Do you keep a log of your setting and the runtime you get from each test before it fails, it may or may not prove helpful in trying to find the answer if you don't.
No. I imagine it might be helpful.
although it is manifesting as a unbound memory error, I wouldn't rule out anything else reducing the available memory over time or running past something at a given point in time.
An interesting idea. Without logs or symptoms pointing specifically to an item it seems it would be a bit of a fishing expedition.
at a glance mailreport doesn't really say much about what it is reporting on (or what you are reporting on) saying only that:
"Allows you to setup periodic e-mail reports containing command output, and log file contents"I use mailreport to email the last several lines of some logs to myself once a day to keep tabs on possible problems without having to sign in every day and review logs in detail. It's how I flagged this problem.
really just trying to see why unbound is the unwilling victim getting killed so randomly. It should run for days and days, weeks and weeks without this and only restart when something like pfBlocker tell it to restart
Indeed, I have not had a failure event since I lowered the memory cache size, in/out buffers and edns buffer three days ago.
So far the evidence supports the hypothesis that while these higher settings didn't precipitate an unbound failure right away, it did allow it to grow at a later time outside of the resources available on the 1100. Clearly the 1100 can't support more than the default settings in at least a couple of areas. I previously had an update fail because I'd used non-default settings in another part of the system. It was tricky to diagnose.
It would be helpful to have some more discussion in the manuals that recommend against adjusting the defaults upward on an 1100 due to the limitations.
-
Do you use swap ?? If so you should have a crash report in the crash logs
-
@JonathanLee said in Repeating problem: (unbound), jid 0, uid 59, was killed: failed to reclaim memory:
Do you use swap ?? If so you should have a crash report in the crash logs
Best I can tell from documentation and forum posts is the 1100 does not have/use swap space.
-
@Mission-Ghost we you could always configure usb drive to be your swap
-
It's been a little over six days without an unbound related failure following my restoration of some advanced parameters to default values. However, unbound was killed last night by the kernel, again, for "failure to reclaim memory:"
Sep 20 23:44:01 	php-cgi 	55719 	servicewatchdog_cron.php: Service Watchdog detected service unbound stopped. Restarting unbound (DNS Resolver)
Sep 20 23:43:17 	kernel 		pid 24149 (unbound), jid 0, uid 59, was killed: failed to reclaim memory
No relationship to pfBlocker in the logs. pfBlocker did not restart at this time.
So reducing memory requirements via parameters a week ago helped, but did not completely resolve the problem.
So, I have now reduced the number of hosts to cache from 20,000 to 10,000 (the default) and increased unbound logging from level 1 to level 2 to see if I get any useful information from the unbound logs. At level 1 there are no unbound log messages prior to servicewatchdog restarting it...so it dies without a word. Only the system log offers a hint, shown earlier.
The system log message continues to suggest a memory leak or garbage collection failure and no error trapping for what is happening. Based on earlier comments, this issue does seem more specific to my 1100 than other models and pc or homebrew hardware.
I don't like having to run service watchdog, and, as other have suggested, it should not be necessary. But I like less having DNS go down randomly with few specific and actionable clues and kill production on the network in a way that requires my manual intervention at all hours of the day or night.
Where else should I look for better, relevant error messages that would more clearly diagnose what's going on?
-
@Mission-Ghost I am facing the same issue with a similar config (SG-1100 with pfblockerNG, but no watchdog - yet..., service restarts do not seem connected to pfblocker updating the block lists).
What I noticed today: Everything was fine until I logged in to the UI to check on uptime (had a separate issue in the past days). As soon as I logged in, unbound was killed with the same message in the logs you are seeing.
What I noticed when looking at the memory graph with a higher resolution is that right before unbound gets killed "laundry" was quite high - not sure what this could mean though (if at all)...

-
Still sounds like unbound is the unwilling victim.
What version are you running ?was quite high - not sure what this could mean though
Laundry
Queue for managing dirty inactive pages, which must be cleaned ("laundered") before they can be reused.
Managed by a separate thread, the laundry thread, instead of the page daemon
Laundry thread launders a small number of pages to balance the inactive and laundry queuesFrequency of laundering depends on:
How many clean pages the page daemon is freeing; more frees contributes to a higher frequency of laundering
The size of the laundry queue relative to the inactive queue; if the laundry queue is growing, we will launder more frequentlyPages are scanned by the laundry thread (starting from the head of the queue):
Pages which have been referenced are moved back to the active queue or the tail of the laundry queue
Dirty pages are laundered and then moved close to the head of the inactive queue--
Everything was fine until I logged in to the UI to check on uptime
https://forum.netgate.com/topic/177559/solved-23-01-r-20230202-1645-2500-mb-laundry
although this was a while ago -- and during an RC but
a) there are some diagnostics suggested in the thread. and;
b) it appears in that case laundry was impacted by the dashboard.
it doesn't say unbound died as a result, so the high "Laundry" may just be an artifact of the dashboard starting?You're using
DNSBL Mode: Unbound python mode
right? (that would be the "less" memory consuming option -
@jrey I am using 24.03 like the OP and the unbound python mode.
Regarding the diagnostics I am not sure what to look for - especially since right now everything is fine again. I looked at memory consumption and right now unbound is at the top followed closely by php/nginx.
As for the OP it happens sporadically - everything sounds pretty similar.
-
@Pizzamaka said in Repeating problem: (unbound), jid 0, uid 59, was killed: failed to reclaim memory:
everything sounds pretty similar.
it does
I think the suggestion on the other thread is to run the command with the sort option and see which process is increasing memory usage .
-
It's now been eight days since I reduced the number of hosts to cache from 20,000 to 10,000. I have not had an unbound processed killed in this time period.
So far, it appears this change has helped.
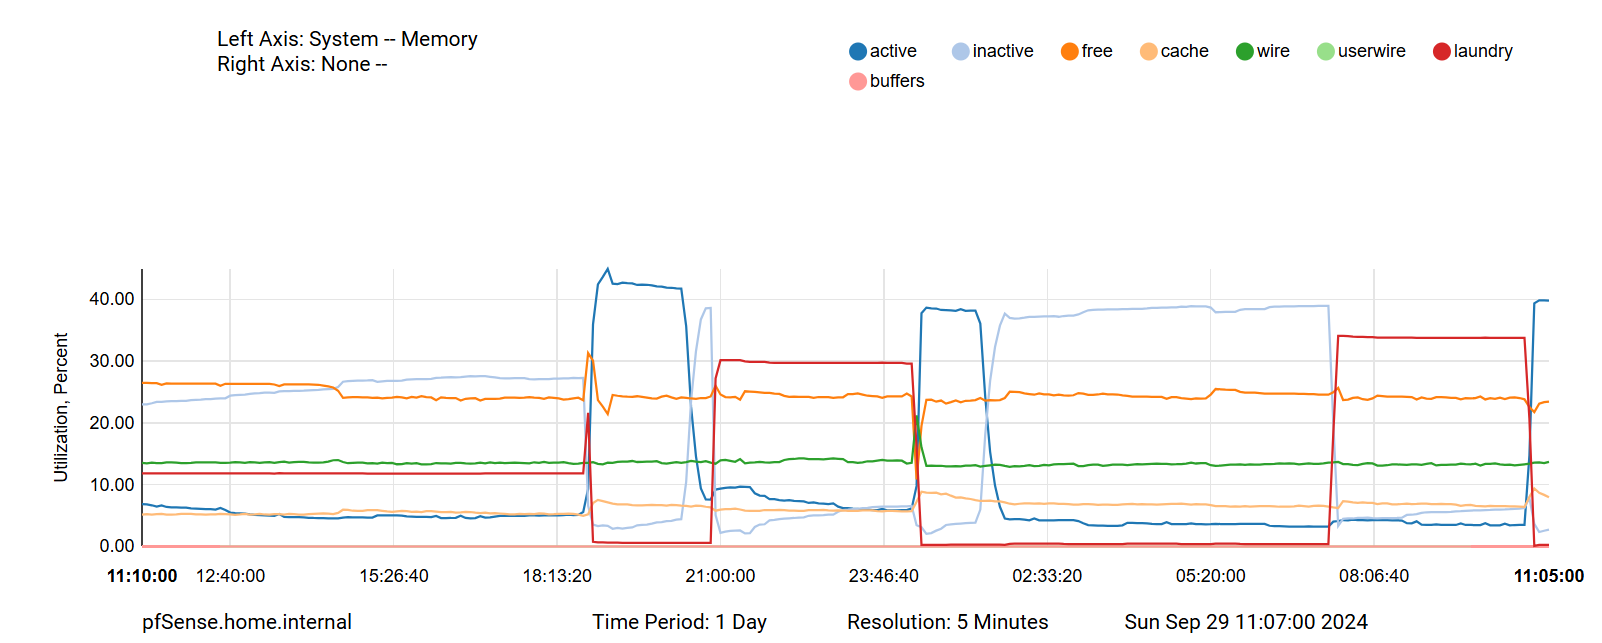
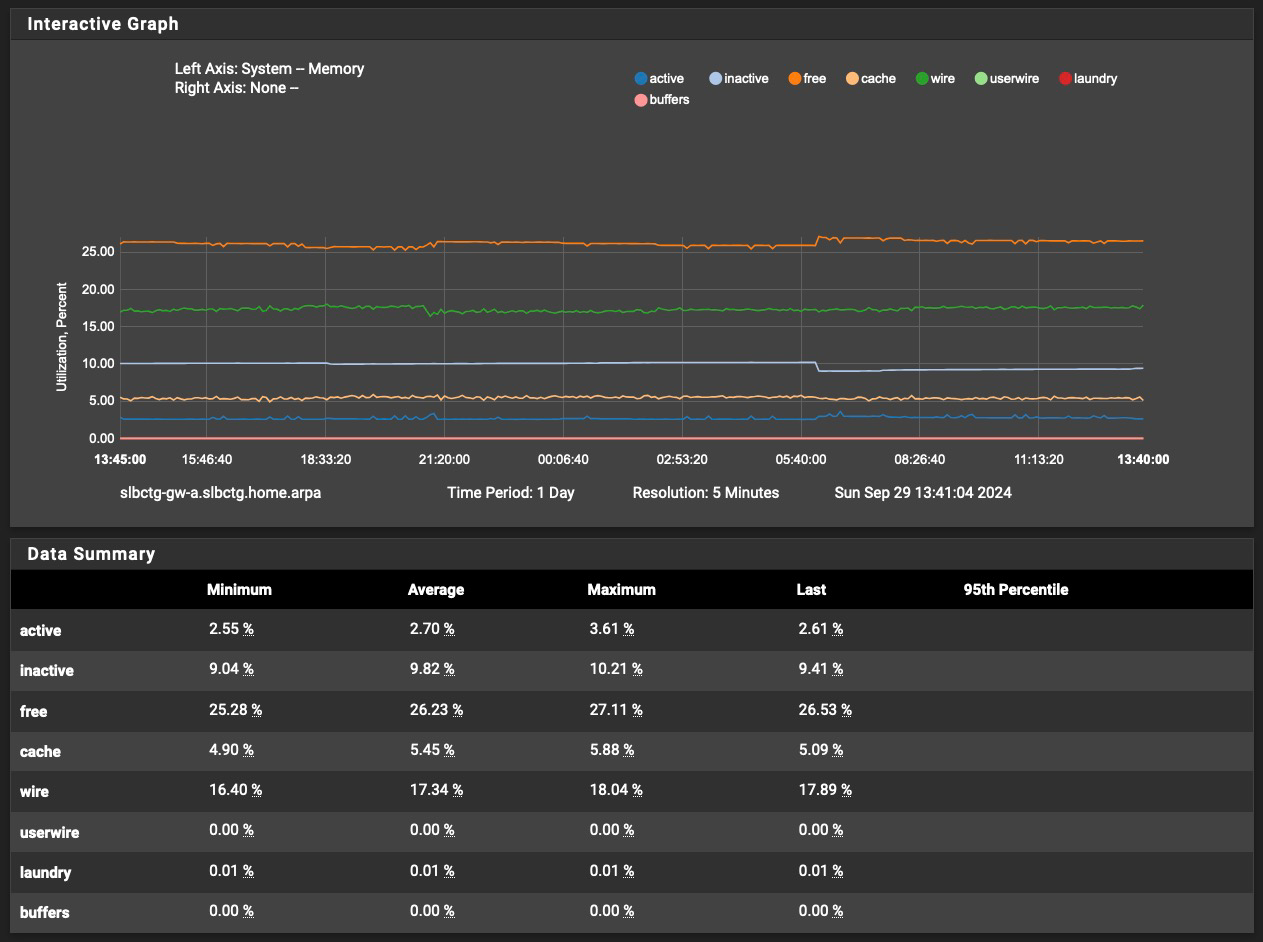
With respect to later posts, my 1100's memory usage over the last eight days looks like this:
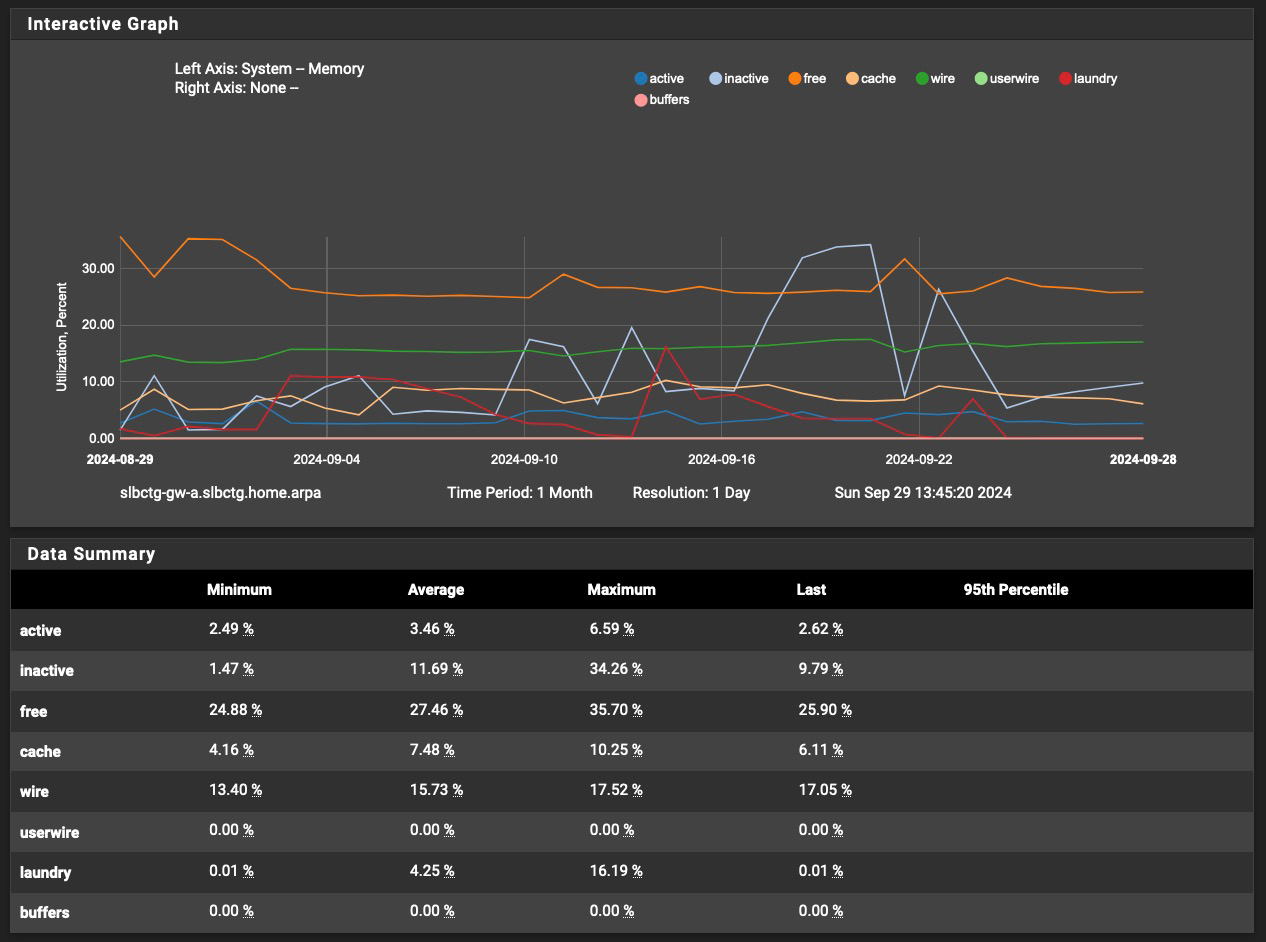
Over the last month, it has looked like this:
Best as I can tell this issue is a combination of a number of factors, as none of the previous changes seemed to fully prevent the issue. Changes prior to the number of hosts to cache change increased the time period between failures, but didn't solve the problem.
I'll check in after a while longer to report whether unbound has failed (been killed) again or if the up-time trend continues.
Thank you to everyone for your comments and input. I still think there's a pointer or garbage collection related issue indicated. Maybe NG feels there isn't a need to fix this given the upcoming changes to the DNS server infrastructure...?
-
Something interesting I found that I cannot assess due to lack of knowledge. Here it says that changing the blackhole behaviour of unbound (in our case probably a pfblockerNG setting) reduced memory usage of unbound from ~400MD to 60MB.
does this sound reasonable? -
@Pizzamaka said in Repeating problem: (unbound), jid 0, uid 59, was killed: failed to reclaim memory:
Something interesting I found that I cannot assess due to lack of knowledge. Here it says that changing the blackhole behaviour of unbound (in our case probably a pfblockerNG setting) reduced memory usage of unbound from ~400MD to 60MB.
does this sound reasonable?I'm no expert either, but this makes some sense. There is a black-hole web site in pfBlocker, which has never worked on my system.
That web server and what-have-you has to use some memory of course, so shutting it off, especially when it adds no value to me, doesn't seem like it should hurt.
I'll try to report back. Still no more crashes now nine days since the last change to my SG-1100 pfSense unbound parameters.
-
Since reducing number hosts to cache in unbound from 20,000 to 10,000 on September 23, 2024 (in addition to other setting changes I made earlier which did not fully address the problem), I have had no more unbound killed events.
I did not try changing pfBlocker parameters, since it's stable now and I didn't want to confound the results of the number hosts change experiment.
If I get another unbound killed event I'll report back. Otherwise, it seems the above discussed changes have helped significantly reduce or eliminate the issue on the SG-1100.
It would be helpful if parameters could either be constrained by product model or memory size or otherwise to prevent making settings that can cause failures. This, plus well written error messages that follow a solid design convention would be a significant product improvement.
Thanks again to all who chimed in on this frustrating issue. You were very helpful.
-
I totally agree on the meaningful error messages. I also wonder if there shouldn't be a mechanism to restart a critical service intelligently (since as I learned above, watchdog is not intelligent enough).
Another thing you might want to try @Mission-Ghost is to update pfBlockerNG. I learned that packages do not auto-update. When looking at the package list (now a widget on my dashboard) it allowed to start an update.