CPU load in pfsense cause by regex
-
@khouloud said in CPU load in pfsense cause by regex:
this is in the updaterrd.sh causing the CPU load
Run this to determine what is being 'egrepped' :
/sbin/pfctl -siFor me, this is just a couple of lines and shows general firewall stats
This one :
/sbin/pfctl -ss( I used "/sbin/pfctl -ss | wc -l" to count the lines)
return env 800 lines, afaik, all the states in the firewall.
How many lines do you have ?So, I see two possibilities why you see an error :
For you, and you only, "/sbin/pfctl -si" or "/sbin/pfctl -ss" outputs something that makes the egrep ... choke.
Or : your firewall has so many states that egrep 'overloads' ...@khouloud said in CPU load in pfsense cause by regex:
Can we do somethings to reduce the CPU load?
If its an overload question : get a bigger CPU ^^
If it isn't that, then show the output of "/sbin/pfctl -ss" so some one can see where it chokes. -
@Gertjan Hey i just disabled it the RDD graph from the GUI and it reduced a little bit the CPU.
-
Disabling all monitoring will completely disable this script :

if this has as a result like :
it reduced a little bit the CPU
then, imho, the issue isn't the monitoring script "/var/db/rrd/updaterrd.sh", it's something else that loads the system. What are we talking about here, what do you use ?
Can you give a brief description ?Run top again to see what is eating up all CPU resources, knowing that it won't be /var/db/rrd/updaterrd.sh
-
@Gertjan the load from this regex is disappeared and now I have load from my network I/O due to much traffic
last pid: 26893; load averages: 2.50, 2.48, 2.44 up 336+14:40:02 12:46:24
336 threads: 7 running, 287 sleeping, 42 waiting
CPU: 0.2% user, 0.0% nice, 69.5% system, 0.0% interrupt, 30.3% idle
Mem: 35M Active, 1941M Inact, 2477M Wired, 3395M Free
ARC: 1267M Total, 277M MFU, 894M MRU, 1304K Anon, 12M Header, 82M Other
1077M Compressed, 2246M Uncompressed, 2.08:1 Ratio
Swap: 1024M Total, 1024M FreePID USERNAME PRI NICE SIZE RES STATE C TIME WCPU COMMAND
0 root -60 - 0B 1664K - 2 313.9H 77.53% [kernel{if_io_tqg_2}]
0 root -60 - 0B 1664K CPU3 3 318.0H 70.88% [kernel{if_io_tqg_3}]
0 root -60 - 0B 1664K CPU0 0 314.4H 60.83% [kernel{if_io_tqg_0}]
0 root -60 - 0B 1664K - 1 314.0H 53.69% [kernel{if_io_tqg_1}]
11 root 187 ki31 0B 64K RUN 1 7423.1 45.30% [idle{idle: cpu1}]
11 root 187 ki31 0B 64K RUN 0 7567.3 31.93% [idle{idle: cpu0}]
11 root 187 ki31 0B 64K CPU3 3 7419.9 28.30% [idle{idle: cpu3}]
11 root 187 ki31 0B 64K CPU2 2 7419.9 22.00% [idle{idle: cpu2}]
0 root -64 - 0B 1664K - 0 485.3H 6.42% [kernel{e6000sw0 taskq}] -
@khouloud said in CPU load in pfsense cause by regex:
last pid: 26893; load averages: 2.50, 2.48, 2.44 up 336+14:40:02 12:46:24
336 threads: 7 running, 287 sleeping, 42 waiting"2.50, 2.48, 2.44" is huge.
"336 threads" is 3,5 times more as I have on my Netgate 4100.
Detail your setup please.
-
@Gertjan Yes. Wich detail do you need exactly?
-
Something like "I use a 2010 based i386 based intel device with 1Gbytes of RAM, many LANs, hundreds of LAN devices, all of them open thousands of connections, and all pfSense packages installed and activated".
Then I would say : "Everything is fine then" ;)
-
What pfSense version is this?
We have been looking at a loading issue similar to this in the new kea2unbound function in 24.08 snapshots.
-
@stephenw10 @Gertjan the firewall System is Netgate 7100
version: 24.03-RELEASE (amd64)
CPU: Intel(R) Atom(TM) CPU C3558 @ 2.20GHz
4 CPUs : 1 package(s) x 4 core(s)
and I have a big infrastructure that maybe this is the reason of the load. -
the Ram is 8 GB
-
Did the ps output show anything more than just the egrep called by rrdupdate? Like what part of that actually called it?
-
@stephenw10
this is the resultUSER PID %CPU %MEM VSZ RSS TT STAT STARTED TIME COMMAND root 0 222.6 0.0 0 1664 - DLs 7Nov23 105560:16.48 [kernel] root 11 154.3 0.0 0 64 - RNL 7Nov23 1790158:20.32 - [idle] root 7 0.9 0.0 0 16 - DL 7Nov23 695:03.24 - [pf purge] root 1 0.0 0.0 11352 1228 - ILs 7Nov23 0:00.24 - /sbin/init root 1625 0.0 0.4 110328 32432 - Ss 7Nov23 11:18.69 |-- php-fpm: master process (/usr/local/lib/php-fpm.conf) (php-fpm) root 5056 8.8 7.3 773308 609808 - S 25Sep24 8:48.22 | |-- php-fpm: pool nginx (php-fpm) root 68894 0.0 0.0 5128 2612 - R 16:06 0:00.00 | | `-- [sh]and the CPU load after disabling RRd it reduced 20% of the amount of CPU then it should be the one who was consuming the cpu
-
@khouloud said in CPU load in pfsense cause by regex:
root 0 222.6 0.0 0 1664 - DLs 7Nov23 105560:16.48 [kernel]
root 11 154.3 0.0 0 64 - RNL 7Nov23 1790158:20.32 - [idle]
root 7 0.9 0.0 0 16 - DL 7Nov23 695:03.24 - [pf purge]
root 1 0.0 0.0 11352 1228 - ILs 7Nov23 0:00.24 - /sbin/init
root 1625 0.0 0.4 110328 32432 - Ss 7Nov23 11:18.69 |-- php-fpm: master process (/usr/local/lib/php-fpm.conf) (php-fpm)
root 5056 8.8 7.3 773308 609808 - S 25Sep24 8:48.22 | |-- php-fpm: pool nginx (php-fpm)
root 68894 0.0 0.0 5128 2612 - R 16:06 0:00.00 | | `-- [sh]ahrd to read ...
Use :
so things becomes way more readable :
[24.03-RELEASE][root@pfSense.bhf.tld]/root: ps -auxwwd
USER      PID  %CPU %MEM    VSZ    RSS TT  STAT STARTED        TIME COMMAND
root        0   0.0  0.0      0   1312  -  DLs  24Sep24   244:14.24 [kernel]
root       11 198.9  0.0      0     32  -  RNL  24Sep24 41066:28.47 - [idle]
root        1   0.0  0.0  11344   1220  -  ILs  24Sep24     0:00.46 - /sbin/init
unbound 54544   0.4  3.8 185892 154088  -  Ss   00:15      12:40.44 |-- /usr/local/sbin/unbound -c /var/unbound/unbound.conf
root      573   0.0  0.8 110112  32720  -  Ss   24Sep24     0:31.72 |-- php-fpm: master process (/usr/local/lib/php-fpm.conf) (php-fpm)
root     1606   0.0  2.5 158668 100040  -  I    Tue08       5:40.50 | |-- php-fpm: pool nginx (php-fpm)
root    12087   0.0  2.5 162764  99576  -  I    Mon13       6:31.22 | |-- php-fpm: pool nginx (php-fpm)
root    28210   0.0  2.4 158668  97860  -  I    Mon12       7:34.59 | |-- php-fpm: pool nginx (php-fpm)
root    34768   0.0  2.5 158668  99548  -  I    Mon12       7:48.36 | |-- php-fpm: pool nginx (php-fpm)
root    38507   0.0  2.5 158668  99256  -  I    Mon08       9:43.96 | |-- php-fpm: pool nginx (php-fpm)
root    60206   0.0  2.5 158604  99232  -  I    Mon13       6:51.04 | |-- php-fpm: pool nginx (php-fpm)
root    98309   0.0  2.4 166860  98824  -  I    Mon09       8:21.45 | `-- php-fpm: pool nginx (php-fpm)
root      676   0.0  0.1  13232   2928  -  INs  24Sep24     0:00.12 |-- /usr/local/sbin/check_reload_status
edit : Ok, coll, you figured it out

or use top (install htop ^^) and I sorted on "CPU Load":
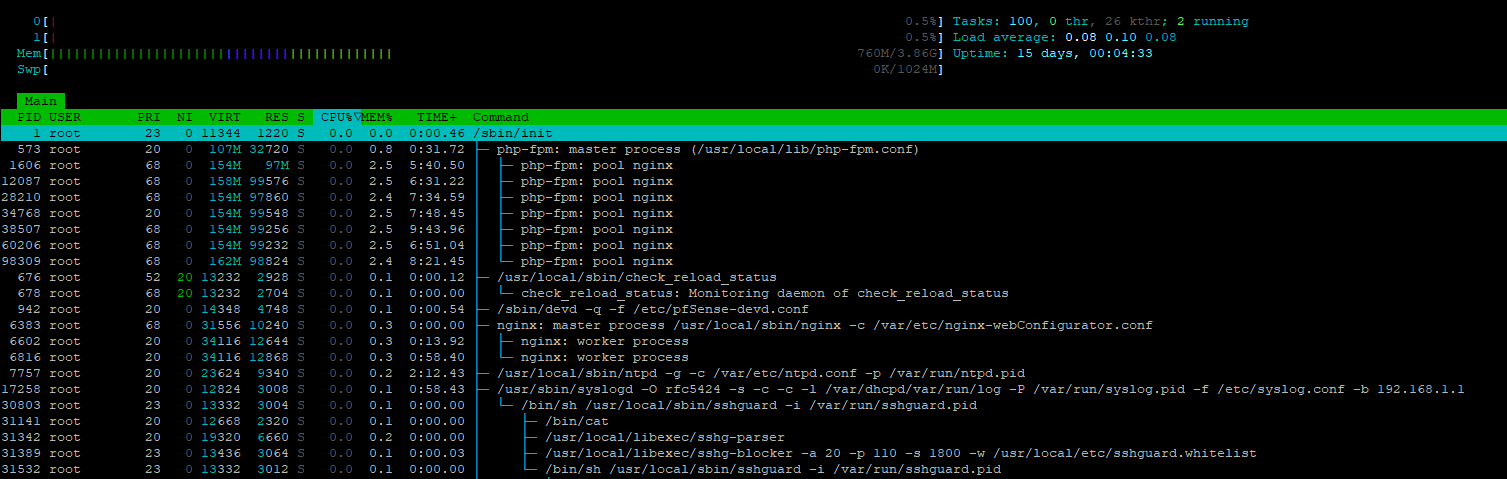
edit : you have a "7100". That's not a small system.
No ntopng/bandwidthd/suricata or other pfSene packages installed ?
IMHO, a 7100 can do some serious routing. That said, with half a zillion firewall states open, things tend to get 'hot' and slow. -
Mmm, uptime nearly a year. Shouldn't be an issue but I would want to check if a reboot removes it.
-
@stephenw10 Yes we plan to reboot it