Unbound Resolver Crash
-
Woke up this morning with no internet. Logged into pfsense and noticed that unbound was stopped , started it back up and I'm good to go. Is there any way to figure out the root cause of this issue? For now I turned on a watchdog service for unbound.
Feb 12 04:55:40 unbound 5043 [5043:0] info: 0.131072 0.262144 1 Feb 12 04:55:40 unbound 5043 [5043:0] info: 0.262144 0.524288 1 Feb 12 04:55:40 unbound 5043 [5043:0] info: server stats for thread 1: 42 queries, 9 answers from cache, 33 recursions, 0 prefetch, 0 rejected by ip ratelimiting Feb 12 04:55:40 unbound 5043 [5043:0] info: server stats for thread 1: requestlist max 3 avg 0.606061 exceeded 0 jostled 0 Feb 12 04:55:40 unbound 5043 [5043:0] info: average recursion processing time 0.079299 sec Feb 12 04:55:40 unbound 5043 [5043:0] info: histogram of recursion processing times Feb 12 04:55:40 unbound 5043 [5043:0] info: [25%]=0.0304274 median[50%]=0.0709973 [75%]=0.114688 Feb 12 04:55:40 unbound 5043 [5043:0] info: lower(secs) upper(secs) recursions Feb 12 04:55:40 unbound 5043 [5043:0] info: 0.008192 0.016384 2 Feb 12 04:55:40 unbound 5043 [5043:0] info: 0.016384 0.032768 7 Feb 12 04:55:40 unbound 5043 [5043:0] info: 0.032768 0.065536 6 Feb 12 04:55:40 unbound 5043 [5043:0] info: 0.065536 0.131072 12 Feb 12 04:55:40 unbound 5043 [5043:0] info: 0.131072 0.262144 5 Feb 12 04:55:40 unbound 5043 [5043:0] info: server stats for thread 2: 109 queries, 43 answers from cache, 66 recursions, 0 prefetch, 0 rejected by ip ratelimiting Feb 12 04:55:40 unbound 5043 [5043:0] info: server stats for thread 2: requestlist max 11 avg 1.83333 exceeded 0 jostled 0 Feb 12 04:55:40 unbound 5043 [5043:0] info: average recursion processing time 0.121382 sec Feb 12 04:55:40 unbound 5043 [5043:0] info: histogram of recursion processing times Feb 12 04:55:40 unbound 5043 [5043:0] info: [25%]=0.036864 median[50%]=0.074711 [75%]=0.115999 Feb 12 04:55:40 unbound 5043 [5043:0] info: lower(secs) upper(secs) recursions Feb 12 04:55:40 unbound 5043 [5043:0] info: 0.008192 0.016384 2 Feb 12 04:55:40 unbound 5043 [5043:0] info: 0.016384 0.032768 12 Feb 12 04:55:40 unbound 5043 [5043:0] info: 0.032768 0.065536 14 Feb 12 04:55:40 unbound 5043 [5043:0] info: 0.065536 0.131072 25 Feb 12 04:55:40 unbound 5043 [5043:0] info: 0.131072 0.262144 7 Feb 12 04:55:40 unbound 5043 [5043:0] info: 0.262144 0.524288 1 Feb 12 04:55:40 unbound 5043 [5043:0] info: 1.000000 2.000000 2 Feb 12 04:55:40 unbound 5043 [5043:0] info: server stats for thread 3: 70 queries, 20 answers from cache, 50 recursions, 0 prefetch, 0 rejected by ip ratelimiting Feb 12 04:55:40 unbound 5043 [5043:0] info: server stats for thread 3: requestlist max 7 avg 0.58 exceeded 0 jostled 0 Feb 12 04:55:40 unbound 5043 [5043:0] info: average recursion processing time 0.081300 sec Feb 12 04:55:40 unbound 5043 [5043:0] info: histogram of recursion processing times Feb 12 04:55:40 unbound 5043 [5043:0] info: [25%]=0.019456 median[50%]=0.0546133 [75%]=0.122135 Feb 12 04:55:40 unbound 5043 [5043:0] info: lower(secs) upper(secs) recursions Feb 12 04:55:40 unbound 5043 [5043:0] info: 0.000000 0.000001 2 Feb 12 04:55:40 unbound 5043 [5043:0] info: 0.008192 0.016384 9 Feb 12 04:55:40 unbound 5043 [5043:0] info: 0.016384 0.032768 8 Feb 12 04:55:40 unbound 5043 [5043:0] info: 0.032768 0.065536 9 Feb 12 04:55:40 unbound 5043 [5043:0] info: 0.065536 0.131072 11 Feb 12 04:55:40 unbound 5043 [5043:0] info: 0.131072 0.262144 8 Feb 12 04:55:40 unbound 5043 [5043:0] info: 0.262144 0.524288 3 Feb 12 04:55:40 unbound 5043 [5043:0] notice: Restart of unbound 1.22.0. Feb 12 04:55:42 unbound 5043 [5043:0] notice: init module 0: validator Feb 12 04:55:42 unbound 5043 [5043:0] notice: init module 1: iterator Feb 12 04:55:42 unbound 5043 [5043:0] info: start of service (unbound 1.22.0). Feb 12 04:55:42 unbound 5043 [5043:1] info: generate keytag query _ta-4f66-9728. NULL IN Feb 12 05:03:58 unbound 5043 [5043:0] info: service stopped (unbound 1.22.0). Feb 12 05:03:58 unbound 5043 [5043:0] info: server stats for thread 0: 118 queries, 34 answers from cache, 84 recursions, 0 prefetch, 0 rejected by ip ratelimiting Feb 12 05:03:58 unbound 5043 [5043:0] info: server stats for thread 0: requestlist max 4 avg 1.15476 exceeded 1 jostled 0 Feb 12 05:03:58 unbound 5043 [5043:0] info: average recursion processing time 0.078417 sec Feb 12 05:03:58 unbound 5043 [5043:0] info: histogram of recursion processing times Feb 12 05:03:58 unbound 5043 [5043:0] info: [25%]=0.0333531 median[50%]=0.057344 [75%]=0.105751 Feb 12 05:03:58 unbound 5043 [5043:0] info: lower(secs) upper(secs) recursions Feb 12 05:03:58 unbound 5043 [5043:0] info: 0.000000 0.000001 5 Feb 12 05:03:58 unbound 5043 [5043:0] info: 0.008192 0.016384 4 Feb 12 05:03:58 unbound 5043 [5043:0] info: 0.016384 0.032768 11 Feb 12 05:03:58 unbound 5043 [5043:0] info: 0.032768 0.065536 28 Feb 12 05:03:58 unbound 5043 [5043:0] info: 0.065536 0.131072 22 Feb 12 05:03:58 unbound 5043 [5043:0] info: 0.131072 0.262144 10 Feb 12 05:03:58 unbound 5043 [5043:0] info: 0.262144 0.524288 2 Feb 12 05:03:58 unbound 5043 [5043:0] info: server stats for thread 1: 75 queries, 24 answers from cache, 51 recursions, 0 prefetch, 0 rejected by ip ratelimiting Feb 12 05:03:58 unbound 5043 [5043:0] info: server stats for thread 1: requestlist max 2 avg 1.07843 exceeded 2 jostled 0 Feb 12 05:03:58 unbound 5043 [5043:0] info: average recursion processing time 0.077100 sec Feb 12 05:03:58 unbound 5043 [5043:0] info: histogram of recursion processing times Feb 12 05:03:58 unbound 5043 [5043:0] info: [25%]=0.032768 median[50%]=0.0589824 [75%]=0.104858 Feb 12 05:03:58 unbound 5043 [5043:0] info: lower(secs) upper(secs) recursions Feb 12 05:03:58 unbound 5043 [5043:0] info: 0.000000 0.000001 1 Feb 12 05:03:58 unbound 5043 [5043:0] info: 0.008192 0.016384 4 Feb 12 05:03:58 unbound 5043 [5043:0] info: 0.016384 0.032768 7 Feb 12 05:03:58 unbound 5043 [5043:0] info: 0.032768 0.065536 15 Feb 12 05:03:58 unbound 5043 [5043:0] info: 0.065536 0.131072 15 Feb 12 05:03:58 unbound 5043 [5043:0] info: 0.131072 0.262144 3 Feb 12 05:03:58 unbound 5043 [5043:0] info: 0.262144 0.524288 3 Feb 12 05:03:58 unbound 5043 [5043:0] info: server stats for thread 2: 65 queries, 23 answers from cache, 42 recursions, 0 prefetch, 0 rejected by ip ratelimiting Feb 12 05:03:58 unbound 5043 [5043:0] info: server stats for thread 2: requestlist max 1 avg 0.0714286 exceeded 1 jostled 0 Feb 12 05:03:58 unbound 5043 [5043:0] info: average recursion processing time 0.112968 sec Feb 12 05:03:58 unbound 5043 [5043:0] info: histogram of recursion processing times Feb 12 05:03:58 unbound 5043 [5043:0] info: [25%]=0.0359188 median[50%]=0.0617551 [75%]=0.12288 Feb 12 05:03:58 unbound 5043 [5043:0] info: lower(secs) upper(secs) recursions Feb 12 05:03:58 unbound 5043 [5043:0] info: 0.008192 0.016384 2 Feb 12 05:03:58 unbound 5043 [5043:0] info: 0.016384 0.032768 7 Feb 12 05:03:58 unbound 5043 [5043:0] info: 0.032768 0.065536 13 Feb 12 05:03:58 unbound 5043 [5043:0] info: 0.065536 0.131072 10 Feb 12 05:03:58 unbound 5043 [5043:0] info: 0.131072 0.262144 7 Feb 12 05:03:58 unbound 5043 [5043:0] info: 0.262144 0.524288 1 Feb 12 05:03:58 unbound 5043 [5043:0] info: 1.000000 2.000000 1 Feb 12 05:03:58 unbound 5043 [5043:0] info: server stats for thread 3: 116 queries, 41 answers from cache, 75 recursions, 0 prefetch, 0 rejected by ip ratelimiting Feb 12 05:03:58 unbound 5043 [5043:0] info: server stats for thread 3: requestlist max 1 avg 0.213333 exceeded 3 jostled 0 Feb 12 05:03:58 unbound 5043 [5043:0] info: average recursion processing time 0.091925 sec Feb 12 05:03:58 unbound 5043 [5043:0] info: histogram of recursion processing times Feb 12 05:03:58 unbound 5043 [5043:0] info: [25%]=0.0259413 median[50%]=0.059392 [75%]=0.120149 Feb 12 05:03:58 unbound 5043 [5043:0] info: lower(secs) upper(secs) recursions Feb 12 05:03:58 unbound 5043 [5043:0] info: 0.000000 0.000001 3 Feb 12 05:03:58 unbound 5043 [5043:0] info: 0.008192 0.016384 8 Feb 12 05:03:58 unbound 5043 [5043:0] info: 0.016384 0.032768 12 Feb 12 05:03:58 unbound 5043 [5043:0] info: 0.032768 0.065536 16 Feb 12 05:03:58 unbound 5043 [5043:0] info: 0.065536 0.131072 18 Feb 12 05:03:58 unbound 5043 [5043:0] info: 0.131072 0.262144 12 Feb 12 05:03:58 unbound 5043 [5043:0] info: 0.262144 0.524288 2 Feb 12 05:03:58 unbound 5043 [5043:0] info: 1.000000 2.000000 1 Feb 12 05:03:58 unbound 5043 [5043:0] notice: Restart of unbound 1.22.0. Feb 12 05:04:00 unbound 5043 [5043:0] notice: init module 0: validator Feb 12 05:04:00 unbound 5043 [5043:0] notice: init module 1: iterator Feb 12 05:04:00 unbound 5043 [5043:0] info: start of service (unbound 1.22.0). Feb 12 05:04:00 unbound 5043 [5043:0] info: service stopped (unbound 1.22.0). Feb 12 05:04:01 unbound 5043 [5043:0] info: server stats for thread 0: 0 queries, 0 answers from cache, 0 recursions, 0 prefetch, 0 rejected by ip ratelimiting Feb 12 05:04:01 unbound 5043 [5043:0] info: server stats for thread 0: requestlist max 0 avg 0 exceeded 0 jostled 0 Feb 12 05:04:01 unbound 5043 [5043:0] info: server stats for thread 1: 1 queries, 0 answers from cache, 1 recursions, 0 prefetch, 0 rejected by ip ratelimiting Feb 12 05:04:01 unbound 5043 [5043:0] info: server stats for thread 1: requestlist max 0 avg 0 exceeded 0 jostled 0 Feb 12 05:04:01 unbound 5043 [5043:0] info: server stats for thread 2: 0 queries, 0 answers from cache, 0 recursions, 0 prefetch, 0 rejected by ip ratelimiting Feb 12 05:04:01 unbound 5043 [5043:0] info: server stats for thread 2: requestlist max 0 avg 0 exceeded 0 jostled 0 Feb 12 05:04:01 unbound 5043 [5043:0] info: server stats for thread 3: 0 queries, 0 answers from cache, 0 recursions, 0 prefetch, 0 rejected by ip ratelimiting Feb 12 05:04:01 unbound 5043 [5043:0] info: server stats for thread 3: requestlist max 0 avg 0 exceeded 0 jostled 0 Feb 12 05:04:01 unbound 5043 [5043:0] notice: Restart of unbound 1.22.0. Feb 12 05:04:03 unbound 5043 [5043:0] notice: init module 0: validator Feb 12 05:04:03 unbound 5043 [5043:0] notice: init module 1: iterator Feb 12 05:04:03 unbound 5043 [5043:0] info: start of service (unbound 1.22.0). Feb 12 05:04:04 unbound 5043 [5043:2] info: generate keytag query _ta-4f66-9728. NULL IN Feb 12 05:04:40 unbound 5043 [5043:0] info: service stopped (unbound 1.22.0). Feb 12 05:04:40 unbound 5043 [5043:0] info: server stats for thread 0: 4 queries, 0 answers from cache, 4 recursions, 0 prefetch, 0 rejected by ip ratelimiting Feb 12 05:04:40 unbound 5043 [5043:0] info: server stats for thread 0: requestlist max 0 avg 0 exceeded 0 jostled 0 Feb 12 05:04:40 unbound 5043 [5043:0] info: average recursion processing time 0.133226 sec Feb 12 05:04:40 unbound 5043 [5043:0] info: histogram of recursion processing times Feb 12 05:04:40 unbound 5043 [5043:0] info: [25%]=0.016384 median[50%]=0.131072 [75%]=0.196608 Feb 12 05:04:40 unbound 5043 [5043:0] info: lower(secs) upper(secs) recursions Feb 12 05:04:40 unbound 5043 [5043:0] info: 0.008192 0.016384 1 Feb 12 05:04:40 unbound 5043 [5043:0] info: 0.065536 0.131072 1 Feb 12 05:04:40 unbound 5043 [5043:0] info: 0.131072 0.262144 2 Feb 12 05:04:40 unbound 5043 [5043:0] info: server stats for thread 1: 6 queries, 0 answers from cache, 6 recursions, 0 prefetch, 0 rejected by ip ratelimiting Feb 12 05:04:40 unbound 5043 [5043:0] info: server stats for thread 1: requestlist max 1 avg 0.666667 exceeded 0 jostled 0 Feb 12 05:04:40 unbound 5043 [5043:0] info: average recursion processing time 0.125758 sec Feb 12 05:04:40 unbound 5043 [5043:0] info: histogram of recursion processing times Feb 12 05:04:40 unbound 5043 [5043:0] info: [25%]=0 median[50%]=0 [75%]=0 Feb 12 05:04:40 unbound 5043 [5043:0] info: lower(secs) upper(secs) recursions Feb 12 05:04:40 unbound 5043 [5043:0] info: 0.032768 0.065536 1 Feb 12 05:04:40 unbound 5043 [5043:0] info: 0.131072 0.262144 2 Feb 12 05:04:40 unbound 5043 [5043:0] info: server stats for thread 2: 8 queries, 1 answers from cache, 7 recursions, 0 prefetch, 0 rejected by ip ratelimiting Feb 12 05:04:40 unbound 5043 [5043:0] info: server stats for thread 2: requestlist max 1 avg 0.571429 exceeded 0 jostled 0 Feb 12 05:04:40 unbound 5043 [5043:0] info: average recursion processing time 0.124209 sec Feb 12 05:04:40 unbound 5043 [5043:0] info: histogram of recursion processing times Feb 12 05:04:40 unbound 5043 [5043:0] info: [25%]=0.057344 median[50%]=0.0873813 [75%]=0.120149 Feb 12 05:04:40 unbound 5043 [5043:0] info: lower(secs) upper(secs) recursions Feb 12 05:04:40 unbound 5043 [5043:0] info: 0.032768 0.065536 2 Feb 12 05:04:40 unbound 5043 [5043:0] info: 0.065536 0.131072 3 Feb 12 05:04:40 unbound 5043 [5043:0] info: 0.262144 0.524288 1 Feb 12 05:04:40 unbound 5043 [5043:0] info: server stats for thread 3: 3 queries, 2 answers from cache, 1 recursions, 0 prefetch, 0 rejected by ip ratelimiting Feb 12 05:04:40 unbound 5043 [5043:0] info: server stats for thread 3: requestlist max 0 avg 0 exceeded 0 jostled 0 Feb 12 05:04:40 unbound 5043 [5043:0] info: average recursion processing time 0.173356 sec Feb 12 05:04:40 unbound 5043 [5043:0] info: histogram of recursion processing times Feb 12 05:04:40 unbound 5043 [5043:0] info: [25%]=0 median[50%]=0 [75%]=0 Feb 12 05:04:40 unbound 5043 [5043:0] info: lower(secs) upper(secs) recursions Feb 12 05:04:40 unbound 5043 [5043:0] info: 0.131072 0.262144 1 Feb 12 05:04:40 unbound 5043 [5043:0] notice: Restart of unbound 1.22.0. Feb 12 05:04:43 unbound 5043 [5043:0] notice: init module 0: validator Feb 12 05:04:43 unbound 5043 [5043:0] notice: init module 1: iterator Feb 12 05:04:43 unbound 5043 [5043:0] info: start of service (unbound 1.22.0). Feb 12 05:04:43 unbound 5043 [5043:1] info: generate keytag query _ta-4f66-9728. NULL IN Feb 12 05:06:23 unbound 5043 [5043:0] info: service stopped (unbound 1.22.0). Feb 12 05:06:23 unbound 5043 [5043:0] info: server stats for thread 0: 11 queries, 2 answers from cache, 9 recursions, 0 prefetch, 0 rejected by ip ratelimiting Feb 12 05:06:23 unbound 5043 [5043:0] info: server stats for thread 0: requestlist max 1 avg 0.333333 exceeded 0 jostled 0 Feb 12 05:06:23 unbound 5043 [5043:0] info: average recursion processing time 0.082472 sec Feb 12 05:06:23 unbound 5043 [5043:0] info: histogram of recursion processing times Feb 12 05:06:23 unbound 5043 [5043:0] info: [25%]=0.04096 median[50%]=0.057344 [75%]=0.098304 Feb 12 05:06:23 unbound 5043 [5043:0] info: lower(secs) upper(secs) recursions Feb 12 05:06:23 unbound 5043 [5043:0] info: 0.008192 0.016384 1 Feb 12 05:06:23 unbound 5043 [5043:0] info: 0.032768 0.065536 4 Feb 12 05:06:23 unbound 5043 [5043:0] info: 0.065536 0.131072 2 Feb 12 05:06:23 unbound 5043 [5043:0] info: 0.131072 0.262144 1 Feb 12 05:06:23 unbound 5043 [5043:0] info: server stats for thread 1: 10 queries, 1 answers from cache, 9 recursions, 0 prefetch, 0 rejected by ip ratelimiting Feb 12 05:06:23 unbound 5043 [5043:0] info: server stats for thread 1: requestlist max 2 avg 0.555556 exceeded 0 jostled 0 Feb 12 05:06:23 unbound 5043 [5043:0] info: average recursion processing time 0.057914 sec Feb 12 05:06:23 unbound 5043 [5043:0] info: histogram of recursion processing times Feb 12 05:06:23 unbound 5043 [5043:0] info: [25%]=0.022528 median[50%]=0.04096 [75%]=0.08192 Feb 12 05:06:23 unbound 5043 [5043:0] info: lower(secs) upper(secs) recursions Feb 12 05:06:23 unbound 5043 [5043:0] info: 0.008192 0.016384 1 Feb 12 05:06:23 unbound 5043 [5043:0] info: 0.016384 0.032768 2 Feb 12 05:06:23 unbound 5043 [5043:0] info: 0.032768 0.065536 2 Feb 12 05:06:23 unbound 5043 [5043:0] info: 0.065536 0.131072 1 Feb 12 05:06:23 unbound 5043 [5043:0] info: 0.131072 0.262144 1 Feb 12 05:06:23 unbound 5043 [5043:0] info: server stats for thread 2: 12 queries, 3 answers from cache, 9 recursions, 0 prefetch, 0 rejected by ip ratelimiting Feb 12 05:06:23 unbound 5043 [5043:0] info: server stats for thread 2: requestlist max 0 avg 0 exceeded 0 jostled 0 Feb 12 05:06:23 unbound 5043 [5043:0] info: average recursion processing time 0.094154 sec Feb 12 05:06:23 unbound 5043 [5043:0] info: histogram of recursion processing times Feb 12 05:06:23 unbound 5043 [5043:0] info: [25%]=0.036864 median[50%]=0.08192 [75%]=0.16384 Feb 12 05:06:23 unbound 5043 [5043:0] info: lower(secs) upper(secs) recursions Feb 12 05:06:23 unbound 5043 [5043:0] info: 0.008192 0.016384 1 Feb 12 05:06:23 unbound 5043 [5043:0] info: 0.016384 0.032768 1 Feb 12 05:06:23 unbound 5043 [5043:0] info: 0.032768 0.065536 2 Feb 12 05:06:23 unbound 5043 [5043:0] info: 0.065536 0.131072 2 Feb 12 05:06:23 unbound 5043 [5043:0] info: 0.131072 0.262144 3 Feb 12 05:06:23 unbound 5043 [5043:0] info: server stats for thread 3: 24 queries, 2 answers from cache, 22 recursions, 0 prefetch, 0 rejected by ip ratelimiting Feb 12 05:06:23 unbound 5043 [5043:0] info: server stats for thread 3: requestlist max 1 avg 0.318182 exceeded 0 jostled 0 Feb 12 05:06:23 unbound 5043 [5043:0] info: average recursion processing time 0.057156 sec Feb 12 05:06:23 unbound 5043 [5043:0] info: histogram of recursion processing times Feb 12 05:06:23 unbound 5043 [5043:0] info: [25%]=0.028672 median[50%]=0.0512 [75%]=0.08192 Feb 12 05:06:23 unbound 5043 [5043:0] info: lower(secs) upper(secs) recursions Feb 12 05:06:23 unbound 5043 [5043:0] info: 0.008192 0.016384 3 Feb 12 05:06:23 unbound 5043 [5043:0] info: 0.016384 0.032768 3 Feb 12 05:06:23 unbound 5043 [5043:0] info: 0.032768 0.065536 8 Feb 12 05:06:23 unbound 5043 [5043:0] info: 0.065536 0.131072 7 Feb 12 05:06:23 unbound 5043 [5043:0] notice: Restart of unbound 1.22.0. Feb 12 05:06:25 unbound 5043 [5043:0] notice: init module 0: validator Feb 12 05:06:25 unbound 5043 [5043:0] notice: init module 1: iterator Feb 12 05:06:25 unbound 5043 [5043:0] info: start of service (unbound 1.22.0). Feb 12 05:06:25 unbound 5043 [5043:1] info: generate keytag query _ta-4f66-9728. NULL IN Feb 12 05:06:33 unbound 5043 [5043:0] info: service stopped (unbound 1.22.0). Feb 12 05:06:33 unbound 5043 [5043:0] info: server stats for thread 0: 0 queries, 0 answers from cache, 0 recursions, 0 prefetch, 0 rejected by ip ratelimiting Feb 12 05:06:33 unbound 5043 [5043:0] info: server stats for thread 0: requestlist max 0 avg 0 exceeded 0 jostled 0 Feb 12 05:06:33 unbound 5043 [5043:0] info: server stats for thread 1: 0 queries, 0 answers from cache, 0 recursions, 0 prefetch, 0 rejected by ip ratelimiting Feb 12 05:06:33 unbound 5043 [5043:0] info: server stats for thread 1: requestlist max 0 avg 0 exceeded 0 jostled 0 Feb 12 05:06:33 unbound 5043 [5043:0] info: server stats for thread 2: 0 queries, 0 answers from cache, 0 recursions, 0 prefetch, 0 rejected by ip ratelimiting Feb 12 05:06:33 unbound 5043 [5043:0] info: server stats for thread 2: requestlist max 0 avg 0 exceeded 0 jostled 0 Feb 12 05:06:33 unbound 5043 [5043:0] info: server stats for thread 3: 1 queries, 0 answers from cache, 1 recursions, 0 prefetch, 0 rejected by ip ratelimiting Feb 12 05:06:33 unbound 5043 [5043:0] info: server stats for thread 3: requestlist max 0 avg 0 exceeded 0 jostled 0 Feb 12 05:06:33 unbound 5043 [5043:0] info: average recursion processing time 0.165490 sec Feb 12 05:06:33 unbound 5043 [5043:0] info: histogram of recursion processing times Feb 12 05:06:33 unbound 5043 [5043:0] info: [25%]=0 median[50%]=0 [75%]=0 Feb 12 05:06:33 unbound 5043 [5043:0] info: lower(secs) upper(secs) recursions Feb 12 05:06:33 unbound 5043 [5043:0] info: 0.131072 0.262144 1 Feb 12 05:06:33 unbound 5043 [5043:0] notice: Restart of unbound 1.22.0. Feb 12 05:06:36 unbound 5043 [5043:0] notice: init module 0: validator Feb 12 05:06:36 unbound 5043 [5043:0] notice: init module 1: iterator Feb 12 05:06:36 unbound 5043 [5043:0] info: start of service (unbound 1.22.0). Feb 12 05:06:36 unbound 5043 [5043:1] info: generate keytag query _ta-4f66-9728. NULL IN Feb 12 05:15:47 unbound 5043 [5043:0] info: service stopped (unbound 1.22.0). Feb 12 05:15:47 unbound 5043 [5043:0] info: server stats for thread 0: 151 queries, 65 answers from cache, 86 recursions, 0 prefetch, 0 rejected by ip ratelimiting Feb 12 05:15:47 unbound 5043 [5043:0] info: server stats for thread 0: requestlist max 7 avg 1.63953 exceeded 0 jostled 0 Feb 12 05:15:47 unbound 5043 [5043:0] info: average recursion processing time 0.081992 sec Feb 12 05:15:47 unbound 5043 [5043:0] info: histogram of recursion processing times Feb 12 05:15:47 unbound 5043 [5043:0] info: [25%]=0.0260389 median[50%]=0.0644437 [75%]=0.115318 Feb 12 05:15:47 unbound 5043 [5043:0] info: lower(secs) upper(secs) recursions Feb 12 05:15:47 unbound 5043 [5043:0] info: 0.008192 0.016384 12 Feb 12 05:15:47 unbound 5043 [5043:0] info: 0.016384 0.032768 14 Feb 12 05:15:47 unbound 5043 [5043:0] info: 0.032768 0.065536 15 Feb 12 05:15:47 unbound 5043 [5043:0] info: 0.065536 0.131072 26 Feb 12 05:15:47 unbound 5043 [5043:0] info: 0.131072 0.262144 11 Feb 12 05:15:47 unbound 5043 [5043:0] info: 0.262144 0.524288 3 Feb 12 05:15:47 unbound 5043 [5043:0] info: server stats for thread 1: 86 queries, 30 answers from cache, 56 recursions, 0 prefetch, 0 rejected by ip ratelimiting Feb 12 05:15:47 unbound 5043 [5043:0] info: server stats for thread 1: requestlist max 4 avg 1.60714 exceeded 4 jostled 0 Feb 12 05:15:47 unbound 5043 [5043:0] info: average recursion processing time 0.170651 sec Feb 12 05:15:47 unbound 5043 [5043:0] info: histogram of recursion processing times Feb 12 05:15:47 unbound 5043 [5043:0] info: [25%]=0.030208 median[50%]=0.0772389 [75%]=0.151552 Feb 12 05:15:47 unbound 5043 [5043:0] info: lower(secs) upper(secs) recursions Feb 12 05:15:47 unbound 5043 [5043:0] info: 0.000000 0.000001 2 Feb 12 05:15:47 unbound 5043 [5043:0] info: 0.008192 0.016384 4 Feb 12 05:15:47 unbound 5043 [5043:0] info: 0.016384 0.032768 8 Feb 12 05:15:47 unbound 5043 [5043:0] info: 0.032768 0.065536 9 Feb 12 05:15:47 unbound 5043 [5043:0] info: 0.065536 0.131072 14 Feb 12 05:15:47 unbound 5043 [5043:0] info: 0.131072 0.262144 8 Feb 12 05:15:47 unbound 5043 [5043:0] info: 0.262144 0.524288 1 Feb 12 05:15:47 unbound 5043 [5043:0] info: 0.524288 1.000000 2 Feb 12 05:15:47 unbound 5043 [5043:0] info: 1.000000 2.000000 3 Feb 12 05:15:47 unbound 5043 [5043:0] info: server stats for thread 2: 121 queries, 44 answers from cache, 77 recursions, 0 prefetch, 0 rejected by ip ratelimiting Feb 12 05:15:47 unbound 5043 [5043:0] info: server stats for thread 2: requestlist max 8 avg 1.28571 exceeded 4 jostled 0 Feb 12 05:15:47 unbound 5043 [5043:0] info: average recursion processing time 0.095148 sec Feb 12 05:15:47 unbound 5043 [5043:0] info: histogram of recursion processing times Feb 12 05:15:47 unbound 5043 [5043:0] info: [25%]=0.0314027 median[50%]=0.067584 [75%]=0.145408 Feb 12 05:15:47 unbound 5043 [5043:0] info: lower(secs) upper(secs) recursions Feb 12 05:15:47 unbound 5043 [5043:0] info: 0.000000 0.000001 3 Feb 12 05:15:47 unbound 5043 [5043:0] info: 0.008192 0.016384 6 Feb 12 05:15:47 unbound 5043 [5043:0] info: 0.016384 0.032768 9 Feb 12 05:15:47 unbound 5043 [5043:0] info: 0.032768 0.065536 16 Feb 12 05:15:47 unbound 5043 [5043:0] info: 0.065536 0.131072 16 Feb 12 05:15:47 unbound 5043 [5043:0] info: 0.131072 0.262144 16 Feb 12 05:15:47 unbound 5043 [5043:0] info: 0.262144 0.524288 2 Feb 12 05:15:47 unbound 5043 [5043:0] info: 0.524288 1.000000 1 Feb 12 05:15:47 unbound 5043 [5043:0] info: server stats for thread 3: 174 queries, 62 answers from cache, 112 recursions, 0 prefetch, 0 rejected by ip ratelimiting Feb 12 05:15:47 unbound 5043 [5043:0] info: server stats for thread 3: requestlist max 10 avg 1.94643 exceeded 1 jostled 0 Feb 12 05:15:47 unbound 5043 [5043:0] info: average recursion processing time 0.090075 sec Feb 12 05:15:47 unbound 5043 [5043:0] info: histogram of recursion processing times Feb 12 05:15:47 unbound 5043 [5043:0] info: [25%]=0.0318371 median[50%]=0.0615812 [75%]=0.119954 Feb 12 05:15:47 unbound 5043 [5043:0] info: lower(secs) upper(secs) recursions Feb 12 05:15:47 unbound 5043 [5043:0] info: 0.000000 0.000001 1 Feb 12 05:15:47 unbound 5043 [5043:0] info: 0.008192 0.016384 5 Feb 12 05:15:47 unbound 5043 [5043:0] info: 0.016384 0.032768 22 Feb 12 05:15:47 unbound 5043 [5043:0] info: 0.032768 0.065536 29 Feb 12 05:15:47 unbound 5043 [5043:0] info: 0.065536 0.131072 28 Feb 12 05:15:47 unbound 5043 [5043:0] info: 0.131072 0.262144 19 Feb 12 05:15:47 unbound 5043 [5043:0] info: 0.262144 0.524288 2 Feb 12 05:15:47 unbound 5043 [5043:0] info: 1.000000 2.000000 1 -
@hypnosis4u2nv said in Unbound Resolver Crash:
Is there any way to figure out the root cause of this issue?
Look again at your logs - the ones you've shown above.
Is the moment that your unbound - the resolver, stopped, included in you log ?
If details exists, it will be shown at that moment.
Or the general system log, it might also indicate a reason.Your log show a message like

when it restarts unbound. pfSense itself will 'never' stop unbound like that.
It can restart unbound, for example when a interface comes active, or when an interface goes down.A restart is always a clean "stop" (it will logs several lines of stats before it actually stops) as shown above, and a start :

The user, also known as the admin, can however decide to stop unbound "manually" : press here and see what happens :

and in that case you have to click again to start it.
That said, unbound, as any other software solution, can have bugs.
It can 'stop' (crash, whatever). And a crashed process can log, as it's dead.
The system, pfSense isn't there to do something about it. And you've seen it yourself : it didn't restart unbound.@hypnosis4u2nv said in Unbound Resolver Crash:
For now I turned on a watchdog service for unbound.
Is a solution (imho : there is a price to pay ...).
tell us more about your pfSense : what version ? on what kind of device are you using pfSense ? Interfaces ?
What did the system lo tell you what was happening at the moment unbound stopped ?
When you connected to the pfSense dashboard, was there a crash report ?After all, there are so many reasons why this has happened. A bad bad memory cell (RAM) and unbound was the process using it (I'm just inventing a reason here) - or RAM filled up to the max, and the OS (pfSense uses FreeBSD) elected unbound as the biggest RAM user, and elected it to "go away",a s a full RAM will blow up the entire system. This event would haven been listed in the general system log.
-
Thanks for your feedback, This happened overnight sometime and noticed when I woke up.
pfsense version:
24.11-RELEASE (amd64)System info:
Intel(R) Core(TM) i5-7200U CPU @ 2.50GHz
Current: 2509 MHz, Max: 2700 MHz
4 CPUs : 1 package(s) x 2 core(s) x 2 hardware threads
AES-NI CPU Crypto: Yes (active)
IPsec-MB Crypto: Yes (active)
QAT Crypto: NoMemory usage:
9% of 16234 MiBThose were the logs I was able to obtain prior to waking up and restarting the service myself. I'd like to know what if anything is causing it so it that I can prevent it.
-
@hypnosis4u2nv said in Unbound Resolver Crash:
I'd like to know what if anything is causing it
Only the logs will be able to show you this. That's why they exist in the first place.
It's that, or consulting an oracle.
It's a bit concerning that you only have 20 minutes of log info stored. Your device doesn't have a small disk (logs are stored on disk, not RAM).Go to Status > System Logs > Settings and check your logs settings under "Log Rotation Options".
I raised mine a bit :
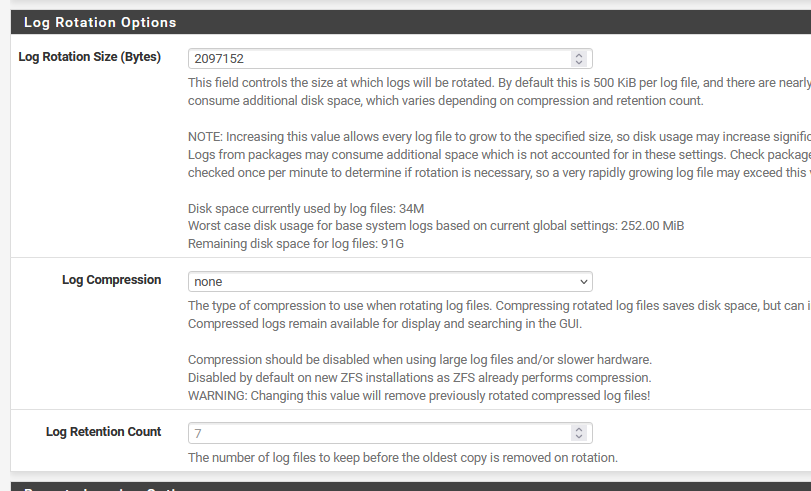
You saw that you 7 rotated files ? You can find them here /var/log/
I'm using myself 24.11 on a 4100 with an 100+ Gbytes SSD, and have - looking at the resolver log, 3 weeks of info. My unbound (resolver) log details is set default, "Level 1 - Basic operations".
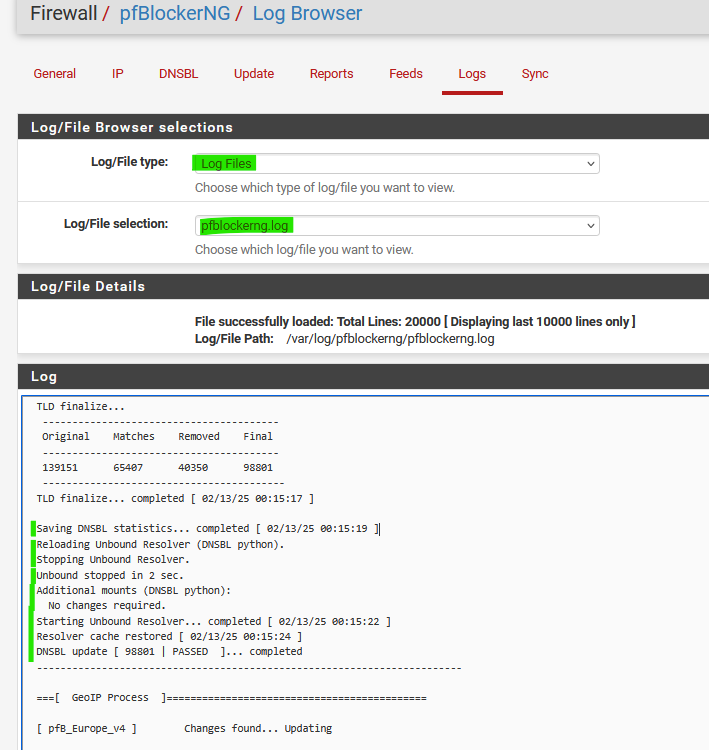
I'm using also pfBlockerng, which syncs/upgrades ones a day (not evety hours which is default) so it can - if needed - restart unbound ones every 1, 2 or 3 days or so. The graph shows unbound's memory usage.
-
@Gertjan I'll up my log size. I have pfblocker also, does daily updates.
-
@hypnosis4u2nv said in Unbound Resolver Crash:
I have pfblocker also, does daily updates.
Something like this :
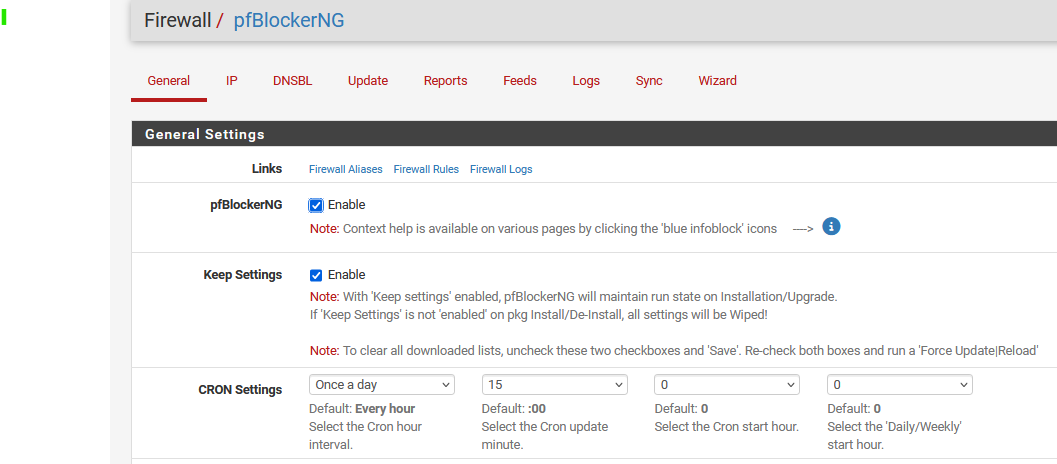
So, no surprise :
and now you've set everything up for "more problems".
Because :@hypnosis4u2nv said in Unbound Resolver Crash:
For now I turned on a watchdog service for unbound.
The service watch dog is stupid, doesn't have brains, doesn't use AI.
It execute every minute, checks if tasks listed don't run, and if not start them.
What if .... right at that moment pfBlocker did it's daily thing, and restarts unbound ? Change are pretty great (No need for a 4 years Havard licence here, its 1/30 or 3,33 % chance for me as my restart took 2 seconds and the dog runs every minute = 60 seconds) that the watch dog finds unboiund not running, and start it. But it was already in the restart process.....
You just created more problems.
My advise : you'll get to the bottom of this, don't worry. Just don't use "service watch dog".@hypnosis4u2nv said in Unbound Resolver Crash:
Memory usage:
9% of 16234 MiBOk, probably not a OOM event. That said, pfBlockerng uses PHP to do the loading, filtering and formating. PHP is very slow in doing this.
Do you have many DNSBL lists ?