periodic packet loss with new if_pppoe backend + high interrupts (post CE 2.8.0 upgrade)
-
Hello,
I'm experiencing apparently random 100% packet loss for WAN PPPOE after enabling the if_pppoe backend in CE 2.8.0 after upgrading from 2.7.2. This occurs every 10-20 hours. This situation is always accompanied by high interrupt weighted cpu usage:
last pid: 53837;  load averages:    3.46,    3.38,    2.83  up 0+19:24:28    16:47:43
332 threads:   8 running, 308 sleeping, 15 waiting, 1 lock
CPU:  0.9% user,  0.5% nice,  1.4% system,  0.4% interrupt, 96.7% idle
Mem: 180M Active, 1142M Inact, 734M Wired, 1748M Free
ARC: 283M Total, 109M MFU, 163M MRU, 529K Anon, 2200K Header, 7098K Other
     239M Compressed, 692M Uncompressed, 2.89:1 Ratio
Swap: 1024M Total, 1024M Free

  PID USERNAME    PRI NICE   SIZE    RES STATE    C   TIME    WCPU COMMAND
   11 root        187 ki31     0B    64K CPU1     1  18.9H 100.00% [idle{idle: cpu1}]
   11 root        187 ki31     0B    64K CPU3     3  18.9H 100.00% [idle{idle: cpu3}]
   11 root        187 ki31     0B    64K RUN      0  18.9H  96.19% [idle{idle: cpu0}]
   12 root        -56    -     0B   224K CPU2     2  14:47  77.88% [intr{swi1: netisr 1}]
    2 root        -60    -     0B    64K CPU2     2  13:49  26.56% [clock{clock (2)}]
   12 root        -60    -     0B   224K WAIT     1   1:45   2.98% [intr{swi1: netisr 3}]
    0 root        -60    -     0B  1392K -        0   4:20   2.49% [kernel{if_io_tqg_0}]
    0 root        -60    -     0B  1392K -        2   2:23   0.20% [kernel{if_io_tqg_2}]
   11 root        187 ki31     0B    64K RUN      2  18.3H   0.00% [idle{idle: cpu2}]
The only logs that indicate an error are the the following, starting at the gateway alarm:
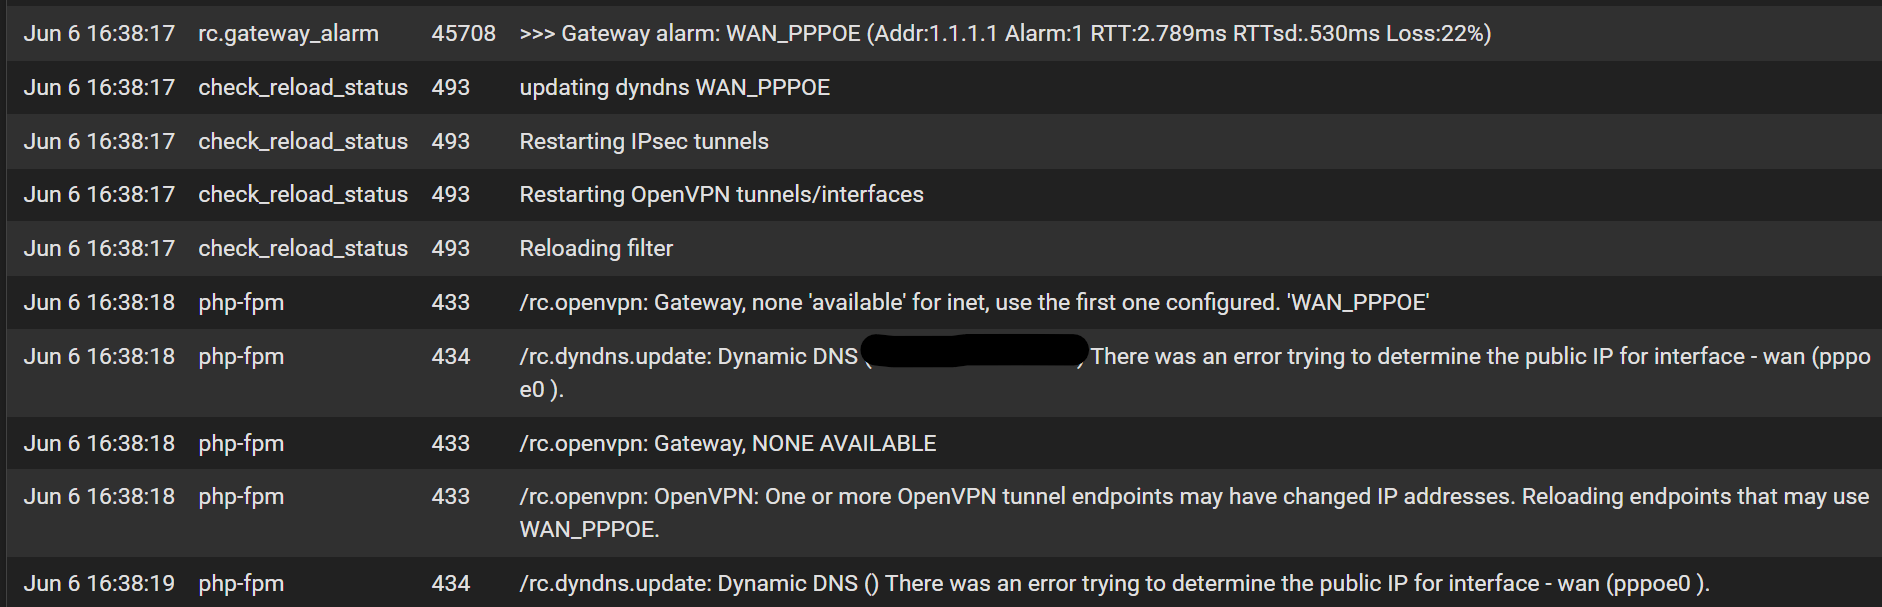
In this state there is zero connection to the outside world, and the router gets hot, but a reboot fixes it immediately. Without a reboot I never recover WAN. No logs in PPP indicating any issues, and my ISP uptime was 100%, meaning devices connected to the modem/router network didn't drop at this time, only the pfsense router. Confirmed that if I move back to the old pppoe implementation this doesn't occur over 4 days so it seems specific to if_pppoe. ISP is Bell in Canada.
Happy to provide any details, as this seems easily reproducible in my environment if I wait up to a day. Thanks!
-
That interrupt load implies it's passing a lot of traffic. Check the monitoring graphs for that time. What was the traffic load?
It doesn't happen when if_pppoe is not enabled?
-
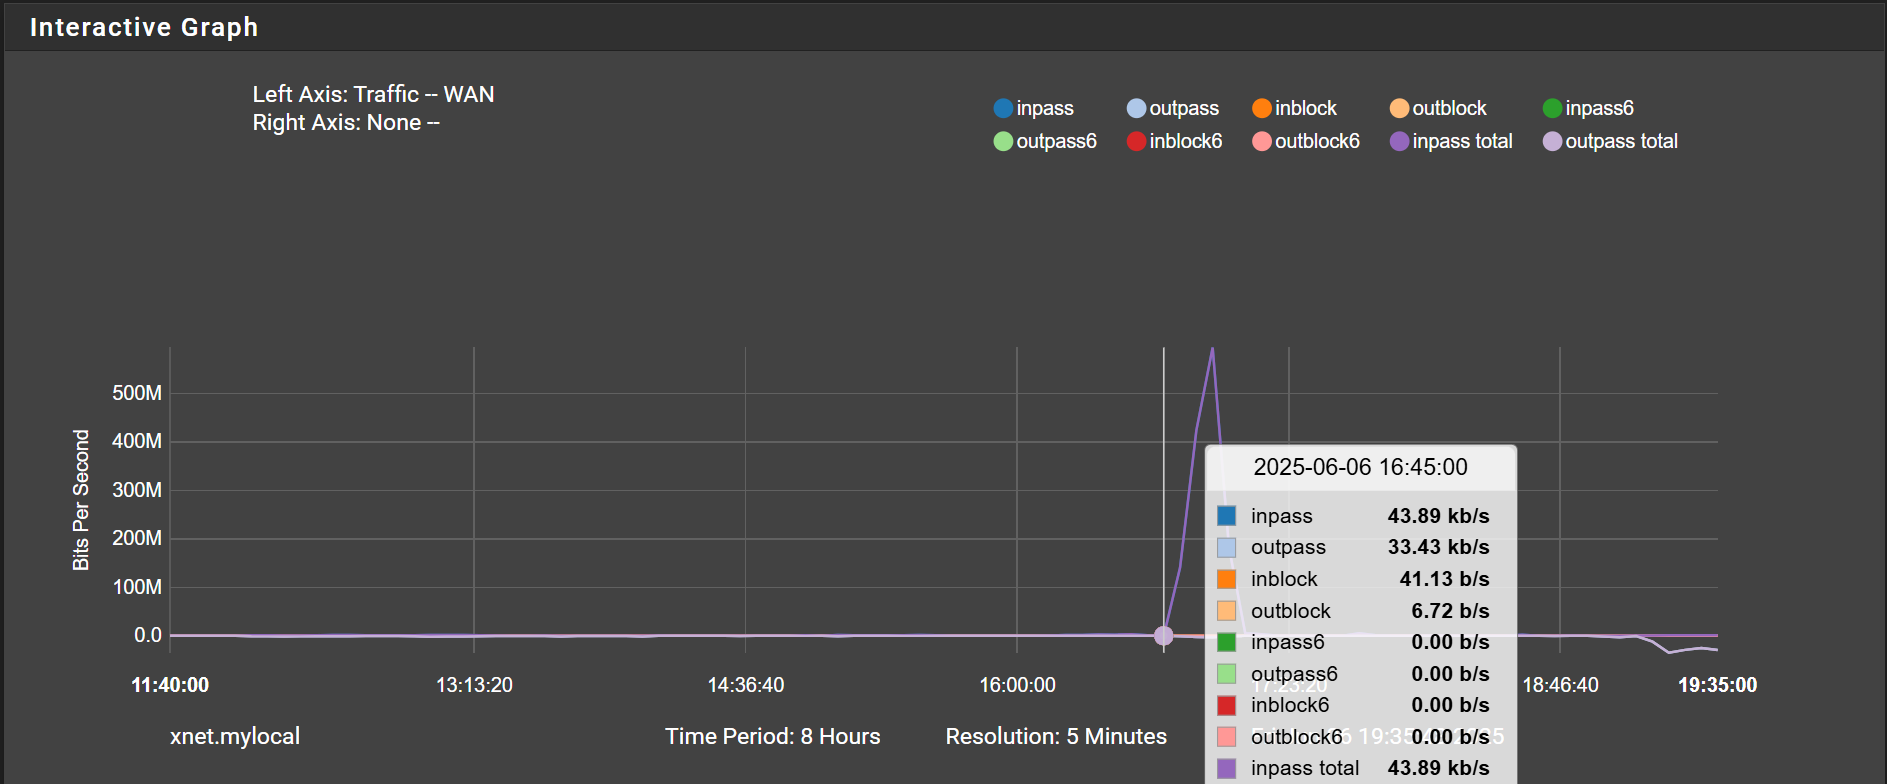
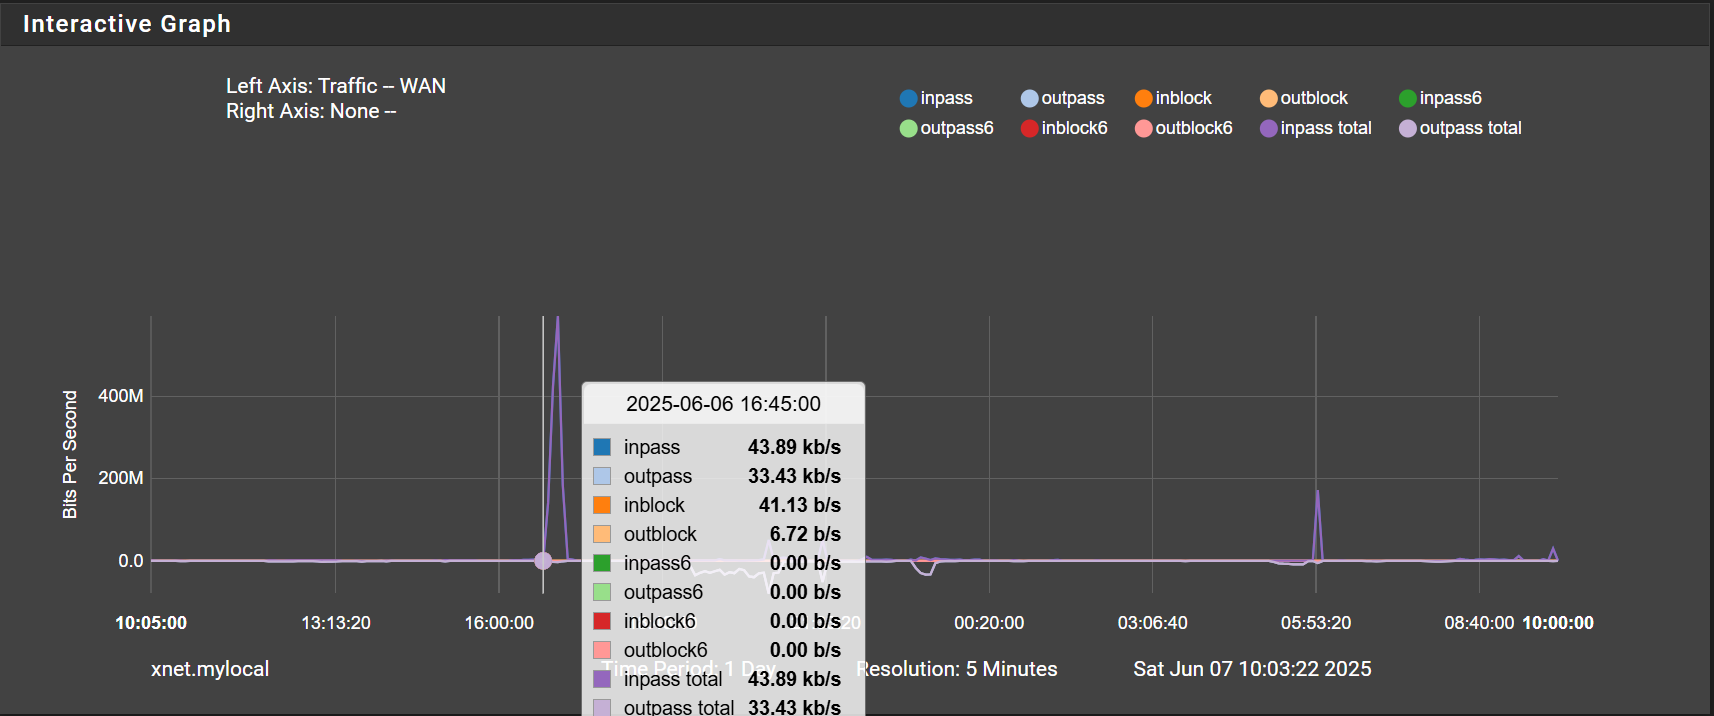
Yes it appears there was a sudden influx of traffic.
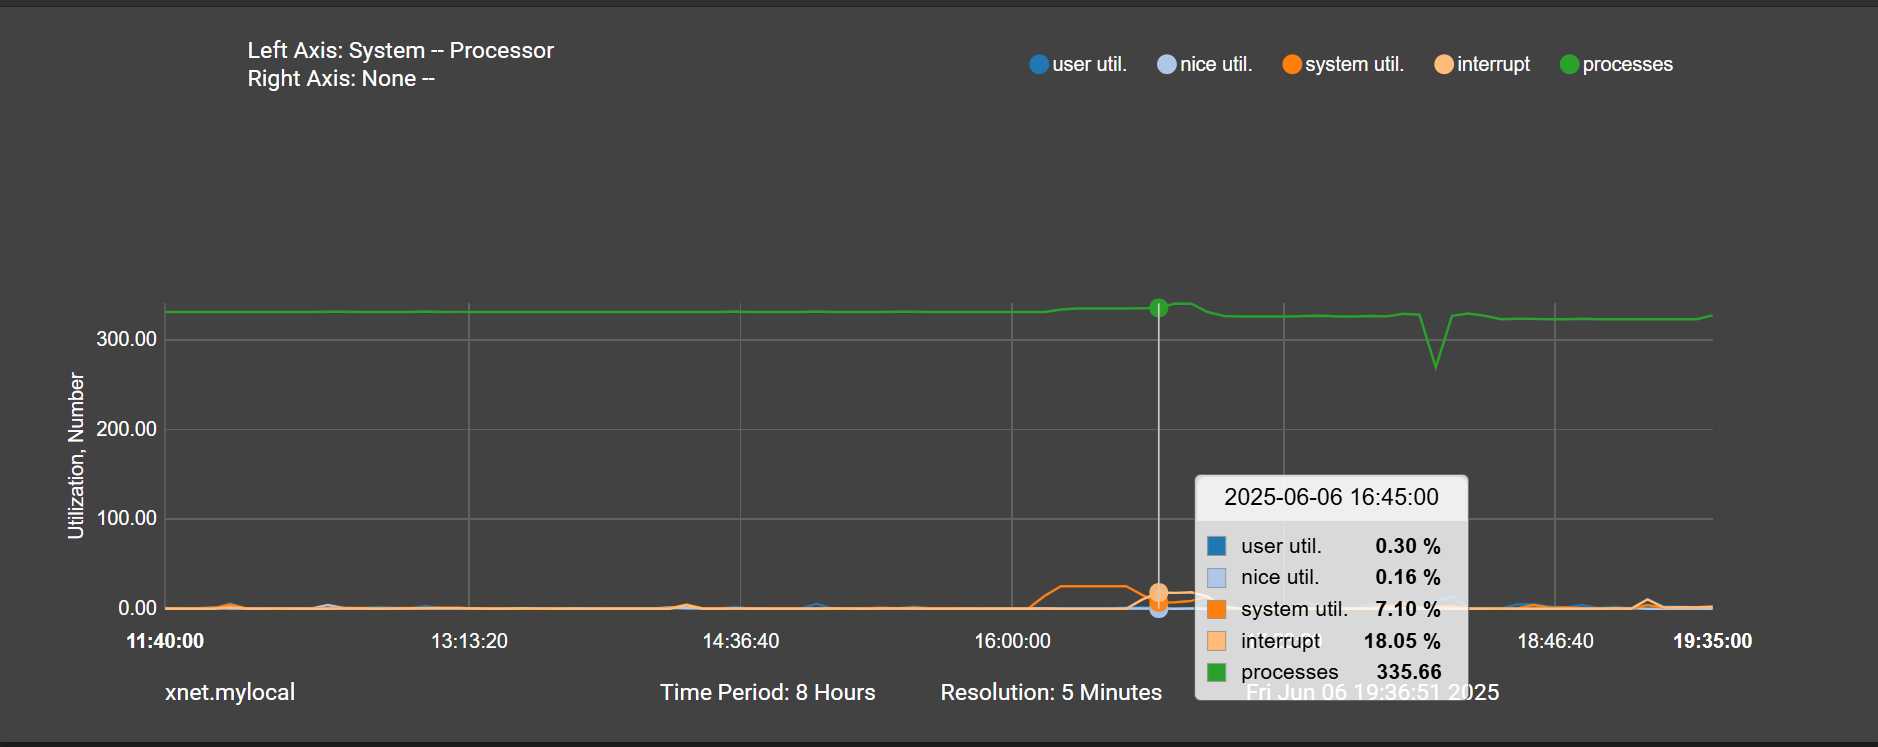
Around this time there is a spike in system usage ~40 mins before a large spike in interrupts:
And around the time of the interrupts a large influx of traffic into WAN:
I can't reproduce this when if_pppoe is disabled.
-
Hmm, >500Mbps is significant. Is that realistic for your connection?
Do you see that traffic on any other interface? Like is it actually being routed?
-
That kind of spike is not typical at all for my network. It looks like the same spike is observed in LAN so there is routing (it was where I logged into pfsense from). PPPOE WAN gateway went down at 16:38 and the spike followed at 16:45 according to the graphs. It seems like the spike was during the state when the gateway was apparently down, showing 100% packet loss in the gui.
-
@eldest What kind of hardware are you on?
-
@netblues this is a qotom box with an i5-7200u processor and Intel nics. I have noticed with if_pppoe that temps and CPU load is higher at idle, but still very low CPU utilization.
-
@eldest Suppose not virtual, right?
In any case an i5-7200u should be plenty to handle 500Mbit pppoe
I'm running same, virtualised on a i7-8700 CPU @ 3.20GHz with 1Gbit pppoe.
on pfplus 25.03 beta with the same pppoe "fix" enabled.As for the logs, do note that when the new pppoe is enabled, nothing gets logged in pppoe tab, as a "feature".
Have a look at the system log, (but don't expect much too).Wait for Stephenw, he might have some ideas.
-
It could be that the full utilization of CPU cores during PPPoE sessions is now triggering latent hardware issues.
-
@eldest said in periodic packet loss with new if_pppoe backend + high interrupts (post CE 2.8.0 upgrade):
netisr
So it's entirely expected to see CPU use in that thread if there's PPPoE traffic.
Other than the packet loss the other symptoms would be consistent with "There is a lot of traffic".
The first step in figuring out what's going on would be to run tcpdump on the pppoeX interface (tcpdump -n -I pppoeX) or on the Ethernet device the PPPoE interface is created on.
Depending on what we see there we may also want to try Dtrace to see what's going on in the if_pppoe code (dtrace -n 'fbt:if_pppoe::', terminate with Ctrl-C, just like tcpdump). -
Right it could easily be traffic causing the recorded packet loss. Though it's more common to see upload traffic in that scenario.
What bandwidth is your WAN supposed to be in each direction?
Are you using a custom gateway monitoring IP? The gateway itself can often drop packets when loaded so it's worth trying something external like 8.8.8.8 or 1.1.1.1.
Can you trigger packet loss by running a speedtest for example?
-
@kprovost, thanks I can do that. Should I run tcpdump just during the state where the system is locked up with WAN down or under normal use?
@stephenw10 I'm monitoring 1.1.1.1 for the gateway. I have 3gps down/1.5 up fibre. I can't reproduce this with a speed test. On both pppoe kernels I can get 1 up/down (limited by the nic) sustained without issues and < 40% CPU usage. It's only on the if_pppoe kernel that seems to run into issues within a day at random. By the timing it almost seems like the high traffic happens after pppoe drops, like it is accumulating during that time when pppoe is down? (I'm not sure if that makes sense at all, but the traffic spike happened minutes after I initially lost Internet).
I'm running pfsense bare metal on the qotom box... I really hope it's not a hardware issue as I've been running this machine 24/7 for 5 years without issue on earlier pfsense versions.
-
@eldest said in periodic packet loss with new if_pppoe backend + high interrupts (post CE 2.8.0 upgrade):
but the traffic spike happened minutes after I initially lost Internet)
As you understand, MINUTES of accumulated high bandwidth needs huge buffers to store it.
Seconds, maybe, but minutes? . If you had, say a couple of streaming servers, serving a couple hundred clients, maybe, but from what you say this isn't definitely the case. -
Run the dump when the issue is happening if you can.
Yup so ~500Mbps down and no significant up should be no problem on that WAN, no where near filling it.
Unless.... it's a flood/attack of some sort so 500Mbps of tiny packets could overwhelm the ability of the firewall to filter or even forward packet from a purely PPS perspective.
No idea why that would only happen with if_pppoe though.
-
@netblues Understood, it just looks like it from the timing.
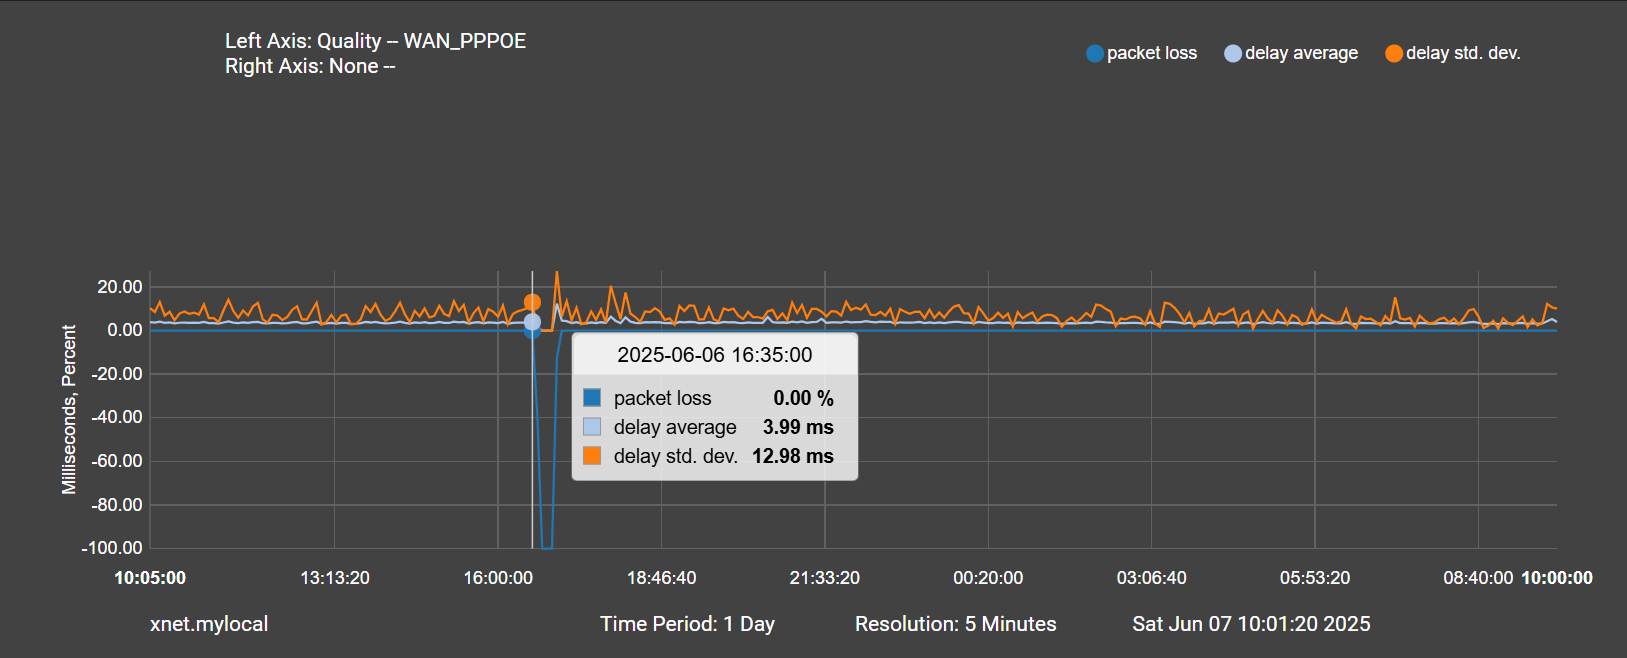
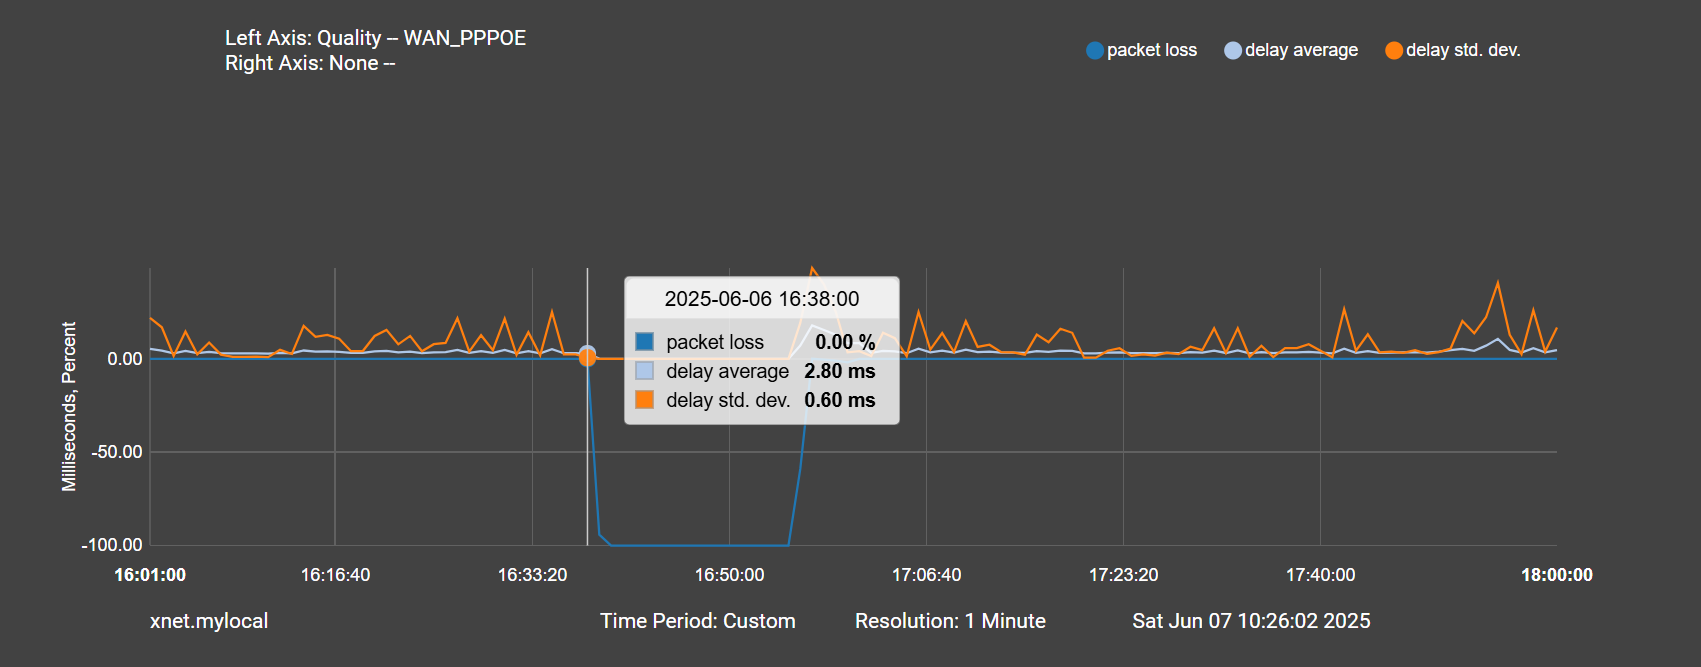
Here is the packet loss beginning at 16:35:
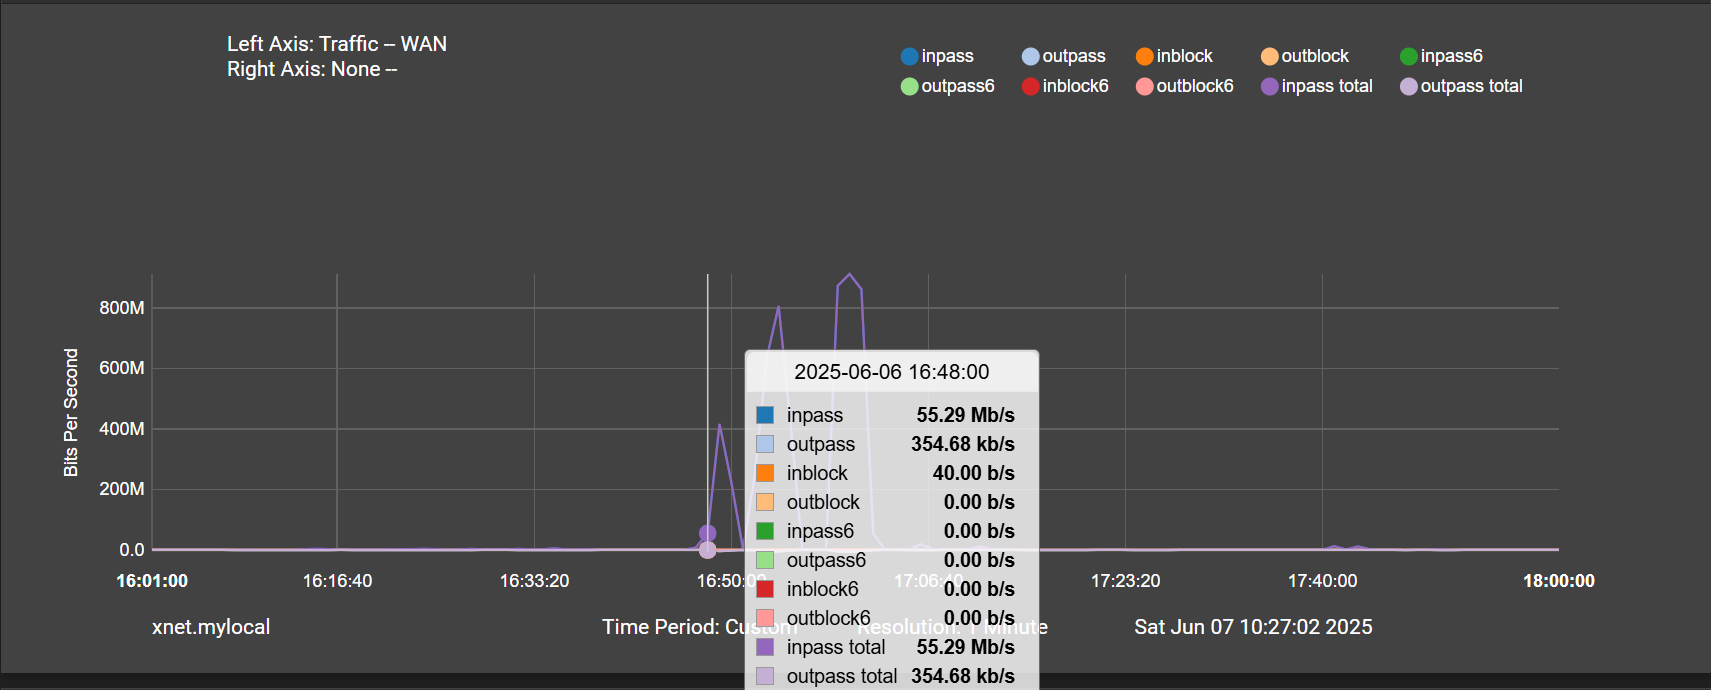
And here is the beginning of the spike in traffic at 16:45:
Just seems a bit odd to me that its a spike in traffic minutes after pppoe is completely down and during a time when I had no internet. I guess what I'm getting at is the traffic spike seems more like a symptom given that it lags the drop in pppoe by such a long time, but maybe the graphs aren't to believed... not sure
-
The RRD files average more the further back you go. You may be seeing some averaging there that hides the actual times involved.
You can try to use a custom graph display value to show, maybe, only between 16.30 and 17.00 at the highest resolution available.
-
@stephenw10 Thanks for that suggestion, I had no idea I could truncate the plots like that.
Here is a zoomed in version. Again PPPOE drops at 16:38:
Then 10 minutes later is the traffic spike:
And the precursor to all of this happening is an anomalously high system load, followed by high interrupts during the pppoe down event, nearly for 10 minutes before the high traffic:
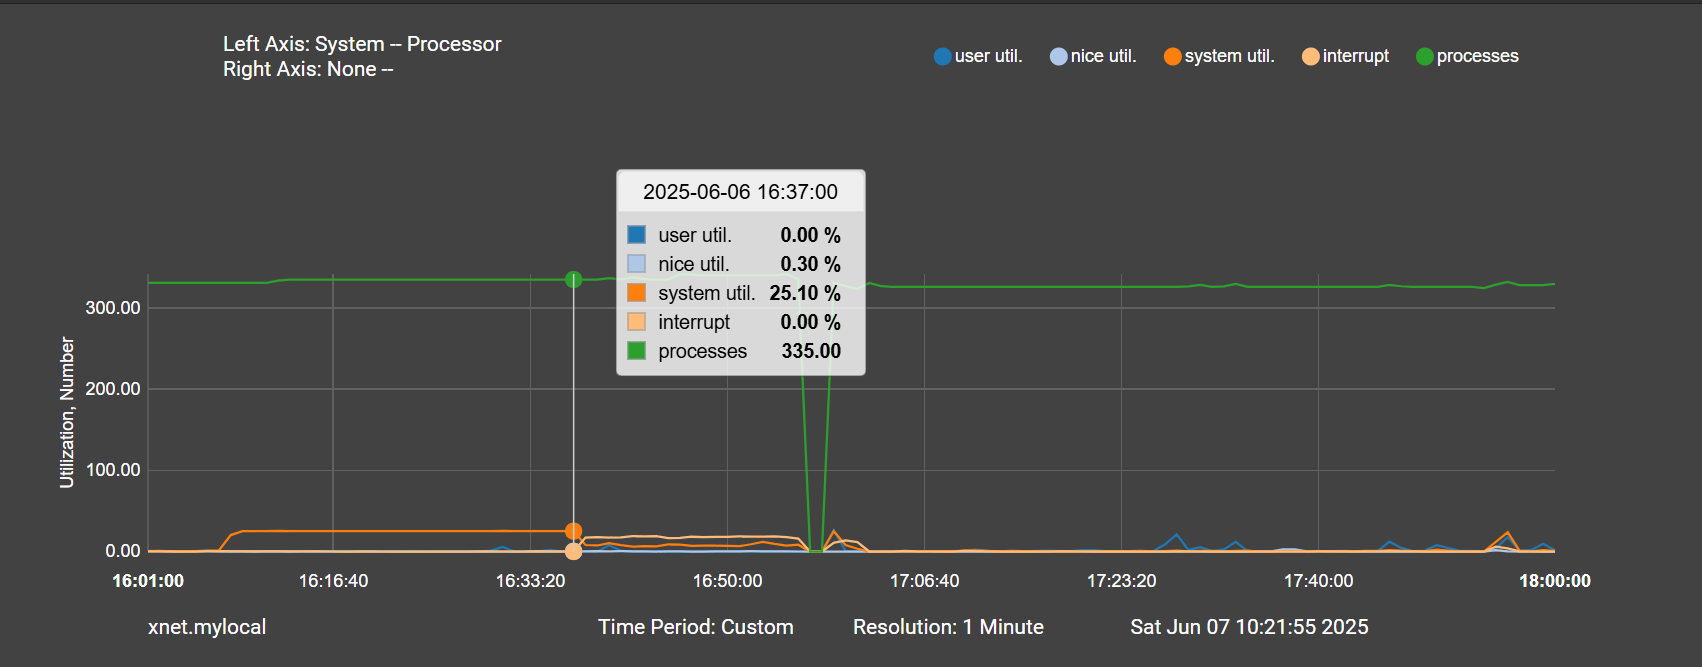
This really makes me think the traffic isn't the issue. The high interrupts happen 10 minutes before any traffic on those plots.
-
For bonus points you can show both plots on the same graph as left and right axis.

But yes I agree. The traffic starts to look like a symptom. Maybe something looping. It would still be very useful to get a pcap of it if you can.
-
The plot thickens. I was able to catch the system in the state of high cpu usage prior to losing internet:
last pid: 38892;  load averages:    2.65,    2.53,    2.46  up 1+09:32:04    07:38:38
316 threads:   6 running, 292 sleeping, 17 waiting, 1 lock
CPU:  0.7% user,  0.9% nice,  6.6% system,  0.3% interrupt, 91.5% idle
Mem: 196M Active, 837M Inact, 993M Wired, 1778M Free
ARC: 281M Total, 92M MFU, 170M MRU, 50K Anon, 2058K Header, 16M Other
     221M Compressed, 606M Uncompressed, 2.74:1 Ratio
Swap: 1024M Total, 1024M Free

  PID USERNAME    PRI NICE   SIZE    RES STATE    C   TIME    WCPU COMMAND
   11 root        187 ki31     0B    64K CPU3     3  32.6H 100.00% [idle{idle: cpu3}]
   11 root        187 ki31     0B    64K RUN      1  32.4H 100.00% [idle{idle: cpu1}]
   11 root        187 ki31     0B    64K CPU0     0  32.3H  99.56% [idle{idle: cpu0}]
10039 unbound     -56    0    92M    60M RUN      2 280:19  66.80% /usr/local/sbin/unbound -c /var/unbound/unbound.conf{unbound}
It starts with unbound at extremely high usage, then slowly degrades from there. No anomalies in the DNS resolver logs. In fact, the only warning I can see in logs at all is from KEA:
WARN [kea-dhcp4.dhcpsrv.0x4db1bc12000] DHCPSRV_MT_DISABLED_QUEUE_CONTROL disabling dhcp queue control when multi-threading is enabled.WARN [kea-dhcp4.dhcp4.0x4db1bc12000] DHCP4_RESERVATIONS_LOOKUP_FIRST_ENABLED Multi-threading is enabled and host reservations lookup is always performed first.Maybe this is the issue described in this post:
https://forum.netgate.com/topic/197613/pfsense-ce-2-8-0-kea2unbound-causes-high-cpu-load-even-when-dns-registration-is-disabled? Same CPU and similar symptoms.
-
Do you have pfBlockerNG enabled with a bunch of DNS-BL lists? That can cause a problem.
If you do then try using Python mode in pfBlocker. That would prevent it.
That's unrelated to if_pppoe though. Maybe it just a coincidence?