periodic packet loss with new if_pppoe backend + high interrupts (post CE 2.8.0 upgrade)
-
@eldest said in periodic packet loss with new if_pppoe backend + high interrupts (post CE 2.8.0 upgrade):
but the traffic spike happened minutes after I initially lost Internet)
As you understand, MINUTES of accumulated high bandwidth needs huge buffers to store it.
Seconds, maybe, but minutes? . If you had, say a couple of streaming servers, serving a couple hundred clients, maybe, but from what you say this isn't definitely the case. -
Run the dump when the issue is happening if you can.
Yup so ~500Mbps down and no significant up should be no problem on that WAN, no where near filling it.
Unless.... it's a flood/attack of some sort so 500Mbps of tiny packets could overwhelm the ability of the firewall to filter or even forward packet from a purely PPS perspective.
No idea why that would only happen with if_pppoe though.
-
@netblues Understood, it just looks like it from the timing.
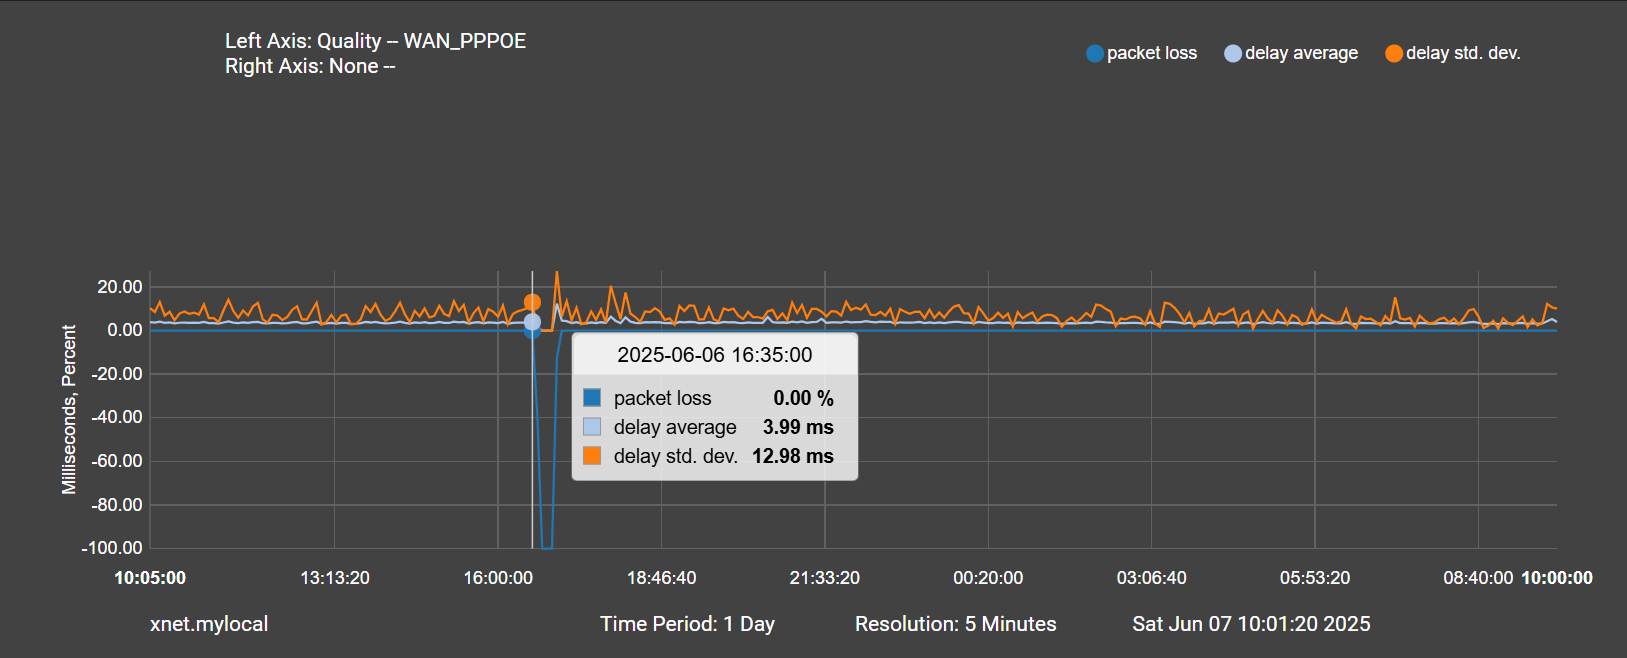
Here is the packet loss beginning at 16:35:
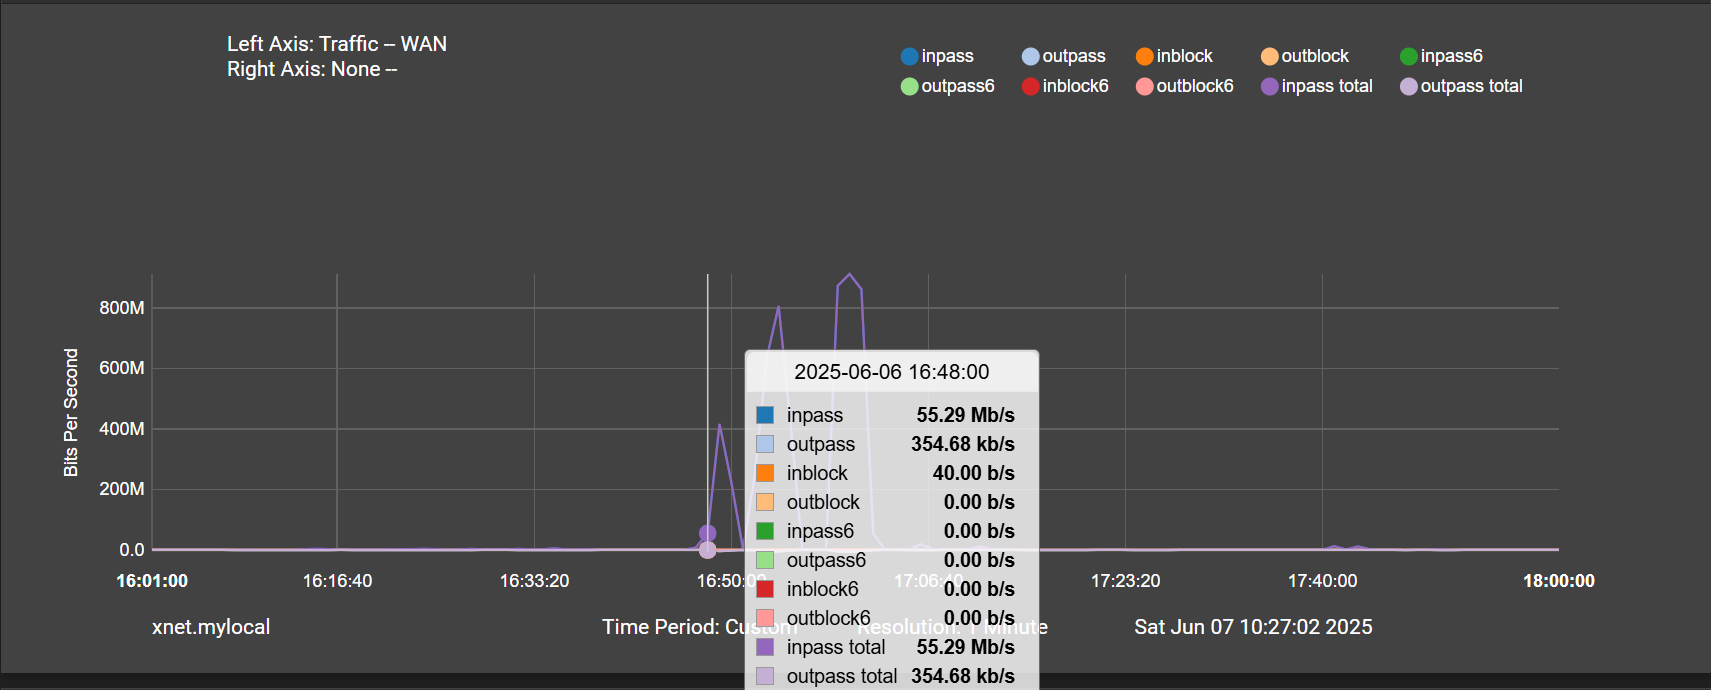
And here is the beginning of the spike in traffic at 16:45:
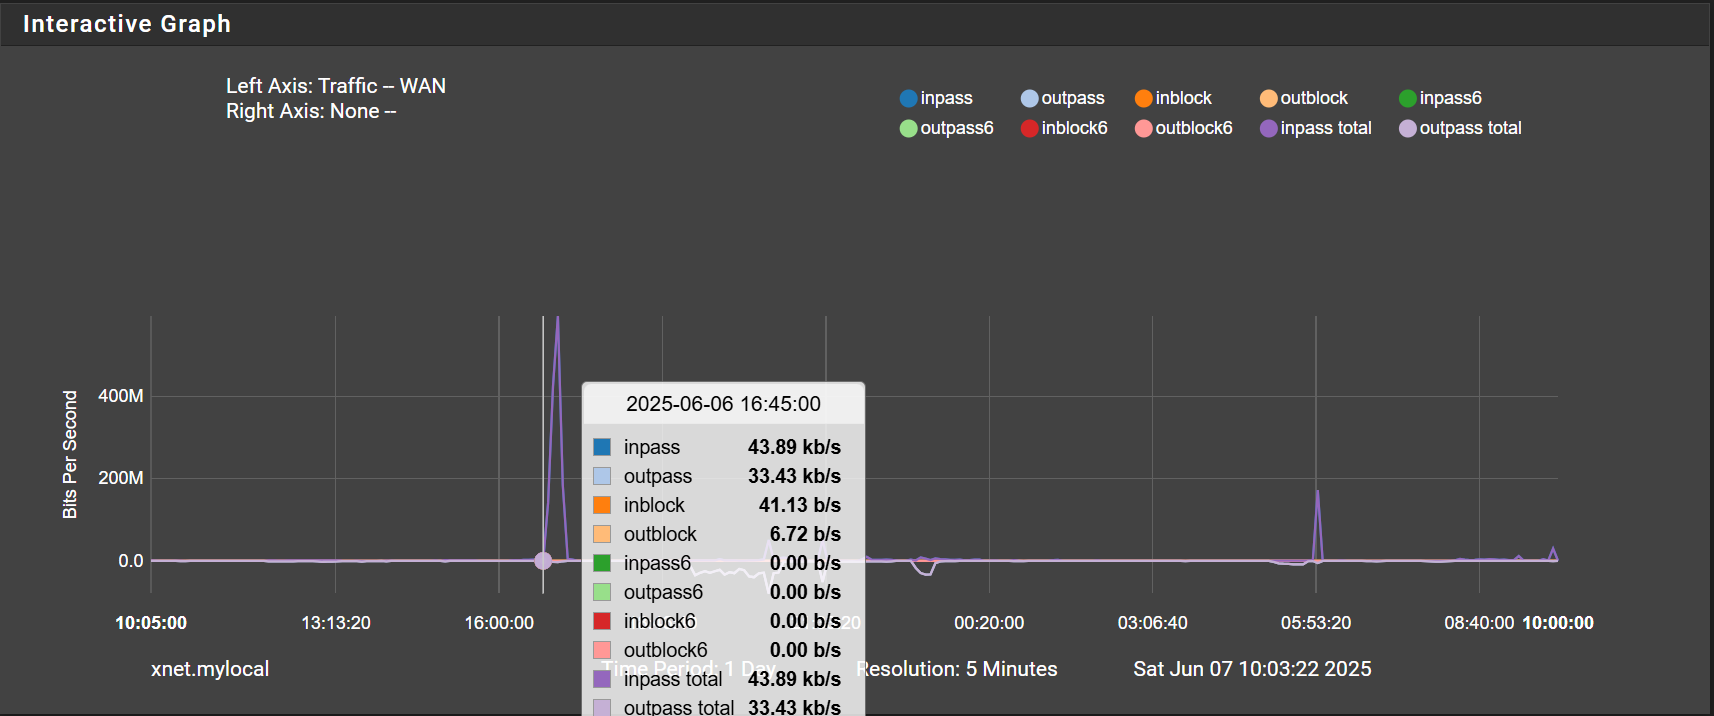
Just seems a bit odd to me that its a spike in traffic minutes after pppoe is completely down and during a time when I had no internet. I guess what I'm getting at is the traffic spike seems more like a symptom given that it lags the drop in pppoe by such a long time, but maybe the graphs aren't to believed... not sure
-
The RRD files average more the further back you go. You may be seeing some averaging there that hides the actual times involved.
You can try to use a custom graph display value to show, maybe, only between 16.30 and 17.00 at the highest resolution available.
-
@stephenw10 Thanks for that suggestion, I had no idea I could truncate the plots like that.
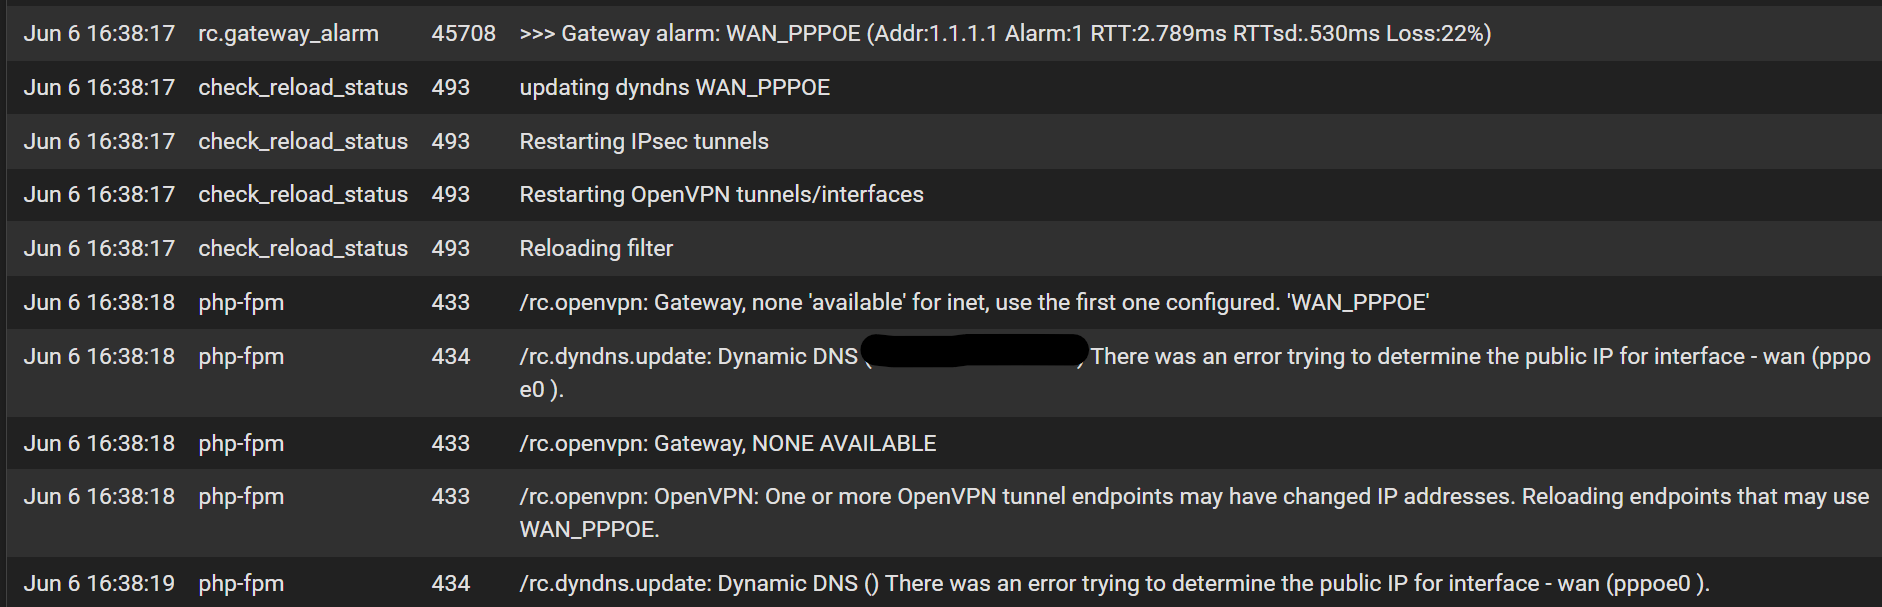
Here is a zoomed in version. Again PPPOE drops at 16:38:
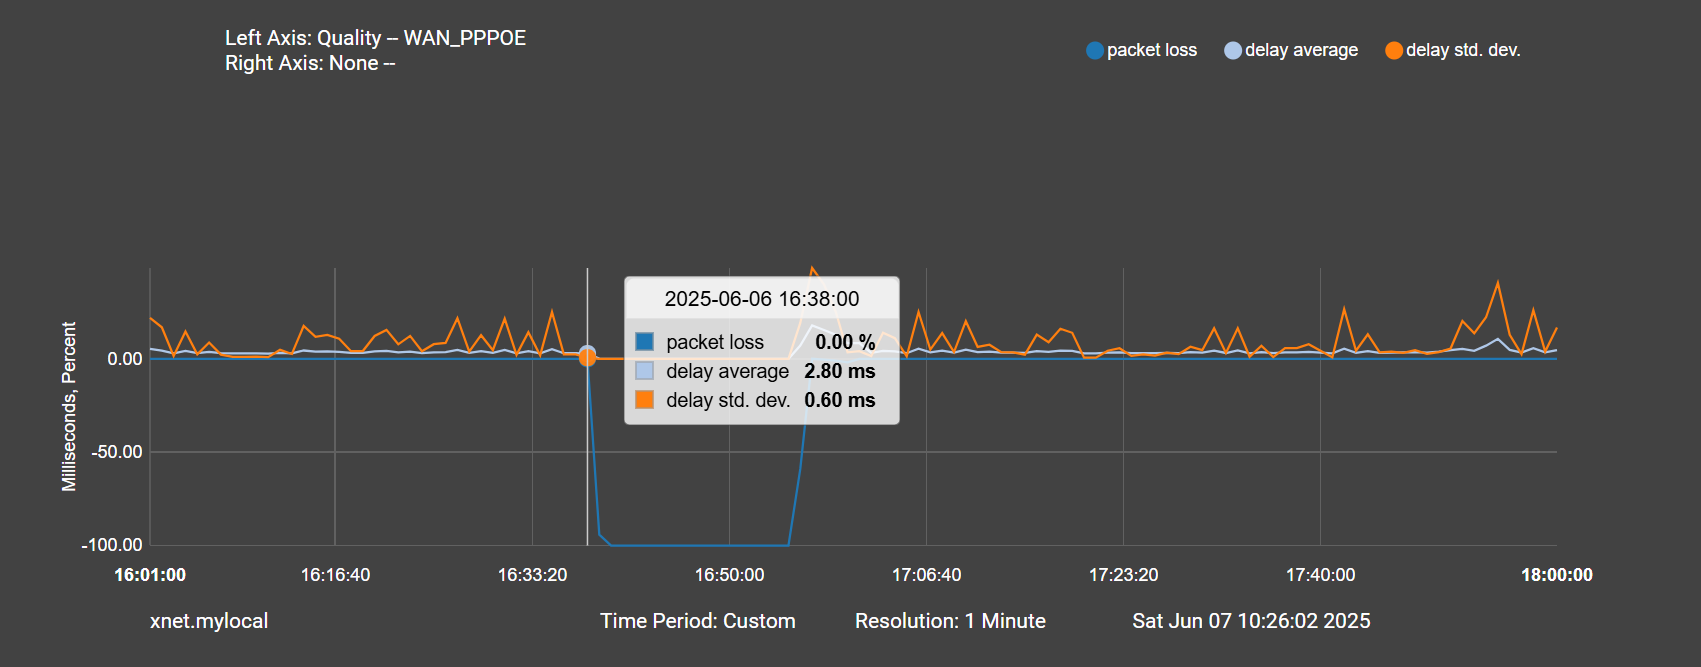
Then 10 minutes later is the traffic spike:
And the precursor to all of this happening is an anomalously high system load, followed by high interrupts during the pppoe down event, nearly for 10 minutes before the high traffic:
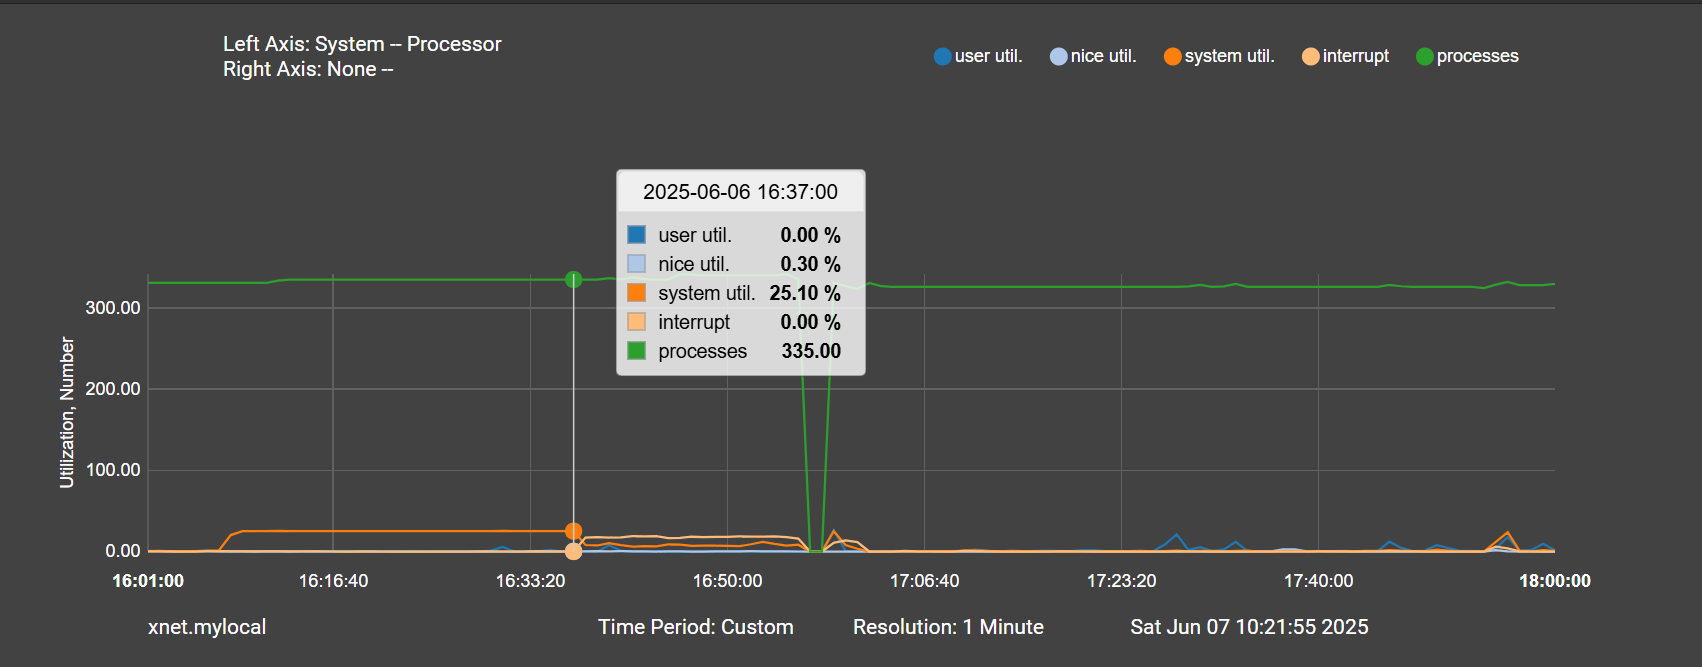
This really makes me think the traffic isn't the issue. The high interrupts happen 10 minutes before any traffic on those plots.
-
For bonus points you can show both plots on the same graph as left and right axis.

But yes I agree. The traffic starts to look like a symptom. Maybe something looping. It would still be very useful to get a pcap of it if you can.
-
The plot thickens. I was able to catch the system in the state of high cpu usage prior to losing internet:
last pid: 38892;  load averages:    2.65,    2.53,    2.46  up 1+09:32:04    07:38:38
316 threads:   6 running, 292 sleeping, 17 waiting, 1 lock
CPU:  0.7% user,  0.9% nice,  6.6% system,  0.3% interrupt, 91.5% idle
Mem: 196M Active, 837M Inact, 993M Wired, 1778M Free
ARC: 281M Total, 92M MFU, 170M MRU, 50K Anon, 2058K Header, 16M Other
     221M Compressed, 606M Uncompressed, 2.74:1 Ratio
Swap: 1024M Total, 1024M Free

  PID USERNAME    PRI NICE   SIZE    RES STATE    C   TIME    WCPU COMMAND
   11 root        187 ki31     0B    64K CPU3     3  32.6H 100.00% [idle{idle: cpu3}]
   11 root        187 ki31     0B    64K RUN      1  32.4H 100.00% [idle{idle: cpu1}]
   11 root        187 ki31     0B    64K CPU0     0  32.3H  99.56% [idle{idle: cpu0}]
10039 unbound     -56    0    92M    60M RUN      2 280:19  66.80% /usr/local/sbin/unbound -c /var/unbound/unbound.conf{unbound}
It starts with unbound at extremely high usage, then slowly degrades from there. No anomalies in the DNS resolver logs. In fact, the only warning I can see in logs at all is from KEA:
WARN [kea-dhcp4.dhcpsrv.0x4db1bc12000] DHCPSRV_MT_DISABLED_QUEUE_CONTROL disabling dhcp queue control when multi-threading is enabled.WARN [kea-dhcp4.dhcp4.0x4db1bc12000] DHCP4_RESERVATIONS_LOOKUP_FIRST_ENABLED Multi-threading is enabled and host reservations lookup is always performed first.Maybe this is the issue described in this post:
https://forum.netgate.com/topic/197613/pfsense-ce-2-8-0-kea2unbound-causes-high-cpu-load-even-when-dns-registration-is-disabled? Same CPU and similar symptoms.
-
Do you have pfBlockerNG enabled with a bunch of DNS-BL lists? That can cause a problem.
If you do then try using Python mode in pfBlocker. That would prevent it.
That's unrelated to if_pppoe though. Maybe it just a coincidence?
-
@stephenw10 I do have pfblocker installed but DNSBL is disabled. Is it possible wan events are triggering DHCP lease renewal causing kea2unbound to cause the same issues in the post linked previously? It's an awesome coincidence that it's the same hardware and same issue.
-
Mmm, it is. And I hate coincidences.
How many DHCP leases do you have? What lease time?
To hit that issue it has to see a renewal rate that eventually exceeds the reload rate that Unbound can manage. Which seems unlikely on that hardware.
-
@stephenw10 I just checked. 11 leases, default lease time of 7200 seconds. I haven't changed my network topology or devices since the upgrade so I don't think I'm getting anywhere near the reload rate limit.
-
Mmm, yeah that's nothing on that hardware.
Does Unbound log a bunch of restarts in the DNS log when it happens?
-
@stephenw10 nothing at all in the logs. I've now tried all permutations of KEA/ISC, if_pppoe and original and I'm running into the same issue so this is a mystery that no longer aligns with the title of this post. Moving off if_pppoe only seems to prolong the time before the crash. I tried a fresh install last night and restore of the config - saw the same system lockup within 10 hours. The symptoms are now very consistent and I can catch the system in this locked state. Unbound first consumes a core and all devices lose internet access. Then the large traffic flow appears from WAN according to the monitoring graphs.
-
Hmm. So how do you have Unbound configured? There's got to be something it's doing that most people don't hit.
You could try turning up the logging in Unbound.
Is it accidentally listening on WAN? Are you being used as part of a DNS amplification attack maybe?
-
@stephenw10 I'll try increasing the log verbosity - I've actually never touched the unbound settings so they should be default.
I surely hope it's not some sort of attack - these problems coincide to within a few hours of upgrading from 2.7.2 -> 2.8.0 and also occur on a fresh install using the installer.
Is there anything you suggest I do while the system is locked up in this state to get some more information? I'm returning home to the system in this state right now and I can occasionally reach the gui.
-
Check the Unbound Status page (Status > DNS Resolver). Compare those values when this is happening and normal running.
But if you turn up the logging you would see some huge flood of requests if that's what's happening.
-
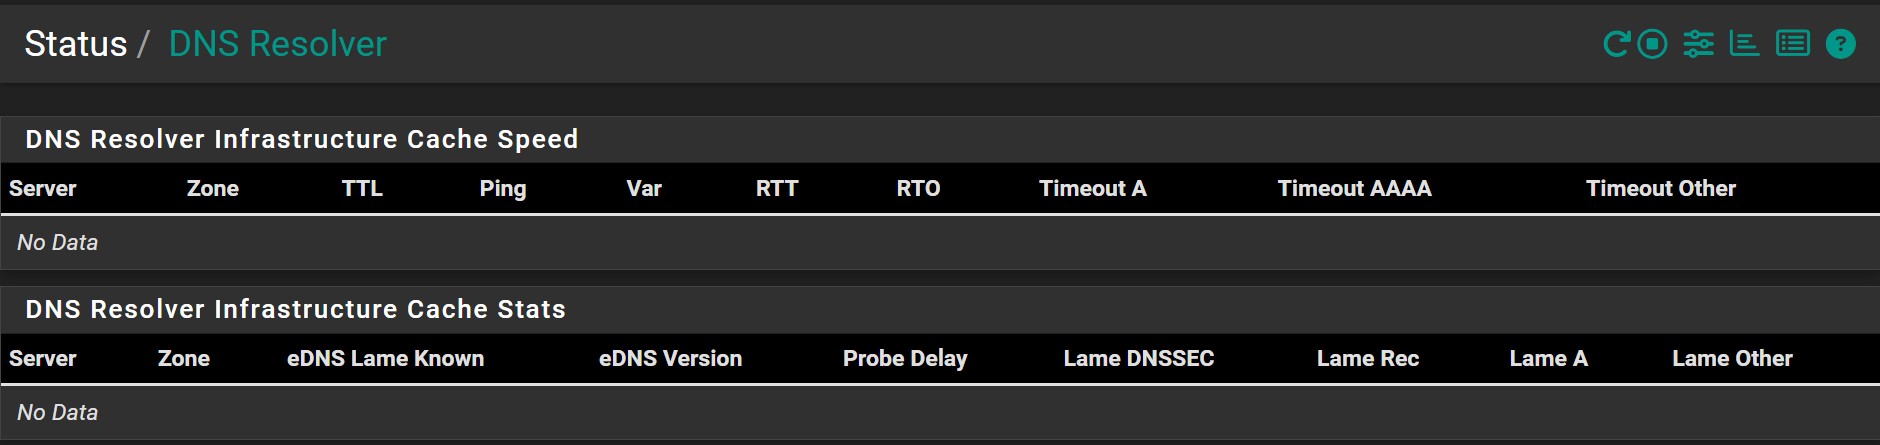
@stephenw10 Its currently stuck in this state, and this is all I see in DNS Resolver status (no data):
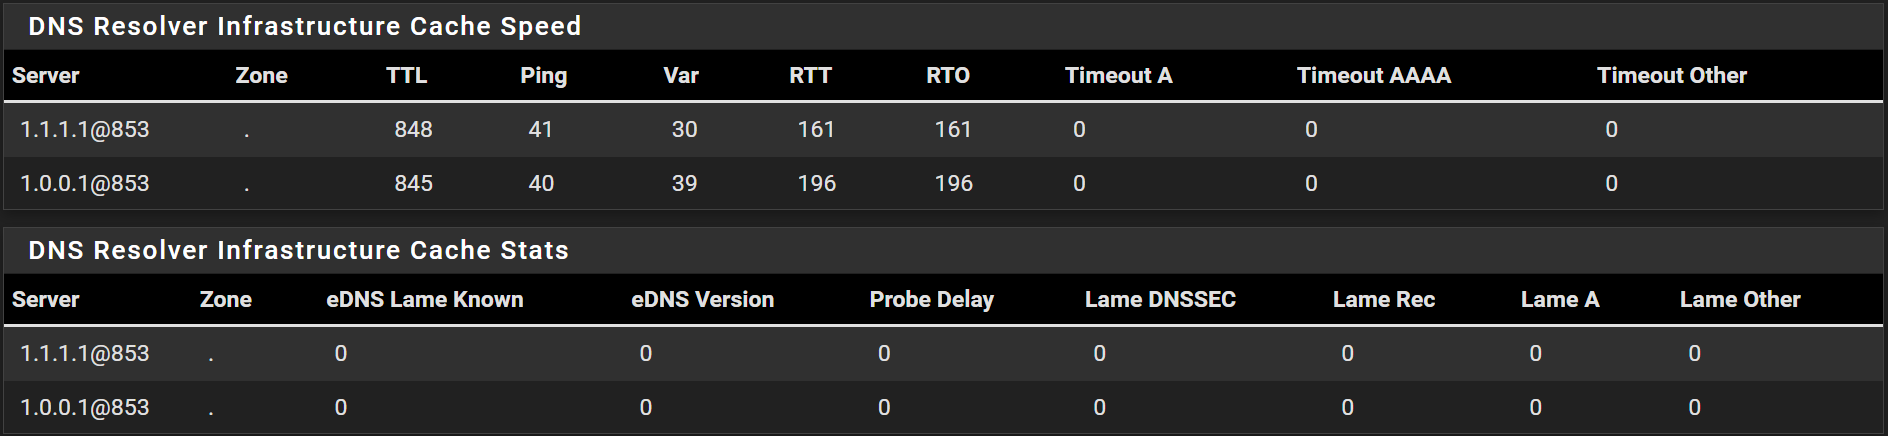
After a reboot I see this:
-
Hmm, so it can't pull stats data from Unbound at that time. It must be very highly loaded.
I would try turning up the logging. It will probably create a very large ammount of logs.
You could also check the states or run a packet capture to try and see what the traffic spike is.
Also check the number of states shown in the monitoring graphs. Does that also spike at the time?
-
Thanks stephenw10. I'm back after a few months of troubleshooting with no success, but some more questions if you could help guide me on this troubleshooting journey.
I purchased new hardware, now with a fresh install of CE 2.8.1 and am seeing the same issues. Disabling gateway actions has eliminated the periodic packet loss panic causinng the system lockup until a reboot, but I'm still seeing unbound suddenly consume a core and become unresponsive.
Curiously, I'm not seeing anything anomalous in unbound logs over multiple failures. However, one thing I'm curious about is if updating url ip aliases might be connected to this failure. Since pfsense 2.7.2 and prior I have had a cron job running
/usr/bin/nice -n20 /etc/rc.update_alias_url_dataevery 5 minutes. This never posed an issue before, but it is the only 'custom' action I have running on both pfsense boxes that have unbound failing after a few days of uptime.
Besides this, now that I have narrowed the issue down to unbound, is there anything else you would suggest I try? States do not noticeably increase during the failure from my monitoring.
-
Hmm, you added that cronjob yourself? Any particular reason?
Do you have an url aliases with a large number of entries?