Intel I350-T4 Errors
-
Hi All,
First off, let me pre-face this with the fact I am 99% sure this is a faulty unit but want to double check there are no known issues or problems that could cause what i am seeing that i have not considered so apologies if this seems like a bit of a waste thread
I have purchased an intel i350-T4 to put into a new pfsense backup machine I have built. My original card had this same issue so i sent it back for an RMA and the second card is doing the same so i want to double check i'm not missing anything
I'm running pfsense 2.8.0 as a VM within Truenas Scale 24.10.2.2, i am also posting on the Truenas side just in case anyone there is aware of a KVM issue with this card model
The card has been installed and works without issues for between 6 and 9 hours, even running as a temporary master with hundreds of gigabytes of traffic sent through
Randomly all 4 ports on the NIC with start showing trillions of errors in netstat -i and i immediately lose access to the web ui but the console and machine are fine
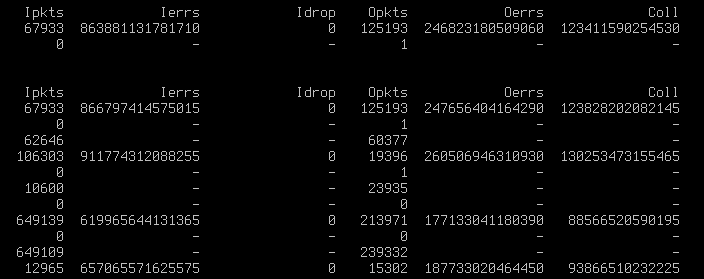
The large errors numbers are on all of the main links. If i swap that card for a known good I340-T4, it works flawlessly for weeks without a single error, but this specific card model seems to do it
It is a genuine card from what i can tell with the intel logo on the PCB but both of the 350's are refurbished units from the same company
I have ensured that hardware checksum, tcp segmentation, and large receive are all disabled as they are in my primary system and now wanted to see if anyone more knowledgeable may have any further ideas of things i can try before RMA'ing a second card?
Many thanks in advance
Jamie
-
Are you passing through the hardware to pfSense?
-
@stephenw10 I am yes
This is full pci passthrough, no virtual nics etc.
-
Hmm, that sure looks like a problem then!
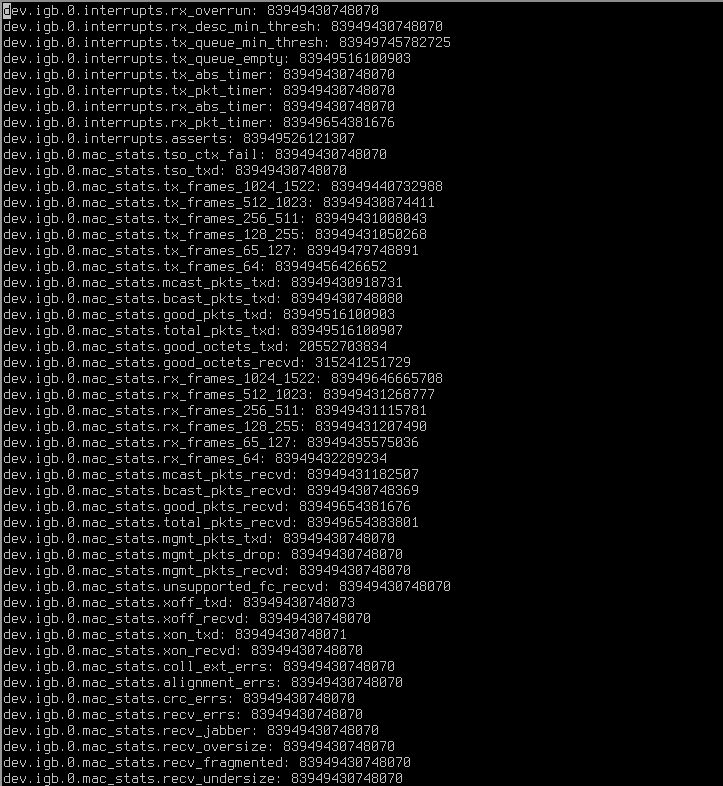
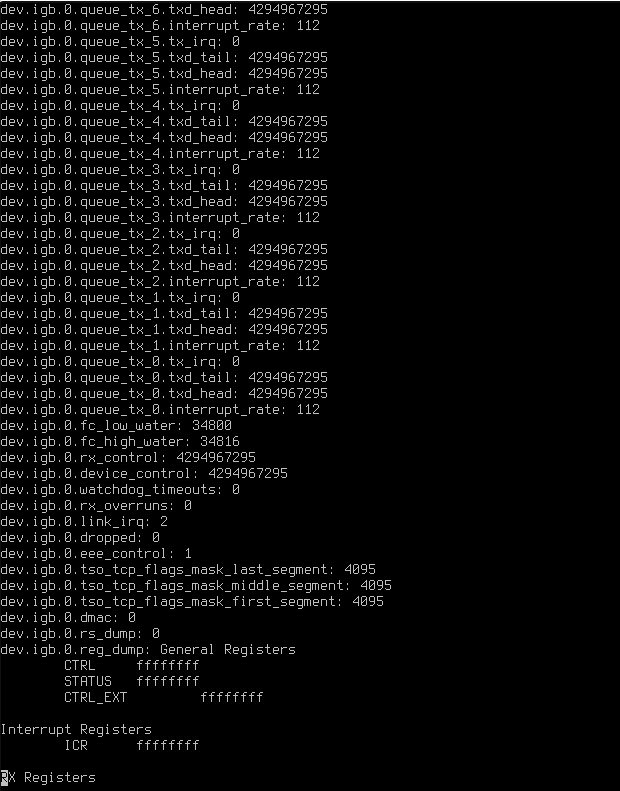
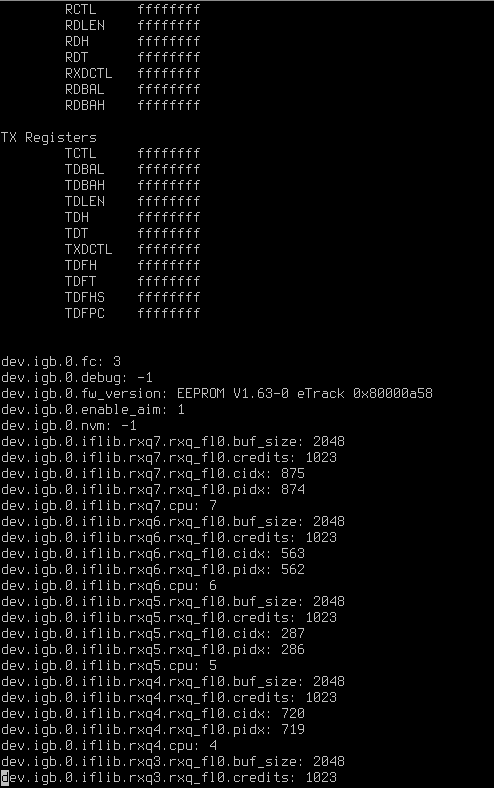
Anything in the sysctl stats showing the error type?:
sysctl dev.igb.0 -
Annoyingly i had to restart the VM to try and check firmware versions but will wait for it to crash again and re-test, its likely to be later today but if not, i will grab the output and see what's going on
Is there anything specific i should be looking for in that output?
-
There are a number of sysctls for different errors like:
dev.igb.0.watchdog_timeouts: 0 dev.igb.0.rx_overruns: 0 ... dev.igb.0.dropped: 0 ... dev.igb.0.mac_stats.coll_ext_errs: 0 dev.igb.0.mac_stats.alignment_errs: 0 dev.igb.0.mac_stats.crc_errs: 0 dev.igb.0.mac_stats.recv_errs: 0 dev.igb.0.mac_stats.recv_jabber: 0 dev.igb.0.mac_stats.recv_oversize: 0 dev.igb.0.mac_stats.recv_fragmented: 0 dev.igb.0.mac_stats.recv_undersize: 0 dev.igb.0.mac_stats.recv_no_buff: 0 dev.igb.0.mac_stats.recv_length_errors: 0 dev.igb.0.mac_stats.missed_packets: 0 dev.igb.0.mac_stats.defer_count: 0 -
As a quick update for anyone keeping an eye on this, as per usual, you ask for help and the system refuses to play ball when you need it to
After days of repeatedly failing after 6 to 9 hours, the system is currently at 24 hours with no errors
The host has not been rebooted, it has not been re-seated or anything else like that, no configs have been altered.The only thing i did yesterday when checking the firmware version was boot it into a live ubuntu, turn on "FLASHENABLE" as it was turned off and hid the version, and reflash the PXE firmware to the latest intel one, i did not flash the NVM as i was not sure how to do that
All of this was done in the same vm just booting a ubuntu iso, no passthrough changes so it was identical. Once done i shut down the vm, removed the iso, and started it again so no host changes
In theory, i am not using PXE so that firmware should make no difference but right now, this is the longest its managed and i have run 200GB of data through it
Hopefully this fixes it but i'm unsure why it would if it does
Regards,
Jamie -
Hmm, hard to imagine a PXE firmware having any effect but....
-
I completely agree
The only consideration i did have was if enabling flashing made a difference
This is more of an old KVM thing i have had to do in the past but sometimes it runs a shadow rom to pass through devices so it resets correctlyI used to have to do this for GPU's back on ubuntu but i'm unsure how Truenas does this
If they are trying a shadow rom and the device is blocking flashing and detecting some kind of ROM change, i wonder if that could cause it?Its a massive stretch though at this point, but i know the I340 i had is much less picky with firmware than the I350's
-
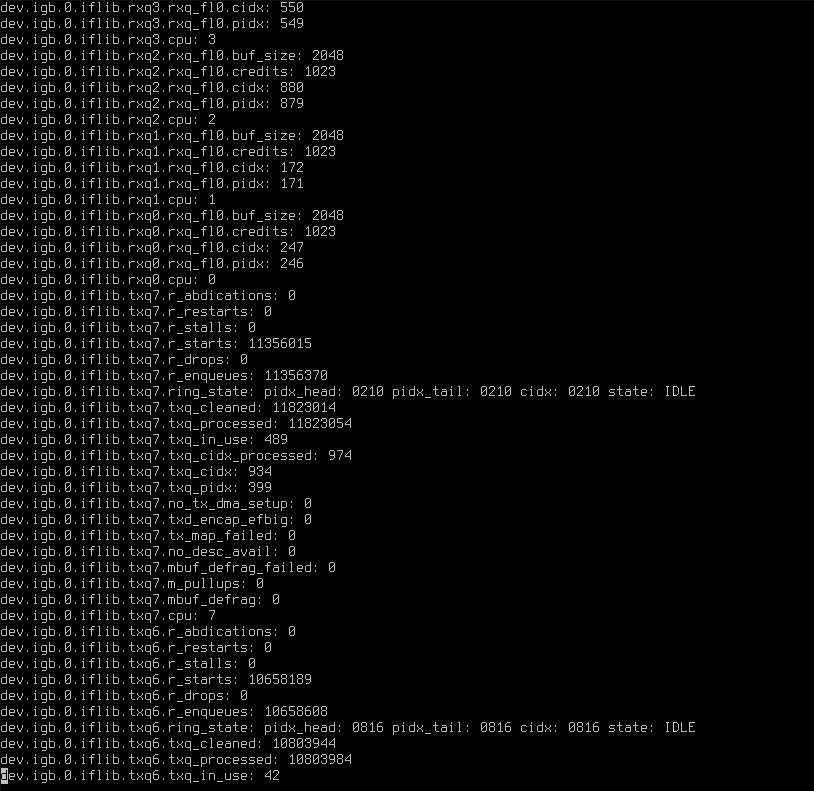
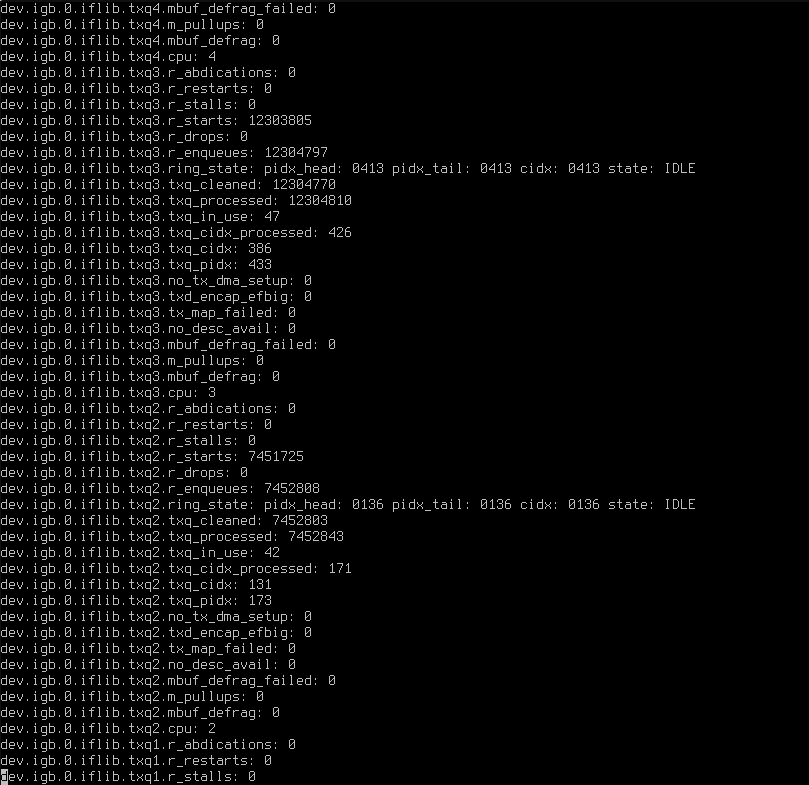
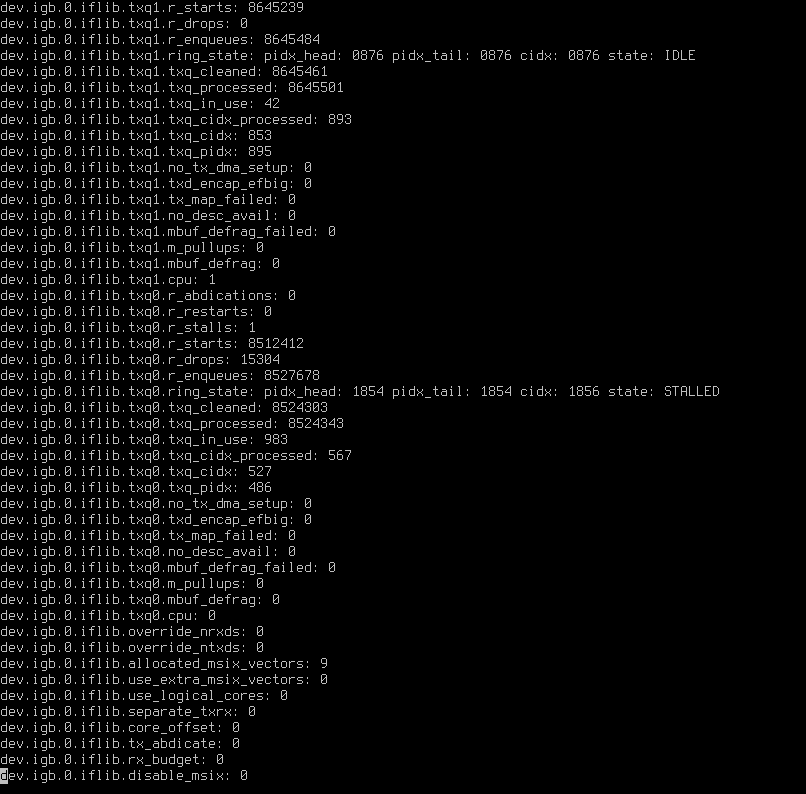
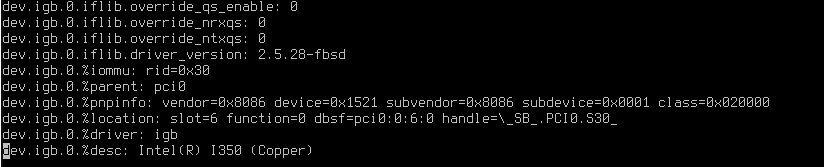
Ok so i thought it was going well but sadly it crashed last night, i have left the vm up in case i need to run further commands but because of this, i have no easy way to copy the command outputs so apologies in advance for the screenshots


-
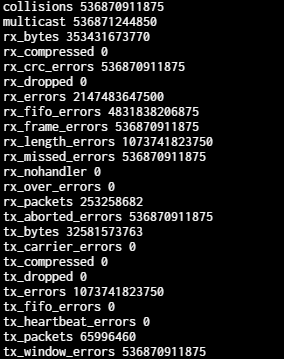
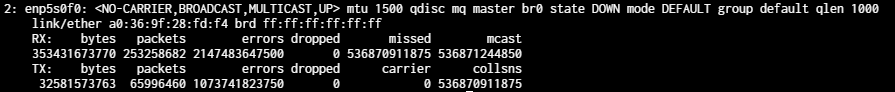
Hmm, those values for interrupts and mac_stats look bogus. Like the driver or firmware are not returning real data or are returning bad data. That 'feels' like the firmware is failing.
Does it show bogus values for all 4 ports?
Does it show real data after a reboot? Does it require a full power cycle?
-
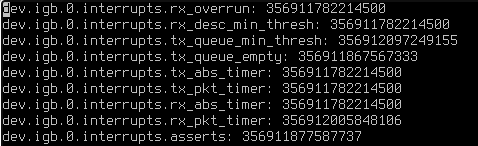
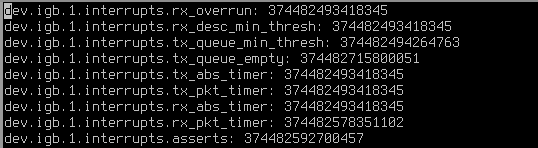
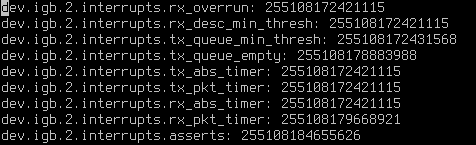
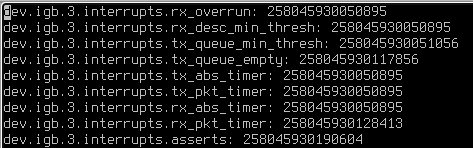
Yep, bogus values on all 4 ports and they all start at the exact same time as far as I can tell.
That makes me think its less likely to be a driver but I may be wrong.Simply restarting the VM fixes the issues and it will go back to normal until it happens again.
To my knowledge, even a vm reboot does trigger the device to reset so it would make sense that this fixes it if it was firmware.I have left the machine up with the nic broken just in case its worth me running some commands to see if anything can be ruled out.
For example, rebinding/resetting the igb driver etc. to see if it magically fixes without a device resetIts not something that I am familiar with so I'm hoping for a little guidance from the experts here in hopes that the debugging may help someone else in a similar situation down the line.
-
Hmm, seems like a driver problem if a reboot fixes it. If it was firmware I'd expect it to require a full power cycle. Unless the driver resets the card somehow (and is still able to do so).
I'm not really sure what we could do here though. There is a kmod igb driver but we don't build it so it would tricky to test.
The i350-T4 is a pretty common NIC. Seeing two fail the same way seems unlikely. It seems likely either a problem with the virtualisation or something low level with the hardware it's installed in.
Can you try running it without the hardware pass-though? That would at least confirm the hardware compatibility.
-
I could potentially try leaving the nic on the host and adding them as virtual nics if that's what you mean?
Edit: For the sake of sanity, i have left the nic on the host and passed each port through to the vm using virtio drivers so they shopw up as vtnet. I guess if this passes then we know its got to be an issue with the passthrough to pfsense?
As you say, its a common nic so should not be an issue within pfsense itself
-
Yup exactly that. If it's some low level hardware issue it will still fail.
Yes, I doubt this is a pfSense/FreeBSD issue directly because i350 is commonly used. At one time that was probably the recommended choice.
-
Thanks for all the replies and quick help with this, its really appreciated!
I will wait and see what happens in this instance and will report back as soon as I hit an issue or it starts hitting long uptime counts
-
Time for an update, sadly not a good one, i know this is getting a little off topic for pfSense directly but it may still help others
Less than 48 hours and the same issues has happened on the host, spot the quad nic
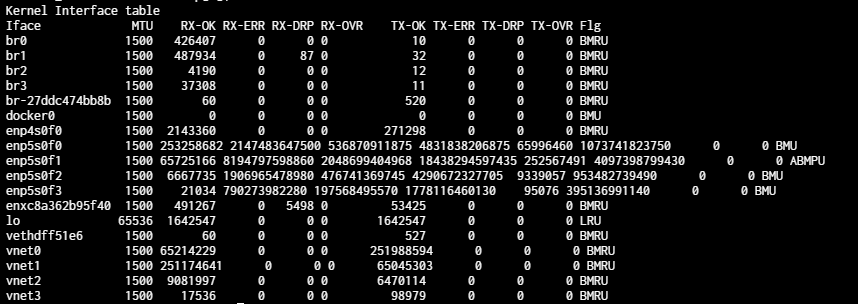

enp4s0f0 and f1 are my intel 10gb NICs but they use ixgbe. I tried reloading igb and had no luck
Looking through dmesg i get the following:[168683.759683] igb 0000:05:00.3 enp5s0f3: malformed Tx packet detected and dropped, LVMMC:0xffffffff [168685.039818] igb 0000:05:00.0 enp5s0f0: malformed Tx packet detected and dropped, LVMMC:0xffffffff [168685.807653] igb 0000:05:00.1 enp5s0f1: malformed Tx packet detected and dropped, LVMMC:0xffffffff [168687.087693] igb 0000:05:00.2 enp5s0f2: malformed Tx packet detected and dropped, LVMMC:0xffffffff [168687.855687] igb 0000:05:00.3 enp5s0f3: malformed Tx packet detected and dropped, LVMMC:0xffffffff [168688.879965] igb 0000:05:00.0 enp5s0f0: malformed Tx packet detected and dropped, LVMMC:0xffffffff [168689.903630] igb 0000:05:00.1 enp5s0f1: malformed Tx packet detected and dropped, LVMMC:0xffffffff [168690.927699] igb 0000:05:00.2 enp5s0f2: malformed Tx packet detected and dropped, LVMMC:0xffffffff [168691.951708] igb 0000:05:00.3 enp5s0f3: malformed Tx packet detected and dropped, LVMMC:0xffffffff [168692.975871] igb 0000:05:00.0 enp5s0f0: malformed Tx packet detected and dropped, LVMMC:0xffffffff [168693.999640] igb 0000:05:00.1 enp5s0f1: malformed Tx packet detected and dropped, LVMMC:0xffffffff [168695.023693] igb 0000:05:00.2 enp5s0f2: malformed Tx packet detected and dropped, LVMMC:0xffffffff [168695.791663] igb 0000:05:00.3 enp5s0f3: malformed Tx packet detected and dropped, LVMMC:0xffffffff [168696.815772] igb 0000:05:00.0 enp5s0f0: malformed Tx packet detected and dropped, LVMMC:0xffffffff [168697.839653] igb 0000:05:00.1 enp5s0f1: malformed Tx packet detected and dropped, LVMMC:0xffffffff [168698.863696] igb 0000:05:00.2 enp5s0f2: malformed Tx packet detected and dropped, LVMMC:0xffffffff [168699.887665] igb 0000:05:00.3 enp5s0f3: malformed Tx packet detected and dropped, LVMMC:0xffffffff [168700.437650] igb 0000:05:00.3: removed PHC on enp5s0f3 [168700.911656] igb 0000:05:00.0 enp5s0f0: malformed Tx packet detected and dropped, LVMMC:0xffffffff [168701.935637] igb 0000:05:00.1 enp5s0f1: malformed Tx packet detected and dropped, LVMMC:0xffffffff [168702.179403] igb 0000:05:00.3 enp5s0f3 (unregistering): left allmulticast mode [168702.179406] igb 0000:05:00.3 enp5s0f3 (unregistering): left promiscuous mode [168702.468717] igb 0000:05:00.2: removed PHC on enp5s0f2 [168702.959649] igb 0000:05:00.2 enp5s0f2: malformed Tx packet detected and dropped, LVMMC:0xffffffff [168704.702443] igb 0000:05:00.2 enp5s0f2 (unregistering): left allmulticast mode [168704.702447] igb 0000:05:00.2 enp5s0f2 (unregistering): left promiscuous mode [168704.952707] igb 0000:05:00.1: removed PHC on enp5s0f1 [168705.007729] igb 0000:05:00.0 enp5s0f0: malformed Tx packet detected and dropped, LVMMC:0xffffffff [168705.775759] igb 0000:05:00.1 enp5s0f1: malformed Tx packet detected and dropped, LVMMC:0xffffffff [168707.776784] igb 0000:05:00.0: removed PHC on enp5s0f0 [168708.847740] igb 0000:05:00.0 enp5s0f0: malformed Tx packet detected and dropped, LVMMC:0xffffffff [168710.590634] igb 0000:05:00.0 enp5s0f0 (unregistering): left allmulticast mode [168710.590637] igb 0000:05:00.0 enp5s0f0 (unregistering): left promiscuous mode [168712.799086] igb: Intel(R) Gigabit Ethernet Network Driver [168712.799089] igb: Copyright (c) 2007-2014 Intel Corporation. [168712.799121] igb 0000:05:00.0: enabling device (0000 -> 0002) [168712.799290] igb 0000:05:00.0 0000:05:00.0 (uninitialized): PCIe link lost [168712.799522] igb: Failed to read reg 0x18! [168712.799610] WARNING: CPU: 2 PID: 1106121 at drivers/net/ethernet/intel/igb/igb_main.c:745 igb_rd32+0x7c/0x90 [igb] [168712.799706] Modules linked in: igb(E+) vhost_net(E) tun(E) vhost(E) vhost_iotlb(E) macvtap(E) macvlan(E) tap(E) xt_nat(E) xt_tcpudp(E) veth(E) xt_conntrack(E) nft_chain_nat(E) xt_MASQUERADE(E) nf_nat(E) nf_conntrack_netlink(E) nf_conntrack(E) nf_defrag_ipv6(E) nf_defrag_ipv4(E) xfrm_user(E) xt_addrtype(E) nft_compat(E) nf_tables(E) libcrc32c(E) crc32c_generic(E) nfnetlink(E) br_netfilter(E) bridge(E) stp(E) llc(E) nvme_fabrics(E) overlay(E) sunrpc(E) binfmt_misc(E) ntb_netdev(E) ntb_transport(E) ntb_split(E) ntb(E) ioatdma(E) ib_core(E) edac_mce_amd(E) kvm_amd(E) kvm(E) irqbypass(E) ghash_clmulni_intel(E) sha512_ssse3(E) sha256_ssse3(E) sha1_ssse3(E) amdgpu(E) aesni_intel(E) crypto_simd(E) cryptd(E) snd_hda_codec_hdmi(E) rapl(E) drm_exec(E) amdxcp(E) drm_buddy(E) gpu_sched(E) drm_suballoc_helper(E) drm_display_helper(E) snd_hda_intel(E) cec(E) snd_usb_audio(E) snd_intel_dspcfg(E) snd_usbmidi_lib(E) rc_core(E) snd_hda_codec(E) snd_rawmidi(E) snd_seq_device(E) snd_hda_core(E) mc(E) snd_hwdep(E) drm_ttm_helper(E) [168712.799722] snd_pcm(E) wmi_bmof(E) ttm(E) snd_timer(E) sp5100_tco(E) pcspkr(E) drm_kms_helper(E) snd(E) k10temp(E) watchdog(E) soundcore(E) ccp(E) cdc_mbim(E) joydev(E) cdc_wdm(E) sg(E) button(E) evdev(E) loop(E) drm(E) efi_pstore(E) configfs(E) ip_tables(E) x_tables(E) autofs4(E) zfs(POE) spl(OE) efivarfs(E) sr_mod(E) cdrom(E) hid_generic(E) cdc_ncm(E) cdc_ether(E) usbnet(E) usbhid(E) uas(E) hid(E) usb_storage(E) mii(E) sd_mod(E) ahci(E) nvme(E) ahciem(E) xhci_pci(E) libahci(E) xhci_hcd(E) ixgbe(E) nvme_core(E) libata(E) xfrm_algo(E) t10_pi(E) crc32_pclmul(E) mdio_devres(E) usbcore(E) scsi_mod(E) crc32c_intel(E) crc64_rocksoft(E) i2c_piix4(E) usb_common(E) scsi_common(E) crc64(E) crc_t10dif(E) i2c_algo_bit(E) libphy(E) dca(E) crct10dif_generic(E) mdio(E) crct10dif_pclmul(E) crct10dif_common(E) video(E) wmi(E) gpio_amdpt(E) gpio_generic(E) [last unloaded: igb(E)] [168712.800964] RIP: 0010:igb_rd32+0x7c/0x90 [igb] [168712.803497] ? igb_rd32+0x7c/0x90 [igb] [168712.803880] ? igb_rd32+0x7c/0x90 [igb] [168712.805033] ? igb_rd32+0x7c/0x90 [igb] [168712.805228] ? igb_rd32+0x7c/0x90 [igb] [168712.805422] igb_get_invariants_82575+0xa6/0xf00 [igb] [168712.805620] igb_probe+0x3be/0x1520 [igb] [168712.807796] ? __pfx_igb_init_module+0x10/0x10 [igb] [168713.136674] igb 0000:05:00.0: PHY reset is blocked due to SOL/IDER session. [168714.866546] igb 0000:05:00.0: The NVM Checksum Is Not Valid [168715.129000] igb: probe of 0000:05:00.0 failed with error -5 [168715.129479] igb 0000:05:00.1: enabling device (0000 -> 0002) [168715.129619] igb 0000:05:00.1 0000:05:00.1 (uninitialized): PCIe link lost [168715.130133] igb: Failed to read reg 0x18! [168715.130381] WARNING: CPU: 10 PID: 1106121 at drivers/net/ethernet/intel/igb/igb_main.c:745 igb_rd32+0x7c/0x90 [igb] [168715.130642] Modules linked in: igb(E+) [168715.130922] snd_timer(E) sp5100_tco(E) pcspkr(E) drm_kms_helper(E) snd(E) k10temp(E) watchdog(E) soundcore(E) ccp(E) cdc_mbim(E) joydev(E) cdc_wdm(E) sg(E) button(E) evdev(E) loop(E) drm(E) efi_pstore(E) configfs(E) ip_tables(E) x_tables(E) autofs4(E) zfs(POE) spl(OE) efivarfs(E) sr_mod(E) cdrom(E) hid_generic(E) cdc_ncm(E) cdc_ether(E) usbnet(E) usbhid(E) uas(E) hid(E) usb_storage(E) mii(E) sd_mod(E) ahci(E) nvme(E) ahciem(E) xhci_pci(E) libahci(E) xhci_hcd(E) ixgbe(E) nvme_core(E) libata(E) xfrm_algo(E) t10_pi(E) crc32_pclmul(E) mdio_devres(E) usbcore(E) scsi_mod(E) crc32c_intel(E) crc64_rocksoft(E) i2c_piix4(E) usb_common(E) scsi_common(E) crc64(E) crc_t10dif(E) i2c_algo_bit(E) libphy(E) dca(E) crct10dif_generic(E) mdio(E) crct10dif_pclmul(E) crct10dif_common(E) video(E) wmi(E) gpio_amdpt(E) gpio_generic(E) [last unloaded: igb(E)] [168715.133023] RIP: 0010:igb_rd32+0x7c/0x90 [igb] [168715.137255] ? igb_rd32+0x7c/0x90 [igb] [168715.137508] ? igb_rd32+0x7c/0x90 [igb] [168715.138247] ? igb_rd32+0x7c/0x90 [igb] [168715.138250] ? igb_rd32+0x7c/0x90 [igb] [168715.139694] igb_get_invariants_82575+0xa6/0xf00 [igb] [168715.139700] igb_probe+0x3be/0x1520 [igb] [168715.142610] ? __pfx_igb_init_module+0x10/0x10 [igb] [168715.472667] igb 0000:05:00.1: PHY reset is blocked due to SOL/IDER session. [168717.202621] igb 0000:05:00.1: The NVM Checksum Is Not Valid [168717.400883] igb: probe of 0000:05:00.1 failed with error -5 [168717.401370] igb 0000:05:00.2: enabling device (0000 -> 0002) [168717.401509] igb 0000:05:00.2 0000:05:00.2 (uninitialized): PCIe link lost [168717.402106] igb: Failed to read reg 0x18! [168717.402357] WARNING: CPU: 2 PID: 1106121 at drivers/net/ethernet/intel/igb/igb_main.c:745 igb_rd32+0x7c/0x90 [igb] [168717.402619] Modules linked in: igb(E+) vhost_net(E) tun(E) vhost(E) vhost_iotlb(E) macvtap(E) macvlan(E) tap(E) xt_nat(E) xt_tcpudp(E) veth(E) xt_conntrack(E) nft_chain_nat(E) xt_MASQUERADE(E) nf_nat(E) nf_conntrack_netlink(E) nf_conntrack(E) nf_defrag_ipv6(E) nf_defrag_ipv4(E) xfrm_user(E) xt_addrtype(E) nft_compat(E) nf_tables(E) libcrc32c(E) crc32c_generic(E) nfnetlink(E) br_netfilter(E) bridge(E) stp(E) llc(E) nvme_fabrics(E) overlay(E) sunrpc(E) binfmt_misc(E) ntb_netdev(E) ntb_transport(E) ntb_split(E) ntb(E) ioatdma(E) ib_core(E) edac_mce_amd(E) kvm_amd(E) kvm(E) irqbypass(E) ghash_clmulni_intel(E) sha512_ssse3(E) sha256_ssse3(E) sha1_ssse3(E) amdgpu(E) aesni_intel(E) crypto_simd(E) cryptd(E) snd_hda_codec_hdmi(E) rapl(E) drm_exec(E) amdxcp(E) drm_buddy(E) gpu_sched(E) drm_suballoc_helper(E) drm_display_helper(E) snd_hda_intel(E) cec(E) snd_usb_audio(E) snd_intel_dspcfg(E) snd_usbmidi_lib(E) rc_core(E) snd_hda_codec(E) snd_rawmidi(E) snd_seq_device(E) snd_hda_core(E) mc(E) snd_hwdep(E) drm_ttm_helper(E) [168717.402644] snd_pcm(E) wmi_bmof(E) ttm(E) snd_timer(E) sp5100_tco(E) pcspkr(E) drm_kms_helper(E) snd(E) k10temp(E) watchdog(E) soundcore(E) ccp(E) cdc_mbim(E) joydev(E) cdc_wdm(E) sg(E) button(E) evdev(E) loop(E) drm(E) efi_pstore(E) configfs(E) ip_tables(E) x_tables(E) autofs4(E) zfs(POE) spl(OE) efivarfs(E) sr_mod(E) cdrom(E) hid_generic(E) cdc_ncm(E) cdc_ether(E) usbnet(E) usbhid(E) uas(E) hid(E) usb_storage(E) mii(E) sd_mod(E) ahci(E) nvme(E) ahciem(E) xhci_pci(E) libahci(E) xhci_hcd(E) ixgbe(E) nvme_core(E) libata(E) xfrm_algo(E) t10_pi(E) crc32_pclmul(E) mdio_devres(E) usbcore(E) scsi_mod(E) crc32c_intel(E) crc64_rocksoft(E) i2c_piix4(E) usb_common(E) scsi_common(E) crc64(E) crc_t10dif(E) i2c_algo_bit(E) libphy(E) dca(E) crct10dif_generic(E) mdio(E) crct10dif_pclmul(E) crct10dif_common(E) video(E) wmi(E) gpio_amdpt(E) gpio_generic(E) [last unloaded: igb(E)] [168717.405253] RIP: 0010:igb_rd32+0x7c/0x90 [igb] [168717.408900] ? igb_rd32+0x7c/0x90 [igb] [168717.409393] ? igb_rd32+0x7c/0x90 [igb] [168717.410845] ? igb_rd32+0x7c/0x90 [igb] [168717.411088] ? igb_rd32+0x7c/0x90 [igb] [168717.411330] igb_get_invariants_82575+0xa6/0xf00 [igb] [168717.411577] igb_probe+0x3be/0x1520 [igb] [168717.414240] ? __pfx_igb_init_module+0x10/0x10 [igb] [168717.744687] igb 0000:05:00.2: PHY reset is blocked due to SOL/IDER session. [168719.474678] igb 0000:05:00.2: The NVM Checksum Is Not Valid [168719.664847] igb: probe of 0000:05:00.2 failed with error -5 [168719.665336] igb 0000:05:00.3: enabling device (0000 -> 0002) [168719.665475] igb 0000:05:00.3 0000:05:00.3 (uninitialized): PCIe link lost [168719.666111] igb: Failed to read reg 0x18! [168719.666361] WARNING: CPU: 10 PID: 1106121 at drivers/net/ethernet/intel/igb/igb_main.c:745 igb_rd32+0x7c/0x90 [igb] [168719.666623] Modules linked in: igb(E+) vhost_net(E) tun(E) vhost(E) vhost_iotlb(E) macvtap(E) macvlan(E) tap(E) xt_nat(E) xt_tcpudp(E) veth(E) xt_conntrack(E) nft_chain_nat(E) xt_MASQUERADE(E) nf_nat(E) nf_conntrack_netlink(E) nf_conntrack(E) nf_defrag_ipv6(E) nf_defrag_ipv4(E) xfrm_user(E) xt_addrtype(E) nft_compat(E) nf_tables(E) libcrc32c(E) crc32c_generic(E) nfnetlink(E) br_netfilter(E) bridge(E) stp(E) llc(E) nvme_fabrics(E) overlay(E) sunrpc(E) binfmt_misc(E) ntb_netdev(E) ntb_transport(E) ntb_split(E) ntb(E) ioatdma(E) ib_core(E) edac_mce_amd(E) kvm_amd(E) kvm(E) irqbypass(E) ghash_clmulni_intel(E) sha512_ssse3(E) sha256_ssse3(E) sha1_ssse3(E) amdgpu(E) aesni_intel(E) crypto_simd(E) cryptd(E) snd_hda_codec_hdmi(E) rapl(E) drm_exec(E) amdxcp(E) drm_buddy(E) gpu_sched(E) drm_suballoc_helper(E) drm_display_helper(E) snd_hda_intel(E) cec(E) snd_usb_audio(E) snd_intel_dspcfg(E) snd_usbmidi_lib(E) rc_core(E) snd_hda_codec(E) snd_rawmidi(E) snd_seq_device(E) snd_hda_core(E) mc(E) snd_hwdep(E) drm_ttm_helper(E) [168719.666648] snd_pcm(E) wmi_bmof(E) ttm(E) snd_timer(E) sp5100_tco(E) pcspkr(E) drm_kms_helper(E) snd(E) k10temp(E) watchdog(E) soundcore(E) ccp(E) cdc_mbim(E) joydev(E) cdc_wdm(E) sg(E) button(E) evdev(E) loop(E) drm(E) efi_pstore(E) configfs(E) ip_tables(E) x_tables(E) autofs4(E) zfs(POE) spl(OE) efivarfs(E) sr_mod(E) cdrom(E) hid_generic(E) cdc_ncm(E) cdc_ether(E) usbnet(E) usbhid(E) uas(E) hid(E) usb_storage(E) mii(E) sd_mod(E) ahci(E) nvme(E) ahciem(E) xhci_pci(E) libahci(E) xhci_hcd(E) ixgbe(E) nvme_core(E) libata(E) xfrm_algo(E) t10_pi(E) crc32_pclmul(E) mdio_devres(E) usbcore(E) scsi_mod(E) crc32c_intel(E) crc64_rocksoft(E) i2c_piix4(E) usb_common(E) scsi_common(E) crc64(E) crc_t10dif(E) i2c_algo_bit(E) libphy(E) dca(E) crct10dif_generic(E) mdio(E) crct10dif_pclmul(E) crct10dif_common(E) video(E) wmi(E) gpio_amdpt(E) gpio_generic(E) [last unloaded: igb(E)] [168719.669264] RIP: 0010:igb_rd32+0x7c/0x90 [igb] [168719.672935] ? igb_rd32+0x7c/0x90 [igb] [168719.673429] ? igb_rd32+0x7c/0x90 [igb] [168719.674884] ? igb_rd32+0x7c/0x90 [igb] [168719.675127] ? igb_rd32+0x7c/0x90 [igb] [168719.675369] igb_get_invariants_82575+0xa6/0xf00 [igb] [168719.675616] igb_probe+0x3be/0x1520 [igb] [168719.678284] ? __pfx_igb_init_module+0x10/0x10 [igb] [168720.008929] igb 0000:05:00.3: PHY reset is blocked due to SOL/IDER session. [168721.738903] igb 0000:05:00.3: The NVM Checksum Is Not Valid [168721.916849] igb: probe of 0000:05:00.3 failed with error -5My last port of call now is to pull the nic and try it in a difference PCI-e slot
The current slot is a gen 3 1x slot so should be fine but i will try it in a gen 5 16x on the same system just in case its causing issues. I doubt it but it is indeed looking like some kind of hardware issue nowRegards,
Jamie -
For anyone interested in the exciting conclusions... it worked fine in the 16x slot for 2 weeks and is still in there now
I put an I340-T4 in the 1x slot at the same time and left that running and that has been perfectly fine as wellIt seems to be an incompatibility between the 1x slot and the I350 specifically but i'm not sure why. In either case, the issue seems to be resolved
It may be something specific to AM5 and the I350 in the 1x, or just the I350 and the 1x alone but if anyone else for some reason tries the same, at least you know what symptoms manifest and what the cause was
Thanks again for those that helped and commented