Problems With WAN Loss Cobnection
-
Yeah I would at least try disabling Snort on WAN and see what happens. If OpenVPN is the only service externally available that's not s big risk.
Running Snort like that means the alerts are pretty much useless because you will be seeing them continually. But more importantly it also increases the CPU loading significantly in the event of a flood of traffic. That makes it much more likely to start dropping packets if a CPU core is maxed out.
-
@stephenw10 perfect, i just delete WAN interface from Snort and only use LAN

-
Now you behave as the responsible Internet user !

As soon as snort sees that you send out suspected traffic, you can deal with it locally.
If some device is requesting suspected traffic from the Internet : same thing : go visit the user. -
@Gertjan I’m going to monitor the behavior, hoping for stable WAN performance with no more disconnections or freezes. I’ll keep you updated if anything comes up, and thank you so much for everything!
-
@dcuadrados said in Problems With WAN Loss Cobnection:
no more [WAN] disconnections
Your pfSEnse LAN is connected to switch. This connection normally never goes down.
Exactly the same thing is true for the WAN NIC. It will stay up forever.For the LAN switch, to do things even better, hook it up,to same UPS as the one pfSense uses, now even power won't bother you anymore.
Do the same thing for the WAN upstream device.That said, there is something else, to consdier for the WAN interface.
You, as an admin, gave pfSense the order to 'reset' the WAN interface if the ping test starts to fail.
If ping pacquets don't come back, something is wrong on the router to the ping destination.
This could be (hopefully) a local issue, so pulling down the WAN will 'inform' the upstream device to re create the connection. This was valid in the past when people where using cable modems and kind of upstream ISP devices, but way less an issue these days. If the connection goes down or bad because a satellite is hiding behind a cloud, you can have the WAN interface pulled down as many times as you want, it won't un-hide the satellite.
You can, depending on your type of connection, de activate the dpinger action :
Uncheck :

and from now on pfSense won't touch the WA interface anymore.
It's still possible that the device on the other side of the WAN cable pulls the connection down : that's ok, and you can't do anything about it. (except maybe looking for a more stable ISP, if one exist).The the issue is more upstream, you can't do anything about it, except waiting.
Keep in mind that ICMP (ping) packets also can get lost (dropped) if you saturate the connection.
Solution : stop doing so - or, for example, create 'pipes' where you can prioritize ICMP packets.
Or call you ISP and ask them for the "max" they can make available to you. -
@Gertjan Thank you so much for everything. I’m going to see if, with the current configuration, the WAN dropouts stop. Obviously, as you said, if the ISP goes down there’s not much that can be done—but in those cases, it usually comes back on its own if the ISP is completely down.
I’ll see how things go now with the changes made and hope for better performance. I’ll keep you updated. Thanks a million!
-
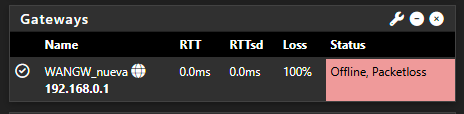
It’s happening again… I have two systems right now with the same issue. It’s honestly very frustrating. The logs show this:
Jun 26 23:47:14	dpinger	12135	GW_Movistar 8.8.8.8: sendto error: 13
Jun 26 23:47:13	dpinger	12135	GW_Movistar 8.8.8.8: sendto error: 13
Jun 26 23:47:13	dpinger	12135	GW_Movistar 8.8.8.8: sendto error: 13
Jun 26 23:47:12	dpinger	12135	GW_Movistar 8.8.8.8: sendto error: 13
Jun 26 23:47:12	dpinger	12135	GW_Movistar 8.8.8.8: sendto error: 13
Jun 26 23:47:11	dpinger	12135	GW_Movistar 8.8.8.8: sendto error: 13
Jun 26 23:47:11	dpinger	12135	GW_Movistar 8.8.8.8: sendto error: 13
Jun 26 23:47:10	dpinger	12135	GW_Movistar 8.8.8.8: sendto error: 13
Jun 26 23:47:10	dpinger	12135	GW_Movistar 8.8.8.8: sendto error: 13
Jun 26 23:47:09	dpinger	12135	GW_Movistar 8.8.8.8: sendto error: 13
Jun 26 23:47:09	dpinger	12135	GW_Movistar 8.8.8.8: sendto error: 13
Jun 26 23:47:08	dpinger	12135	GW_Movistar 8.8.8.8: sendto error: 13
Jun 26 23:47:08	dpinger	12135	GW_Movistar 8.8.8.8: sendto error: 13
Jun 26 23:47:07	dpinger	12135	GW_Movistar 8.8.8.8: sendto error: 13
Jun 26 23:47:07	dpinger	12135	GW_Movistar 8.8.8.8: sendto error: 13
Jun 26 23:47:06	dpinger	12135	GW_Movistar 8.8.8.8: sendto error: 13
Jun 26 23:47:06	dpinger	12135	GW_Movistar 8.8.8.8: sendto error: 13
Jun 26 23:47:05	dpinger	12135	GW_Movistar 8.8.8.8: sendto error: 13
Jun 26 23:47:04	dpinger	12135	GW_Movistar 8.8.8.8: sendto error: 13
Jun 26 23:47:04	dpinger	12135	GW_Movistar 8.8.8.8: sendto error: 13
Jun 26 23:47:03	dpinger	12135	GW_Movistar 8.8.8.8: sendto error: 13
Jun 26 23:47:03	dpinger	12135	GW_Movistar 8.8.8.8: sendto error: 13
Jun 26 23:47:02	dpinger	12135	GW_Movistar 8.8.8.8: Alarm latency 0us stddev 0us loss 100%
Jun 26 23:47:00	dpinger	12135	send_interval 500ms loss_interval 2000ms time_period 60000ms report_interval 0ms data_len 1 alert_interval 1000ms latency_alarm 500ms loss_alarm 20% alarm_hold 10000ms dest_addr 8.8.8.8 bind_addr 192.168.1.254 identifier "GW_Movistar "
Other FW:
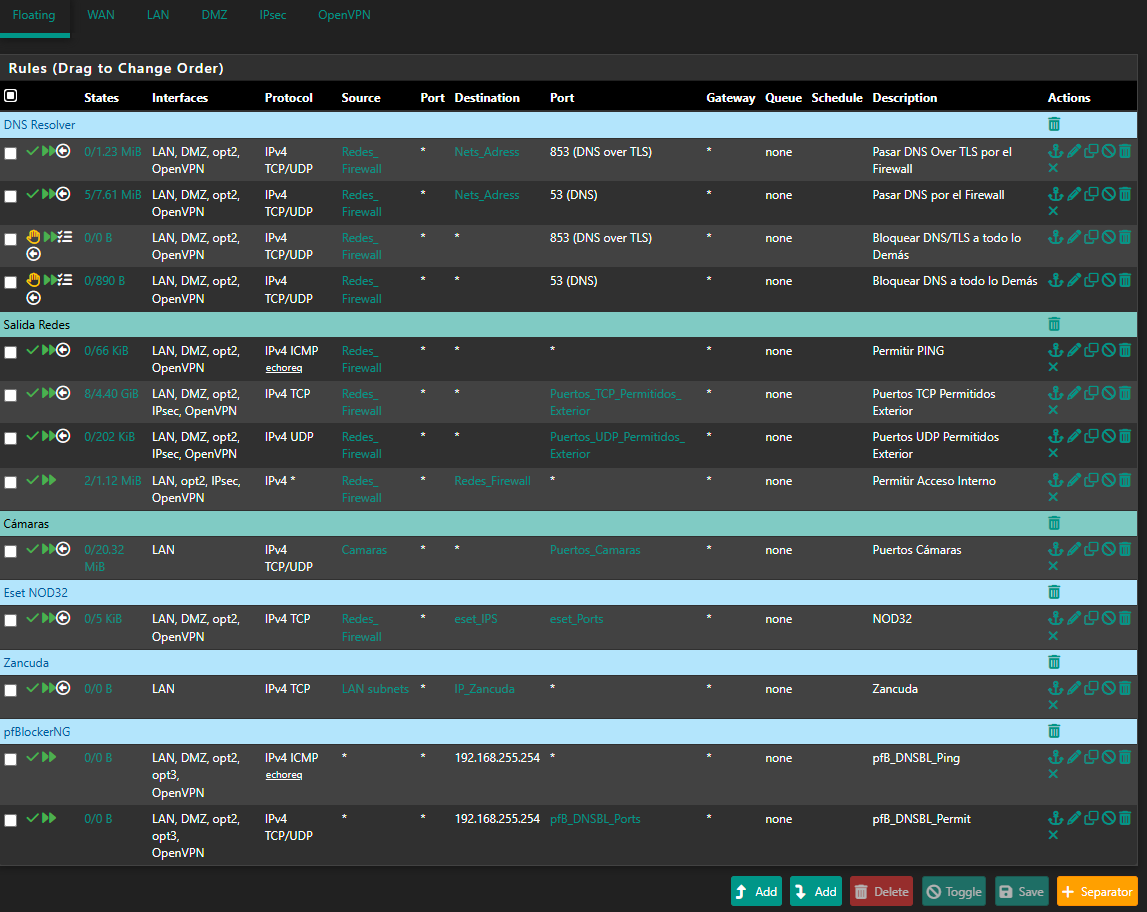
2025-06-26 23:41:59.210553+02:00	dpinger	39125	WANGW_nueva 8.8.8.8: Alarm latency 0us stddev 0us loss 100%
2025-06-26 23:41:57.200434+02:00	dpinger	39125	send_interval 500ms loss_interval 2000ms time_period 60000ms report_interval 0ms data_len 1 alert_interval 1000ms latency_alarm 500ms loss_alarm 20% alarm_hold 10000ms dest_addr 8.8.8.8 bind_addr 192.168.0.254 identifier "WANGW_nueva "
2025-06-26 23:41:57.187617+02:00	dpinger	38486	exiting on signal 15
2025-06-26 23:15:19.233616+02:00	dpinger	38486	WANGW_nueva 8.8.8.8: Alarm latency 13213us stddev 3126us loss 22%
I have remote access to them, and Uptime Kuma reports they are up, but the WAN is down and they have no internet access. I’ve already removed Snort from the WAN—it's only on the LAN now. I really don’t know what else it could be. Could it be due to using floating rules? I can’t think of anything else that might be causing this. These are the rules:
top -HaSP:
  PID USERNAME    PRI NICE   SIZE    RES STATE    C   TIME    WCPU COMMAND
    0 root        -60    -     0B  1344K CPU2     2  43:40 100.00% [kernel{if_io_tqg_2}]
   11 root        187 ki31     0B    64K CPU0     0  22.9H  99.56% [idle{idle: cpu0}]
   11 root        187 ki31     0B    64K RUN      3  22.8H  90.45% [idle{idle: cpu3}]
   11 root        187 ki31     0B    64K CPU1     1  23.0H  85.55% [idle{idle: cpu1}]
47858 root         20    0  1063M   934M bpf      1   6:06   0.29% /usr/local/bin/snort -R _10641 -M -D -q --suppress-config-log --daq pcap --daq-mode passive --treat-drop-as-alert -l /var/log/snort/snort_igc010641 --pid-path /var/run --nolock-pidfile --no-interface-pidfile -G 1
 8220 root         20    0    17M  5156K CPU3     3   0:01   0.28% top -HaSP
61672 unbound      20    0   547M   496M kqread   1   2:53   0.19% /usr/local/sbin/unbound -c /var/unbound/unbound.conf{unbound}
33872 root         20    0  5655M   230M uwait    0   8:29   0.14% /usr/local/bin/telegraf -config=/usr/local/etc/telegraf.conf{telegraf}
    7 root        -16    -     0B    16K pftm     3   1:15   0.13% [pf purge]
33872 root         20    0  5655M   230M uwait    0   3:27   0.12% /usr/local/bin/telegraf -config=/usr/local/etc/telegraf.conf{telegraf}
    0 root        -60    -     0B  1344K -        1   1:49   0.08% [kernel{if_config_tqg_0}]
    0 root        -60    -     0B  1344K -        1   0:04   0.08% [kernel{softirq_1}]
    0 root        -60    -     0B  1344K -        3   0:03   0.05% [kernel{softirq_3}]
28381 root         20    0    22M    12M select   0   0:00   0.03% sshd: admin@pts/0 (sshd)
    0 root        -60    -     0B  1344K -        3   1:40   0.03% [kernel{if_io_tqg_3}]
97202 root         20    0  1187M  1005M bpf      1   7:06   0.03% /usr/local/bin/snort -R _5949 -M -D -q --suppress-config-log --daq pcap --daq-mode passive --treat-drop-as-alert -l /var/log/snort/snort_igc15949 --pid-path /var/run --nolock-pidfile --no-interface-pidfile -G 594
33872 root         20    0  5655M   230M uwait    3   3:17   0.03% /usr/local/bin/telegraf -config=/usr/local/etc/telegraf.conf{telegraf}
33872 root         20    0  5655M   230M kqread   0   3:15   0.02% /usr/local/bin/telegraf -config=/usr/local/etc/telegraf.conf{telegraf}
33872 root         20    0  5655M   230M kqread   0   3:02   0.02% /usr/local/bin/telegraf -config=/usr/local/etc/telegraf.conf{telegraf}
57489 root         20    0    13M  2908K kqread   0   0:24   0.02% /usr/bin/tail_pfb -n0 -F /var/log/filter.log
    9 root        -16    -     0B    48K psleep   3   0:27   0.02% [pagedaemon{dom0}]
44329 root         20    0    13M  2908K kqread   1   0:05   0.02% tail -F -n 0 /var/log/auth.log
46933 root         20    0    13M  2748K select   0   0:04   0.01% tail: system.fileargs (tail)
58244 root         20    0    13M  2748K select   3   0:18   0.01% tail_pfb: system.fileargs (tail_pfb)
73593 root         20    0    13M  3876K bpf      0   0:37   0.01% /usr/local/sbin/filterlog -i pflog0 -p /var/run/filterlog.pid
39125 root         20    0    17M  3160K nanslp   0   0:00   0.01% /usr/local/bin/dpinger -S -r 0 -i WANGW_nueva -B 192.168.0.254 -p /var/run/dpinger_WANGW_nueva~192.168.0.254~8.8.8.8.pid -u /var/run/dpinger_WANGW_nueva~192.168.0.254~8.8.8.8.sock -C /etc/rc.gateway_alarm -d 1 -s
    0 root        -60    -     0B  1344K -        0   0:03   0.01% [kernel{softirq_0}]
    8 root        -16    -     0B    16K -        3   0:14   0.01% [rand_harvestq]
33872 root         20    0  5655M   230M uwait    0   3:34   0.01% /usr/local/bin/telegraf -config=/usr/local/etc/telegraf.conf{telegraf}
57781 root         20    0    83M    63M piperd   3 117:59   0.01% /usr/local/bin/php_pfb -f /usr/local/pkg/pfblockerng/pfblockerng.inc filterlog
    2 root        -60    -     0B    64K WAIT     0   0:18   0.01% [clock{clock (0)}]
    0 root        -60    -     0B  1344K -        0   2:02   0.01% [kernel{if_io_tqg_0}]
44643 root         20    0    13M  3196K kqread   1   0:07   0.01% /usr/sbin/syslogd -O rfc5424 -s -c -c -l /var/dhcpd/var/run/log -P /var/run/syslog.pid -f /etc/syslog.conf
33872 root         20    0  5655M   230M uwait    3   1:22   0.01% /usr/local/bin/telegraf -config=/usr/local/etc/telegraf.conf{telegraf}
34247 root         20    0   102M    28M uwait    1   0:01   0.01% /usr/local/libexec/ipsec/charon --use-syslog{charon}
32522 root         20    0    24M  9160K select   1   0:07   0.01% /usr/local/sbin/ntpd -g -c /var/etc/ntpd.conf -p /var/run/ntpd.pid{ntpd}
    0 root        -12    -     0B  1344K -        3   1:45   0.01% [kernel{z_wr_iss_2}]
   12 root        -64    -     0B   224K WAIT     1   0:30   0.00% [intr{irq129: ahci0}]
34247 root         20    0   102M    28M uwait    3   0:02   0.00% /usr/local/libexec/ipsec/charon --use-syslog{charon}
   12 root        -60    -     0B   224K WAIT     3   0:39   0.00% [intr{swi1: netisr 3}]
 6013 root         20    0  1184M   974M bpf      1   0:04   0.00% /usr/local/bin/snort -R _57509 -M -D -q --suppress-config-log --daq pcap --daq-mode passive --treat-drop-as-alert -l /var/log/snort/snort_ovpns157509 --pid-path /var/run --nolock-pidfile --no-interface-pidfile -G
58427 root         20    0    22M    10M kqread   3   0:15   0.00% /usr/local/sbin/lighttpd_pfb -f /var/unbound/pfb_dnsbl_lighty.conf
  628 root         20    0   108M    32M kqread   0   0:03   0.00% php-fpm: master process (/usr/local/lib/php-fpm.conf) (php-fpm)
    0 root        -16    -     0B  1344K -        3   0:22   0.00% [kernel{z_wr_int_1}]
    2 root        -60    -     0B    64K WAIT     1   0:04   0.00% [clock{clock (1)}]
61672 unbound      20    0   547M   496M kqread   3   2:11   0.00% /usr/local/sbin/unbound -c /var/unbound/unbound.conf{unbound}
39125 root         20    0    17M  3160K nanslp   0   0:00   0.00% /usr/local/bin/dpinger -S -r 0 -i WANGW_nueva -B 192.168.0.254 -p /var/run/dpinger_WANGW_nueva~192.168.0.254~8.8.8.8.pid -u /var/run/dpinger_WANGW_nueva~192.168.0.254~8.8.8.8.sock -C /etc/rc.gateway_alarm -d 1 -s
   16 root        -60    -     0B    80K -        1   0:03   0.00% [usb{usbus0}]
33872 root         68    0  5655M   230M uwait    0   3:35   0.00% /usr/local/bin/telegraf -config=/usr/local/etc/telegraf.conf{telegraf}
 6013 root         20    0  1184M   974M nanslp   1   0:02   0.00% /usr/local/bin/snort -R _57509 -M -D -q --suppress-config-log --daq pcap --daq-mode passive --treat-drop-as-alert -l /var/log/snort/snort_ovpns157509 --pid-path /var/run --nolock-pidfile --no-interface-pidfile -G
    0 root        -16    -     0B  1344K -        3   0:02   0.00% [kernel{z_null_int}]
47858 root         20    0  1063M   934M nanslp   0   0:02   0.00% /usr/local/bin/snort -R _10641 -M -D -q --suppress-config-log --daq pcap --daq-mode passive --treat-drop-as-alert -l /var/log/snort/snort_igc010641 --pid-path /var/run --nolock-pidfile --no-interface-pidfile -G 1
    2 root        -60    -     0B    64K WAIT     3   0:05   0.00% [clock{clock (3)}]
97202 root         20    0  1187M  1005M nanslp   3   0:02   0.00% /usr/local/bin/snort -R _5949 -M -D -q --suppress-config-log --daq pcap --daq-mode passive --treat-drop-as-alert -l /var/log/snort/snort_igc15949 --pid-path /var/run --nolock-pidfile --no-interface-pidfile -G 594
    0 root        -60    -     0B  1344K -        1   1:56   0.00% [kernel{if_io_tqg_1}]
    6 root         -8    -     0B   896K mmp->m   1   0:01   0.00% [zfskern{mmp_thread_enter}]
   21 root         16    -     0B    16K syncer   1   0:01   0.00% [syncer]
    0 root        -16    -     0B  1344K -        3   0:01   0.00% [kernel{z_flush_int}]
My system tuneables:
Tunable Name	Description	Value
net.inet.ip.intr_queue_maxlen	Cola de interrupciones ampliada	3000
net.inet6.ip6.intr_queue_maxlen	Cola de interrupciones IPv6	3000
hw.igc.max_interrupt_rate	Tasa de interrupciones del driver IGC	12000
hw.igc.rx_process_limit	Limitar el procesamiento de RX en el driver IGC	-1
net.inet.tcp.soreceive_stream	Ajuste TCP	1
net.isr.maxthreads	Hilos ISR (paralelismo de red)	1
net.isr.bindthreads	Vincular hilos ISR a CPUs	1
net.isr.dispatch	Distribución directa del tráfico ISR	direct
net.inet.rss.enabled	RSS habilitado	1
net.inet.rss.bits	RSS Bits (distribuir en múltiples núcleos)	2
hw.ix.flow_control	Desactivar Flow Control (i225/i226)	0
dev.igc.0.fc	Desactivar Flow Control en interfaces i225/i226 WAN	0
dev.igc.1.fc	Desactivar Flow Control en interfaces i225/i226 LAN	0
kern.ipc.nmbclusters	Aumentar tamaño del buffer de red (mbufs)	1000000
kern.ipc.nmbclusters	Clusters de memoria (recomendado por Netgate)	1000000
net.inet.ip.portrange.first		1024
net.inet.tcp.blackhole	Do not send RST on segments to closed ports	2
net.inet.udp.blackhole	Do not send port unreachables for refused connects	1
net.inet.ip.random_id	Assign random ip_id values	1
net.inet.tcp.drop_synfin	Drop TCP packets with SYN+FIN set	1
net.inet.ip.redirect	Enable sending IP redirects	1
net.inet6.ip6.redirect	Send ICMPv6 redirects for unforwardable IPv6 packets	1
net.inet6.ip6.use_tempaddr	Create RFC3041 temporary addresses for autoconfigured addresses	0
net.inet6.ip6.prefer_tempaddr	Prefer RFC3041 temporary addresses in source address selection	0
net.inet.tcp.syncookies	Use TCP SYN cookies if the syncache overflows	1
net.inet.tcp.recvspace	Initial receive socket buffer size	65228
net.inet.tcp.sendspace	Initial send socket buffer size	65228
net.inet.tcp.delayed_ack	Delay ACK to try and piggyback it onto a data packet	0
net.inet.udp.maxdgram	Maximum outgoing UDP datagram size	57344
net.link.bridge.pfil_onlyip	Only pass IP packets when pfil is enabled	0
net.link.bridge.pfil_member	Packet filter on the member interface	1
net.link.bridge.pfil_bridge	Packet filter on the bridge interface	0
net.link.tap.user_open	Enable legacy devfs interface creation for all users	1
net.link.vlan.mtag_pcp	Retain VLAN PCP information as packets are passed up the stack	1
kern.randompid	Random PID modulus. Special values: 0: disable, 1: choose random value	347
hw.syscons.kbd_reboot	enable keyboard reboot	0
net.inet.tcp.log_debug	Log errors caused by incoming TCP segments	0
net.inet.tcp.tso	Enable TCP Segmentation Offload	1
net.inet.icmp.icmplim	Maximum number of ICMP responses per second	0
vfs.read_max	Cluster read-ahead max block count	32
kern.ipc.maxsockbuf	Maximum socket buffer size	4262144
net.inet.ip.process_options	Enable IP options processing ([LS]SRR, RR, TS)	0
kern.random.harvest.mask	Entropy harvesting mask	351
net.route.netisr_maxqlen	maximum routing socket dispatch queue length	1024
net.inet.udp.checksum	compute udp checksum	1
net.inet.icmp.reply_from_interface	ICMP reply from incoming interface for non-local packets	1
net.inet6.ip6.rfc6204w3	Accept the default router list from ICMPv6 RA messages even when packet forwarding is enabled	1
net.key.preferred_oldsa		0
net.inet.carp.senderr_demotion_factor	Send error demotion factor adjustment	0
net.pfsync.carp_demotion_factor	pfsync's CARP demotion factor adjustment	0
net.raw.recvspace		65536
net.raw.sendspace		65536
net.inet.raw.recvspace	Maximum space for incoming raw IP datagrams	131072
net.inet.raw.maxdgram	Maximum outgoing raw IP datagram size	131072
kern.corefile	Process corefile name format string	/root/%N.core
kern.crypto.iimb.enable_aescbc	enable AES-CBC cipher	1
kern.crypto.iimb.enable_multiq	enable multi-Q	1
kern.crypto.iimb.use_task	use taskq	0
kern.crypto.iimb.arch	Set architecture	auto
kern.crypto.iimb.prefetch	prefetch key for jobs	1
kern.crypto.iimb.max_jobs	max number of jobs in batch	256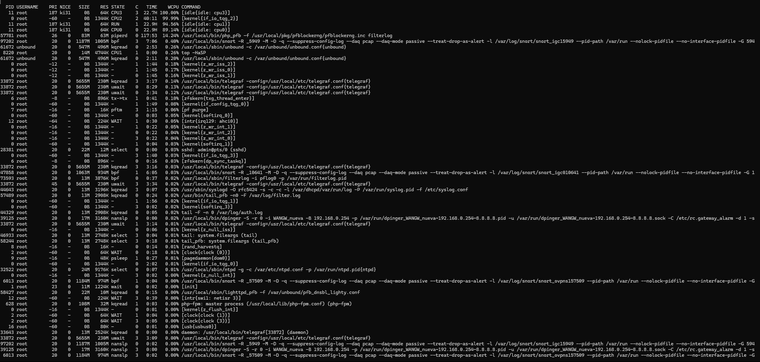
loader.conf:
kern.cam.boot_delay=10000
kern.geom.label.disk_ident.enable="0"
kern.geom.label.gptid.enable="0"
kern.ipc.nmbclusters="1000000"
kern.ipc.nmbjumbo9="524288"
kern.ipc.nmbjumbop="524288"
opensolaris_load="YES"
zfs_load="YES"
opensolaris_load="YES"
zfs_load="YES"
kern.cam.boot_delay=10000
kern.geom.label.disk_ident.enable="0"
kern.geom.label.gptid.enable="0"
kern.ipc.nmbclusters="1000000"
kern.ipc.nmbjumbo9="524288"
kern.ipc.nmbjumbop="524288"
kern.geom.label.disk_ident.enable="0"
kern.geom.label.gptid.enable="0"
cryptodev_load="YES"
zfs_load="YES"
kern.ipc.semopm=100
kern.ipc.semmni=128
kern.ipc.semmns=32000
kern.ipc.shmmni=4096
loader_conf_files="/boot/loader.conf.lua"
boot_serial="NO"
autoboot_delay="3"
debug.ddb.capture.bufsize="524288"
hw.e6000sw.default_disabled=1
hw.hn.vf_transparent="0"
hw.hn.use_if_start="1"
net.link.ifqmaxlen="128"
machdep.hwpstate_pkg_ctrl="0"
net.pf.states_hashsize="524288"
Networking:
Rules:
WAN:

-
sendto error 13 is 'permission denied' which doesn't make much sense unless it's being blocked upstream. I might imagine something triggering on the monitoring pings and blocking your IP.
Try running packet capture on WAN whilst in that state. Do you see icmp denied packets being returned from upstream?
-
@stephenw10 I no longer have access—it’s completely frozen. Until it’s restarted, I won’t be able to connect, which means I won’t have access until tomorrow. I don’t know what it could be—whether it’s Snort, the rules, pfBlocker, or some misconfiguration. The best thing would be to reformat everything, leave it clean without any rules, and start adding them little by little. Clearly, it’s a configuration issue—some mistake on my part. There’s no other explanation.
-
Are all three devices behind the same ISP devices? This could be the upstream device blocking the traffic if it has some DOS prevention for example. Though if that was the case I'd expect it to remain blocked for some time whether or not pfSense is rebooted. Assuming it pulls the same WAN IP.
-
@stephenw10 said in Problems With WAN Loss Cobnection:
Are all three devices behind the same ISP devices? This could be the upstream device blocking the traffic if it has some DOS prevention for example. Though if that was the case I'd expect it to remain blocked for some time whether or not pfSense is rebooted. Assuming it pulls the same WAN IP.
No, they are independent devices in different locations—they have nothing to do with each other. What I did notice when running
topwas this:0 root -60 - 0B 1344K CPU2 2 43:40 100.00% [kernel{if_io_tqg_2}]In other words, something is maxing out the processor completely, while the other cores remain idle:
11 root        187 ki31     0B    64K CPU0     0  22.9H  99.56% [idle{idle: cpu0}]
11 root        187 ki31     0B    64K RUN      3  22.8H  90.45% [idle{idle: cpu3}]
11 root        187 ki31     0B    64K CPU1     1  23.0H  85.55% [idle{idle: cpu1}]
So I’m not sure if it might be related to something I configured in System Tunables.
-
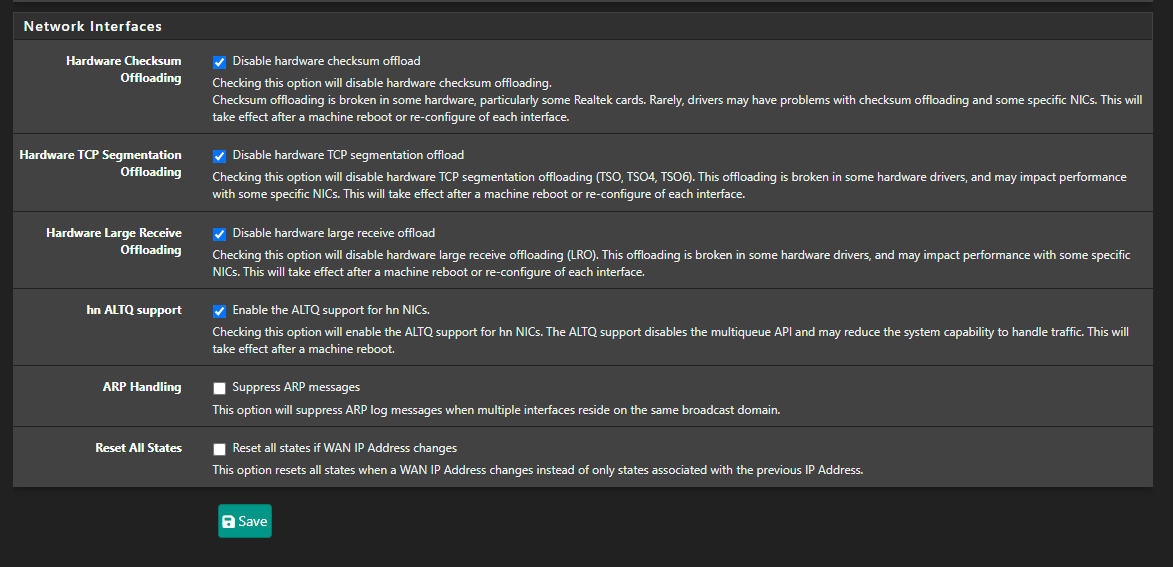
Just checking :
You've activated :

You use igc NICs, right ?
According to ALTQ support page : Network Interface Drivers with ALTQ Traffic Shaping Support where you can see the list of supported NIC drivers (click on altq(4)).
"igc" isn't present on that list.So ?
-
@Gertjan You're right, I have it enabled—it was carried over from another firewall backup that used a different driver. I'm going to disable it. That said, one of the devices with the same issue is using an em driver. Still, I’ve already disabled it, and I’ll reboot as soon as I can for the changes to take effect.
-
That setting only does anything if you have hn NICs. So only in HyperV or Azure.
igc does support altq, it should be fine.
That CPU usage is all in the NIC. It looks like it's trying to push a load of traffic. Check the traffic and packet graphs in Status > Monitoring at the time. Is there a huge spike in traffic?
Try to get a pcap of it at the time if you can. You might have something creating a loop or some sort of reflected traffic.
@dcuadrados said in Problems With WAN Loss Cobnection:
they are independent devices in different locations—they have nothing to do with each other.
Sorry what I meant there was are all three locations using the same ISP? With the same type of ISP supplied router?
Are all three using double NAT? -
@stephenw10 said in Problems With WAN Loss Cobnection:
Ese uso de CPU está todo en la NIC. Parece como si estuviera intentando impulsar una gran cantidad de tráfico. Verifique los gráficos de tráfico y paquetes en Estado > Monitoreo en ese momento. ¿Hay un gran aumento en el tráfico?
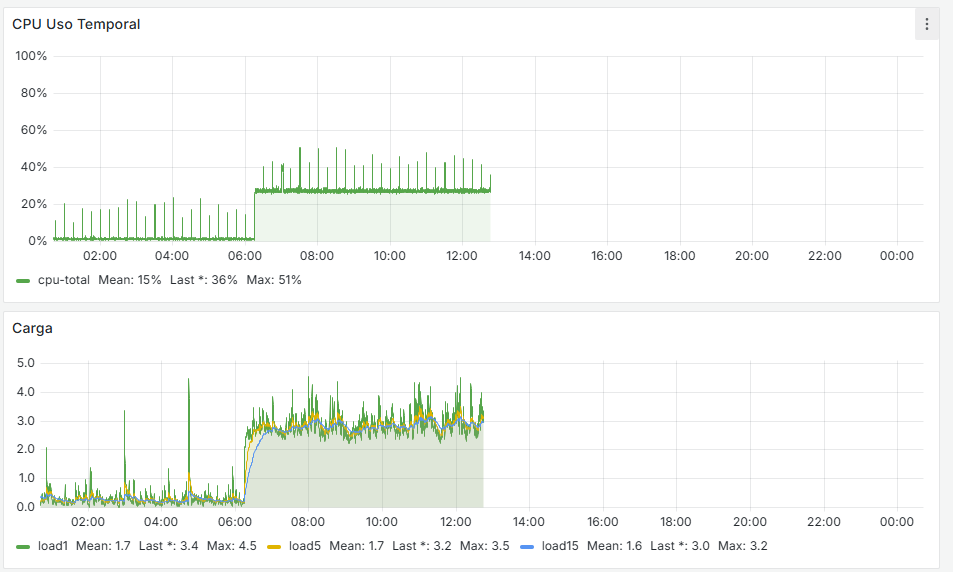
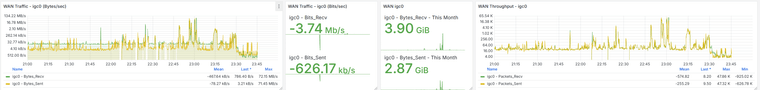
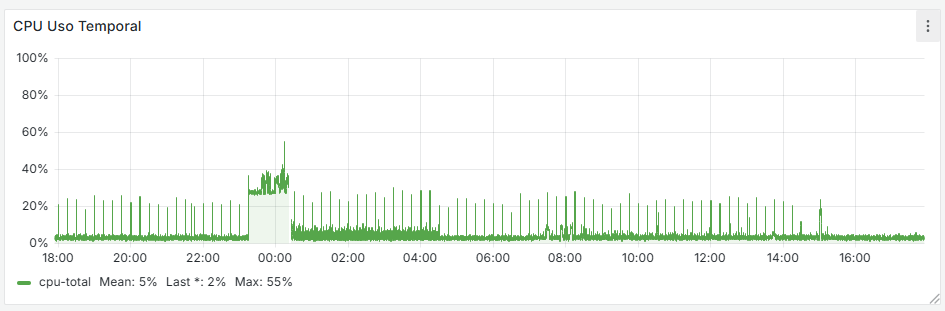
I have the Grafana data, and there is indeed a traffic increase beforehand, followed by a noticeable drop at that moment. It happens around 11:00 PM, as shown, and at that time no one is working in the office. The Acronis Online Backup runs at 11:45 PM, and the loss begins around 11:30 PM, but I don’t see anything unusual aside from that. Additionally, all devices on the network are shut down at 10:30 PM by policy, and only the server remains on.
@stephenw10 said in Problems With WAN Loss Cobnection:
Perdón, ¿qué quise decir con que había tres ubicaciones que usaban el mismo ISP? Con lo mismo tipo ¿del enrutador suministrado por el ISP?
¿Los tres utilizan NAT doble?All three use double NAT, and they’re with different ISPs, but in all cases I pass the traffic from the router to the firewall. As I mentioned, I have dozens of pfSense setups configured this way, but the ones failing are these—specifically the ones with i225 and i226 NICs.
The difference with these setups is that I use:
- Snort
- Floating rules
- pfBlocker
- Telegraf
The others are older and only use outbound hardening (secure outbound rules), VPN, IPsec... and they work flawlessly. All of those use em drivers, don’t use Snort, have regular per-interface rules, and I don’t monitor them with Influx + Grafana.
And this is what I have in the cron jobs—nothing unusual as far as I can tell.
Could this be the cause?0,15,30,45 * * * * root /etc/rc.filter_configure_syncminute hour mday month wday who command */1 * * * * root /usr/sbin/newsyslog 1 3 * * * root /etc/rc.periodic daily 15 4 * * 6 root /etc/rc.periodic weekly 30 5 1 * * root /etc/rc.periodic monthly 1,31 0-5 * * * root /usr/bin/nice -n20 adjkerntz -a 1 3 1 * * root /usr/bin/nice -n20 /etc/rc.update_bogons.sh 1 1 * * * root /usr/bin/nice -n20 /etc/rc.dyndns.update */60 * * * * root /usr/bin/nice -n20 /usr/local/sbin/expiretable -v -t 3600 virusprot 30 12 * * * root /usr/bin/nice -n20 /etc/rc.update_urltables 1 0 * * * root /usr/bin/nice -n20 /etc/rc.update_pkg_metadata */15 * * * * root /usr/local/bin/php /root/scripts/pfsense_zbx.php speedtest_cron 0,15,30,45 * * * * root /etc/rc.filter_configure_sync * * * * * root /usr/bin/nice -n20 /usr/local/bin/php /usr/local/sbin/acbupload.php 0 16 * * 7 root /usr/local/bin/php /usr/local/www/pfblockerng/pfblockerng.php bl shallalist,ut1 >> /var/log/pfblockerng/extras.log 2>&1 36 0 * * * root /usr/bin/nice -n20 /usr/local/bin/php /usr/local/sbin/execacb.php 0 14 * * * root /usr/local/bin/php /usr/local/www/pfblockerng/pfblockerng.php dcc >> /var/log/pfblockerng/extras.log 2>&1 */1 * * * * root /usr/local/pkg/servicewatchdog_cron.php 16 3 * * * root /usr/local/pkg/acme/acme_command.sh "renewall" | /usr/bin/logger -t ACME 2>&1 0 0 * * * root /usr/local/bin/php /usr/local/www/pfblockerng/pfblockerng.php cron >> /var/log/pfblockerng/pfblockerng.log 2>&1 */5 * * * * root /usr/bin/nice -n20 /usr/local/bin/php -f /usr/local/pkg/snort/snort_check_cron_misc.inc */5 * * * * root /usr/bin/nice -n20 /sbin/pfctl -q -t snort2c -T expire 1800 20 2 */28 * * root /usr/bin/nice -n20 /usr/local/bin/php -f /usr/local/pkg/snort/snort_check_for_rule_updates.phpEDITED:
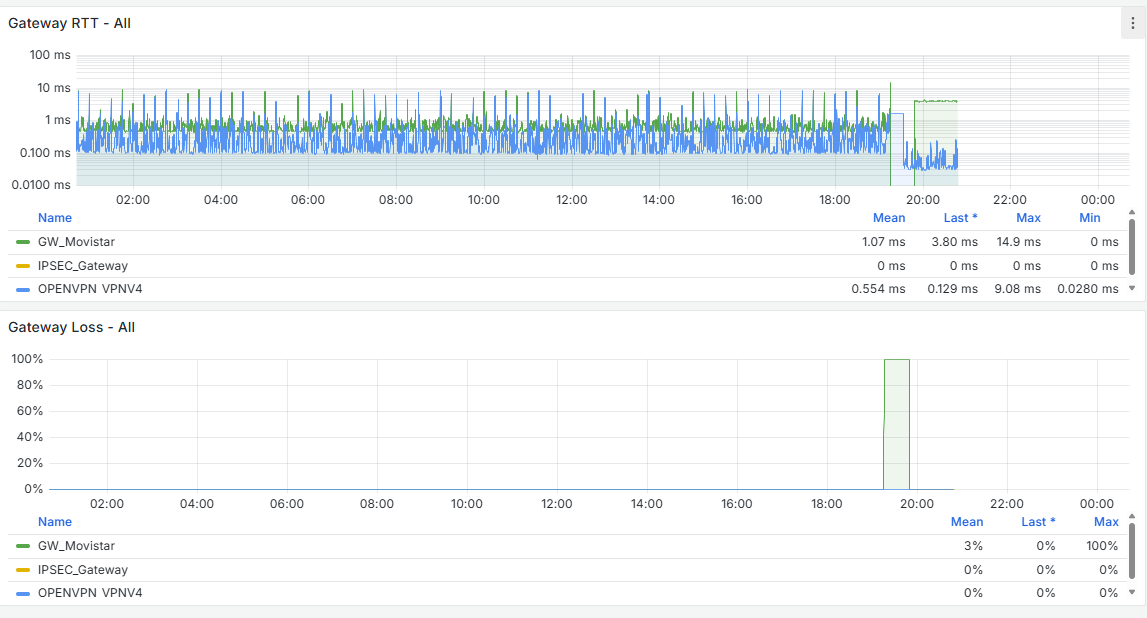
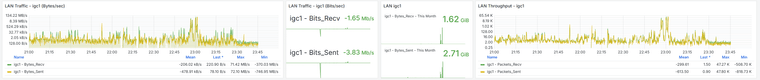
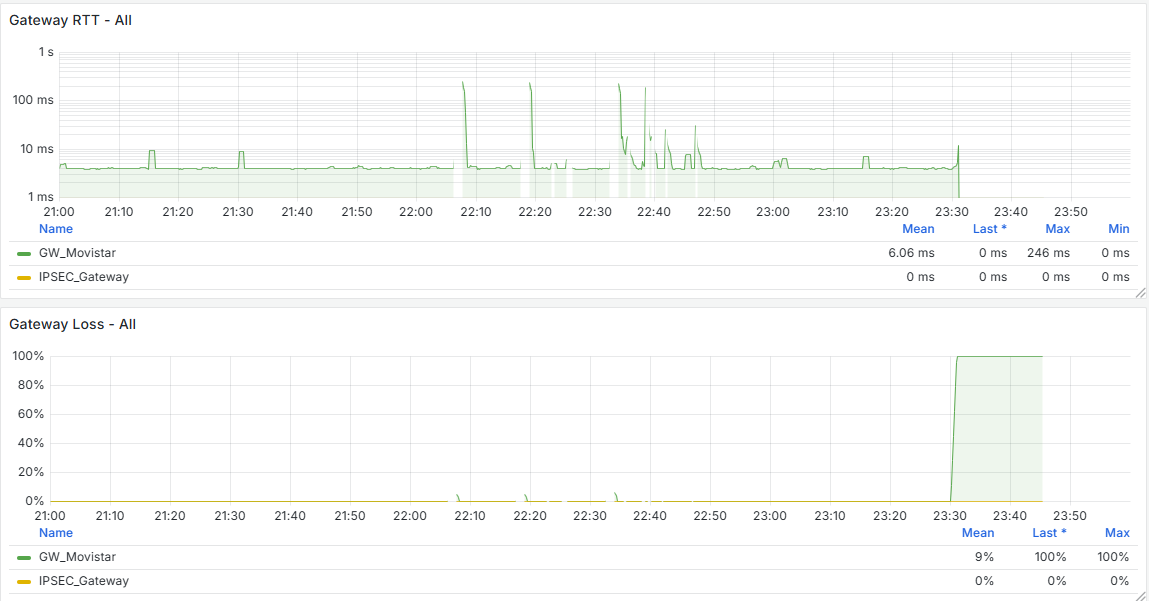
Alright, I just reviewed the last 30 days of Grafana data from the problematic firewalls, and I noticed that the WAN always drops at X:00, X:15, X:30, and X:45—so it clearly matches the reload that happens every 15 minutes.
I’ve read that this can be caused by rules that use schedules, and in my case, I do use schedules for some rules:
- Certificate renewal — I haven’t switched all of them to ACME via API yet
- Some backup tasks
- Limiters in some firewalls for bandwidth management
Could the issue be related to this?
Is it really necessary to perform this reload every 15 minutes? -
@dcuadrados said in Problems With WAN Loss Cobnection:
and I noticed that the WAN always drops at X:00, X:15, X:30, and X:45—so it clearly matches the reload that happens every 15 minutes.
Yeah, you've shown it already :

Where did that cron task come from ?
Btw :
I can't figure out a good reason why a backup should do "do" things with interfaces and/or their connection.
Neither for limiters.
Certificate renewal is this one :
and doesn't does nothing with interfaces.
This one :

is the anti-quality-of-live pfSense package. It creates problems, hard to find issues and constant pain.
This one :

isn't ideal neither ... Really, checking the speed of wan every 15 minutes ?
in reality, the bandwidth available is always known : it's the bandwidth the ISP gave you, minus what you are using at that moment. -
@Gertjan said in Problems With WAN Loss Cobnection:
It's automatically generated by the scheduler—that is, when I have rules enabled for specific time periods...
When I remove the schedulers, it disappears.My question is: can it be deleted manually? Will it be recreated after a reboot?
Supposedly, according to this, it should be resolved in these FreeBSD versions:
https://redmine.pfsense.org/issues/10414#!/usr/local/bin/php-cgi -f <?php /* * rc.filter_configure_sync * * part of pfSense (https://www.pfsense.org) * Copyright (c) 2004-2013 BSD Perimeter * Copyright (c) 2013-2016 Electric Sheep Fencing * Copyright (c) 2014-2025 Rubicon Communications, LLC (Netgate) * All rights reserved. * * Licensed under the Apache License, Version 2.0 (the "License"); * you may not use this file except in compliance with the License. * You may obtain a copy of the License at * * http://www.apache.org/licenses/LICENSE-2.0 * * Unless required by applicable law or agreed to in writing, software * distributed under the License is distributed on an "AS IS" BASIS, * WITHOUT WARRANTIES OR CONDITIONS OF ANY KIND, either express or implied. * See the License for the specific language governing permissions and * limitations under the License. */ require_once("config.inc"); require_once("functions.inc"); require_once("filter.inc"); require_once("shaper.inc"); require_once("ipsec.inc"); require_once("vpn.inc"); filter_configure_sync(); ?> -
@dcuadrados said in Problems With WAN Loss Cobnection:
but the ones failing are these—specifically the ones with i225 and i226 NICs.
What version of the NIC chips are they using? The early revision i225s especially were known for dropping connections. But I assume here you don't actually see the link loss?
[25.03-BETA][admin@4100-2.stevew.lan]/root: pciconf -lv igc0
igc0@pci0:4:0:0:	class=0x020000 rev=0x03 hdr=0x00 vendor=0x8086 device=0x15f3 subvendor=0x8086 subdevice=0x0000
    vendor     = 'Intel Corporation'
    device     = 'Ethernet Controller I225-V'
    class      = network
    subclass   = ethernet
There you can see it's a rev.3 chip which had fixed the earlier issues.
-
@stephenw10 said in Problems With WAN Loss Cobnection:
¿Qué versión de los chips NIC están utilizando? Los primeros i225 de revisión eran especialmente conocidos por perder conexiones. ¿Pero supongo que aquí en realidad no ves la pérdida del enlace?
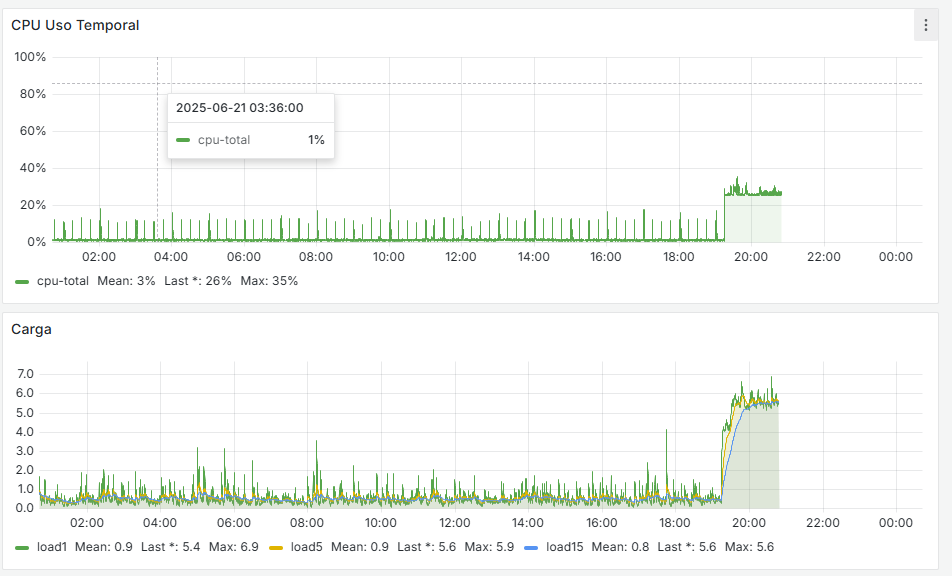
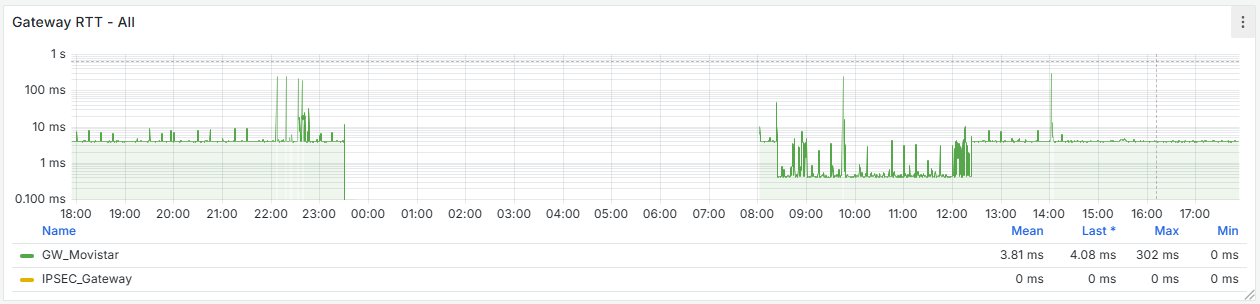
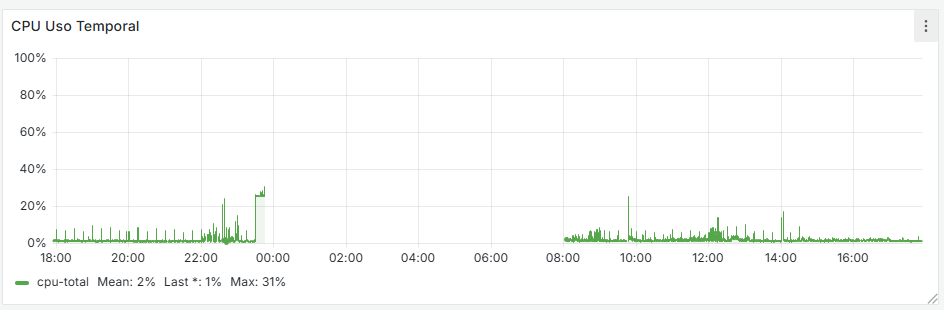
It seems that after removing that cron job, the firewall has completely stabilized. If you look at the graphs, there used to be spikes every 15 minutes—both on the WAN and CPU usage—and now they’re gone. I’m attaching the last 24 hours of graphs below. Now the key is to understand why that cron job is generated and whether it’s actually necessary.
As for the driver, it’s using the following version:
igc0@pci0:1:0:0: class=0x020000 rev=0x03 hdr=0x00 vendor=0x8086 device=0x15f3 subvendor=0x8086 subdevice=0x0000 vendor = 'Intel Corporation' device = 'Ethernet Controller I225-V' class = network subclass = ethernet@Gertjan said in Problems With WAN Loss Cobnection:
Este:
tampoco es ideal... ¿En serio, comprobar la velocidad de wan cada 15 minutos?
En realidad, el ancho de banda disponible siempre se conoce: es el ancho de banda que te dio el ISP, menos lo que estás usando en ese momento.Regarding what you mentioned about the speed-related cron job, that was something I added to test a few things in Zabbix—but I don’t even use Zabbix anymore, since I now do monitoring with Grafana and Wazuh. I’ve removed those as well, and now I need to move all my ACME setups to API-based renewal using token authentication instead of relying on port-based renewal.
I’ll monitor how it behaves over the weekend, but it seems like we’ve made some progress. Huge thanks to both of you! I’ll keep you posted.
@Gertjan said in Problems With WAN Loss Cobnection:
Sí, ya lo has demostrado:
¿De dónde surgió esa tarea cron?
As I mentioned earlier, this happens when schedules are used for the rules. It seems that every 15 minutes it kills all states to enforce the schedule and the associated rules.

-
The filter configure sync cron job shouldn't cause a significant issue. It certainly shouldn't cause a complete loss of connectivity.
But let's see how it goes....