Telegraf and Grafana Dashboards

-
I've been playing around with Grafana lately and added the Telegraf package to my pfSense. I did some searching around but didn't see many discussions on Telegraf and what folks are graphing. On Grafana's Dashboard page I did find a couple basic dashboards (5438 and 8228) that use Telegraf and Influxdb. There are dashboards for other data sources/databases.
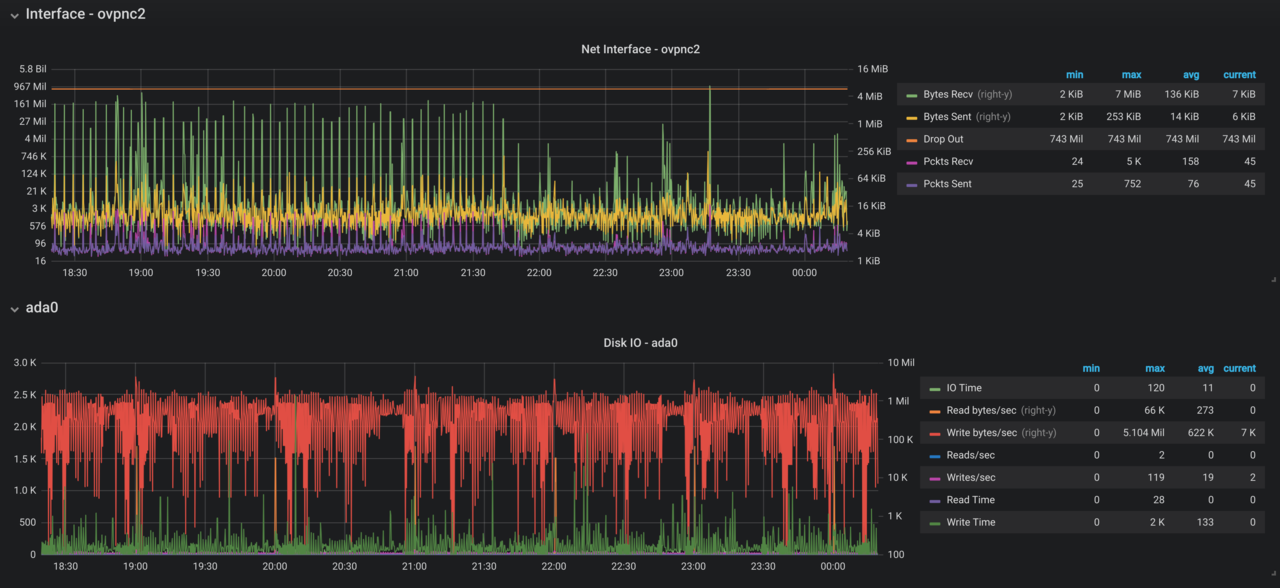
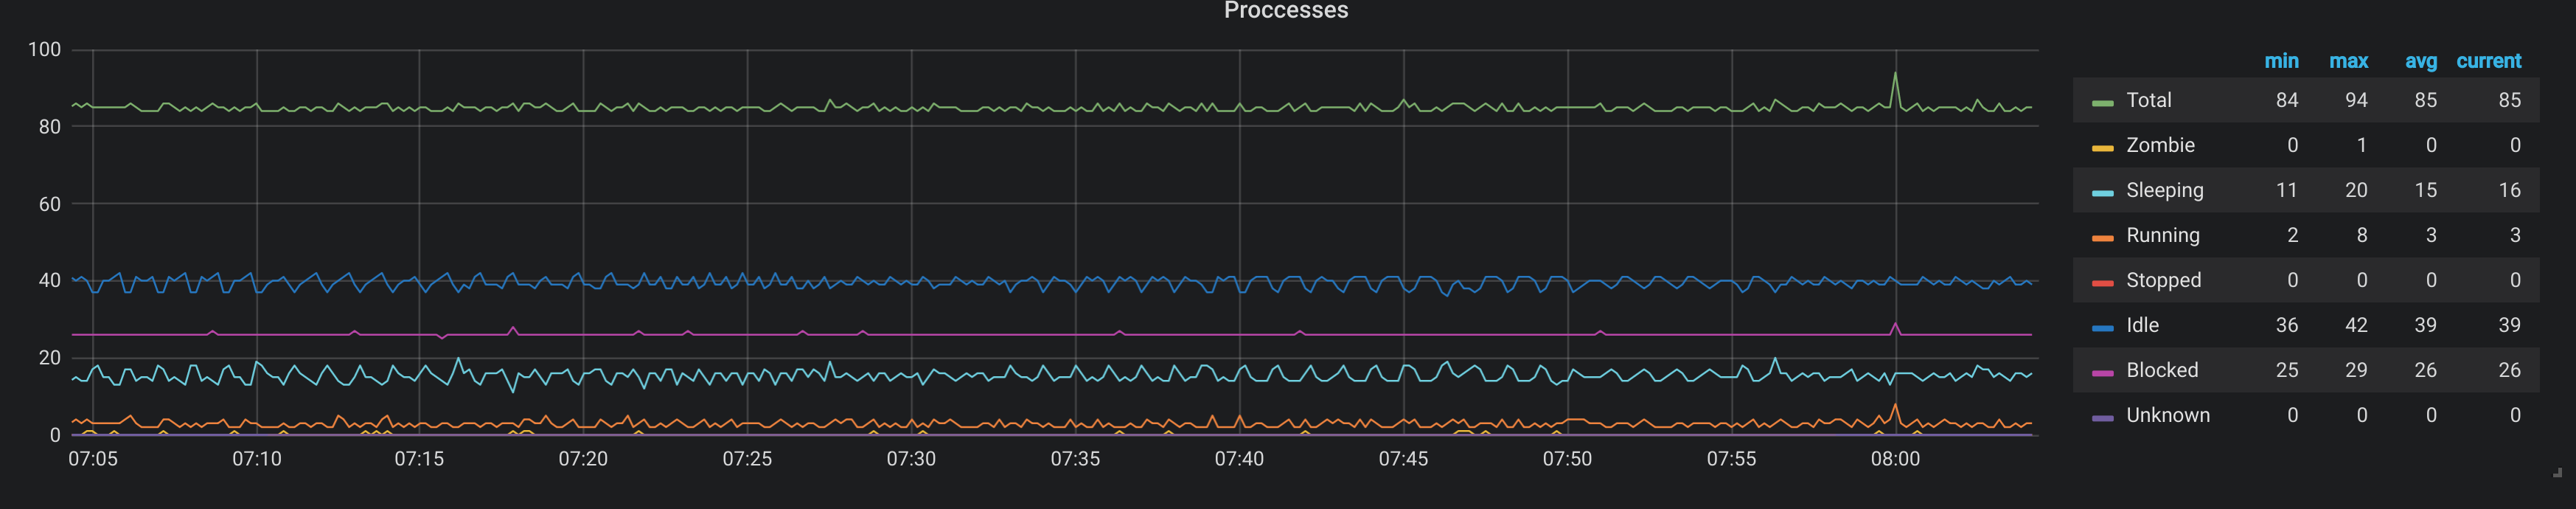
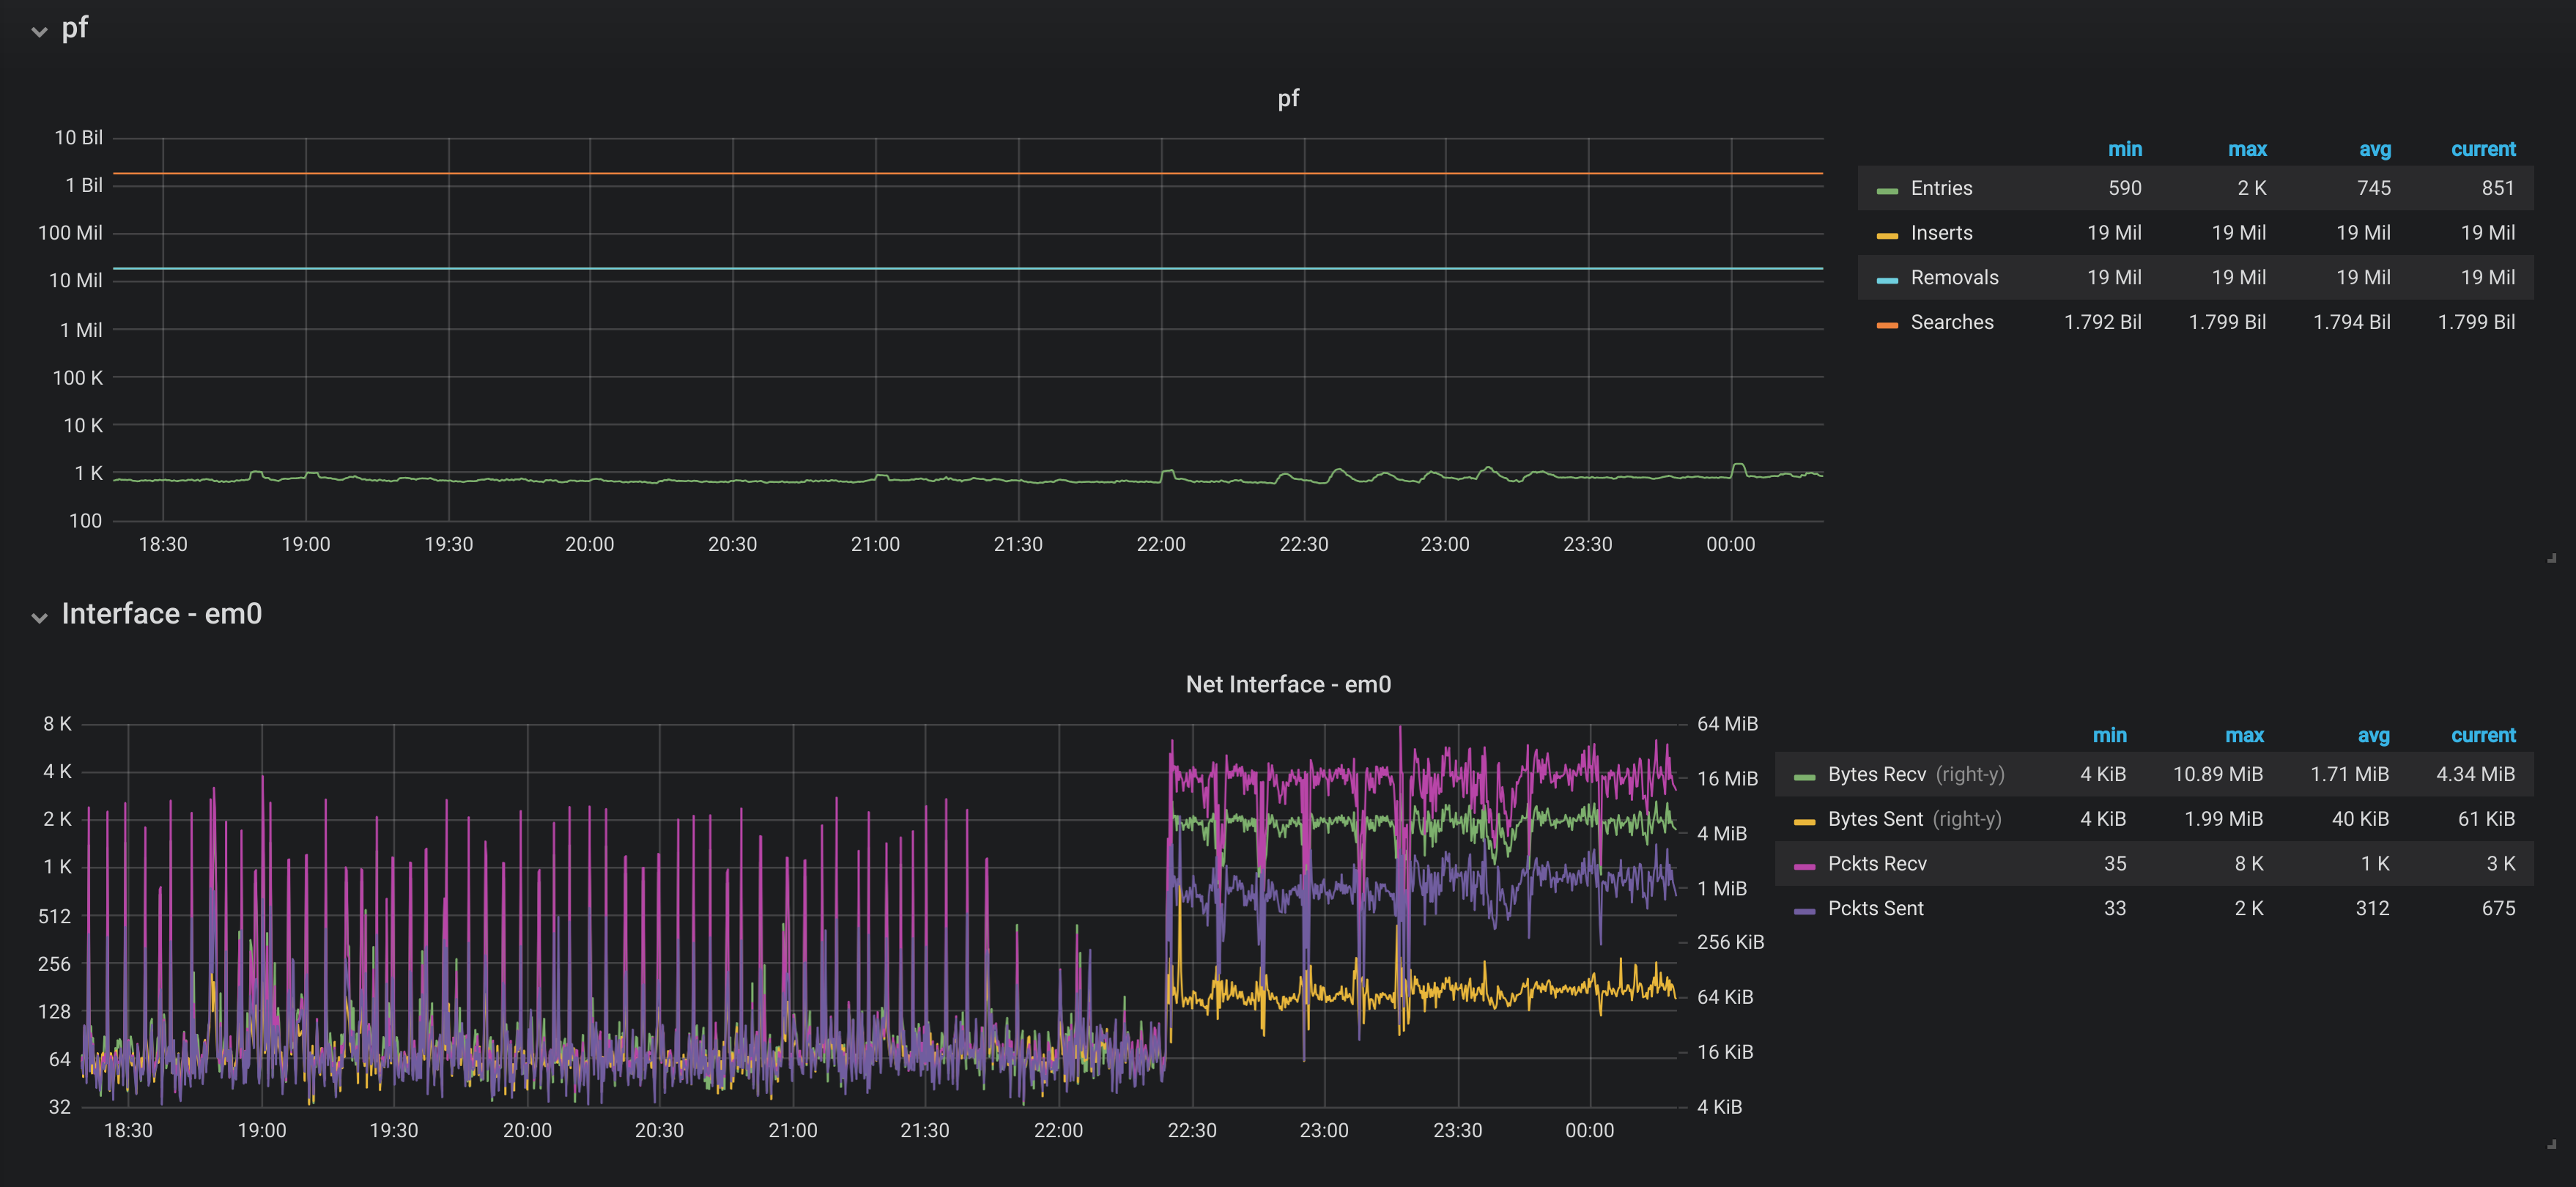
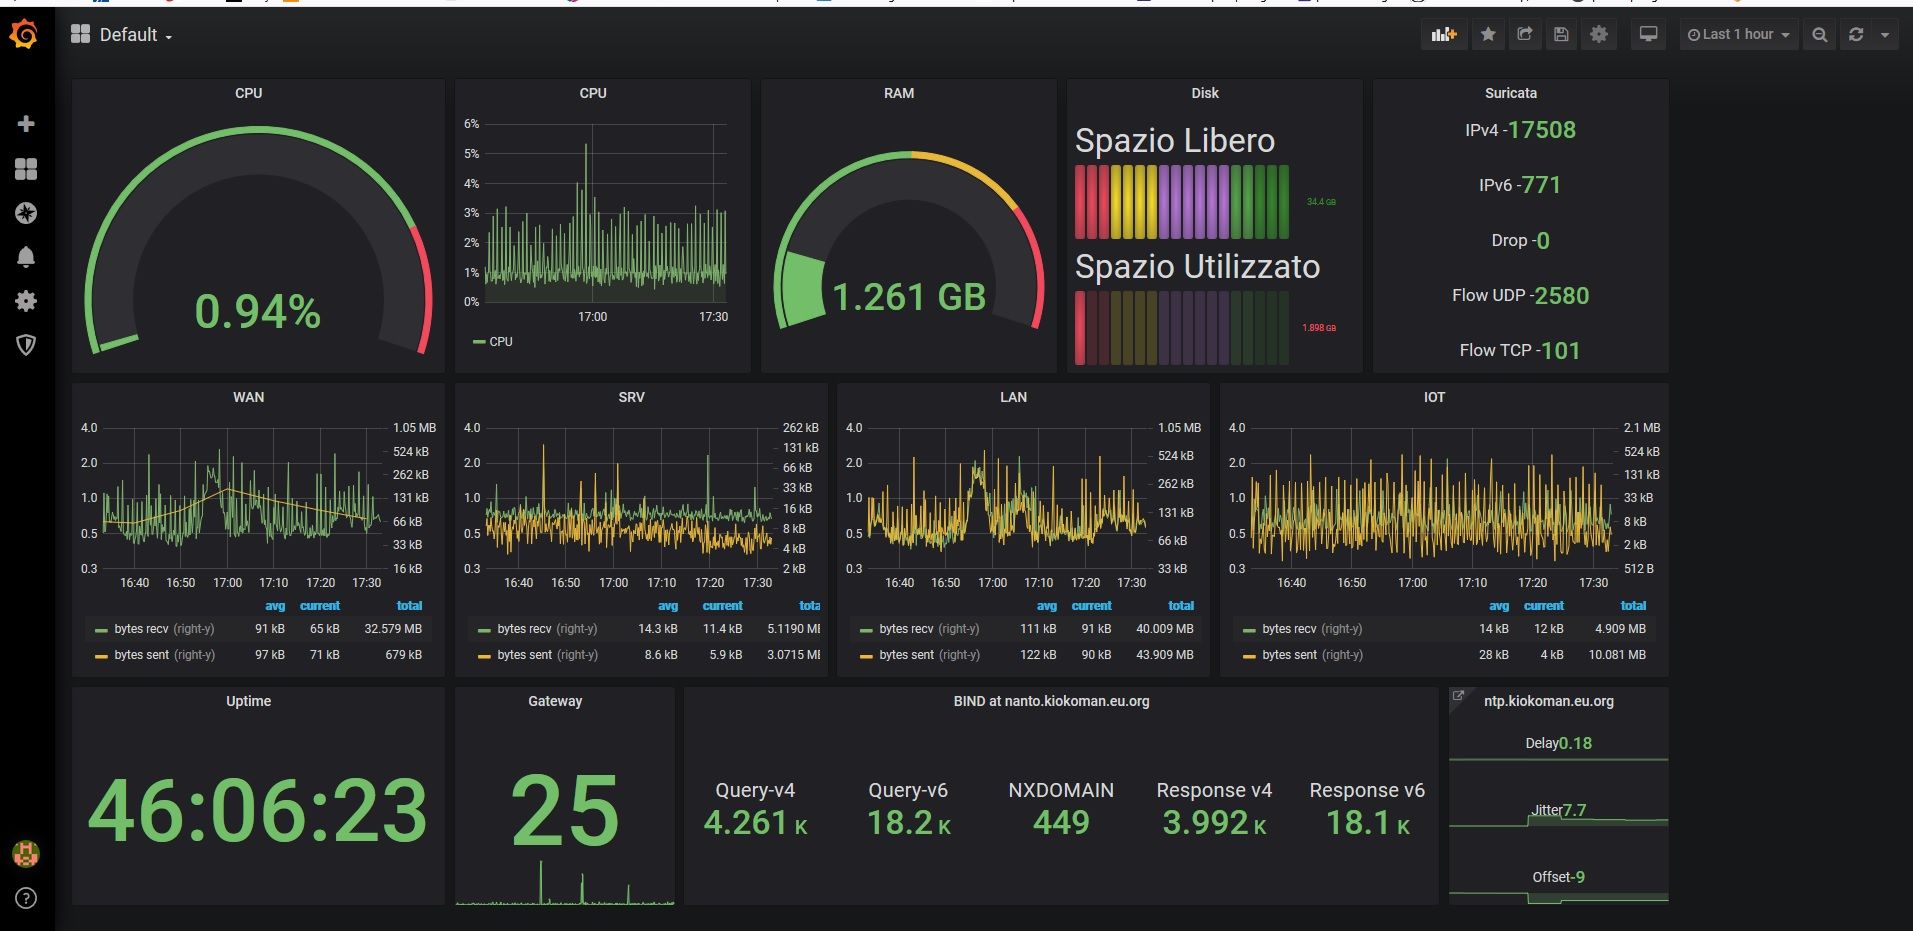
I created a dashboard and added it to Grafana's Dashboard community page (9806 here). I'm still tweaking it, but here are some screenshots:
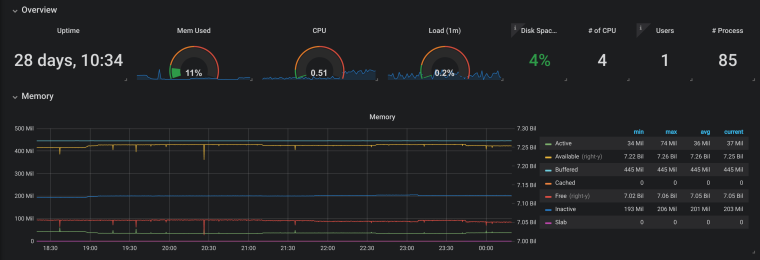

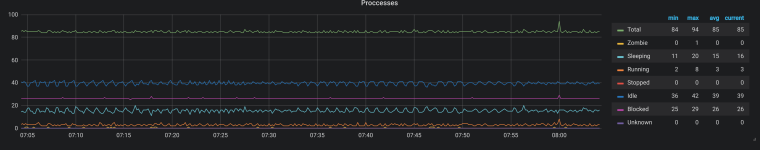
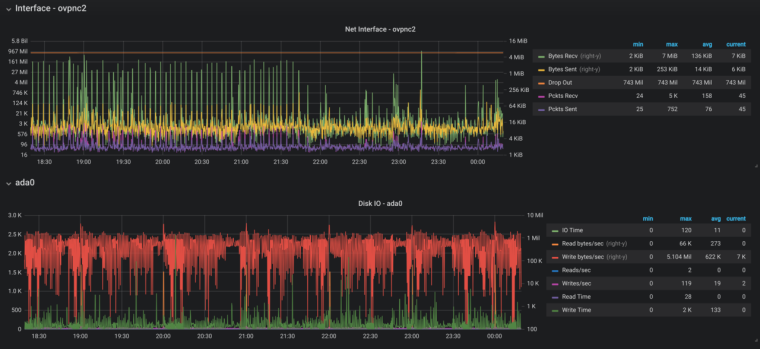
These are all part of one dashboard, just easier to take multiple screenshots.
Just curious what others have done and always appreciate feedback.
-
@drcstang actually using this dashboard today, and I made some slight tweaks but honestly, your dashboard rocks outta the box!
-
@jlw52761 Thanks for the kind words! Glad you found it useful.
-
we can make this thread as the "show your Grafana Dashboard"

i just started playing with this toy
-
Recently (May-Jun 2025) Grafana received a HUGE update (even possible to saying “reworked from scratch” because some fundamental changes made): from more closely integration with GitLab CVS and making the database abstraction layer to tabs, custom and dynamic dashboards and interactive elements.
After some time of stagnation, “new Grafana” start to receive a real most asked and usable updates. Just look at this!With this new updates Your Grafana’s dashboard for pfSense receive a REALLY USEFUL FORM !
P.S.
And personally I need to note that pfSense Dashboard lost their actuality because in Grafana You may receive more usable, dive-in-detailed, much more detailed and granulated, interactive view and (in some cases, more important than view) strongly secured user authentication scheme.