Strange Memory
-
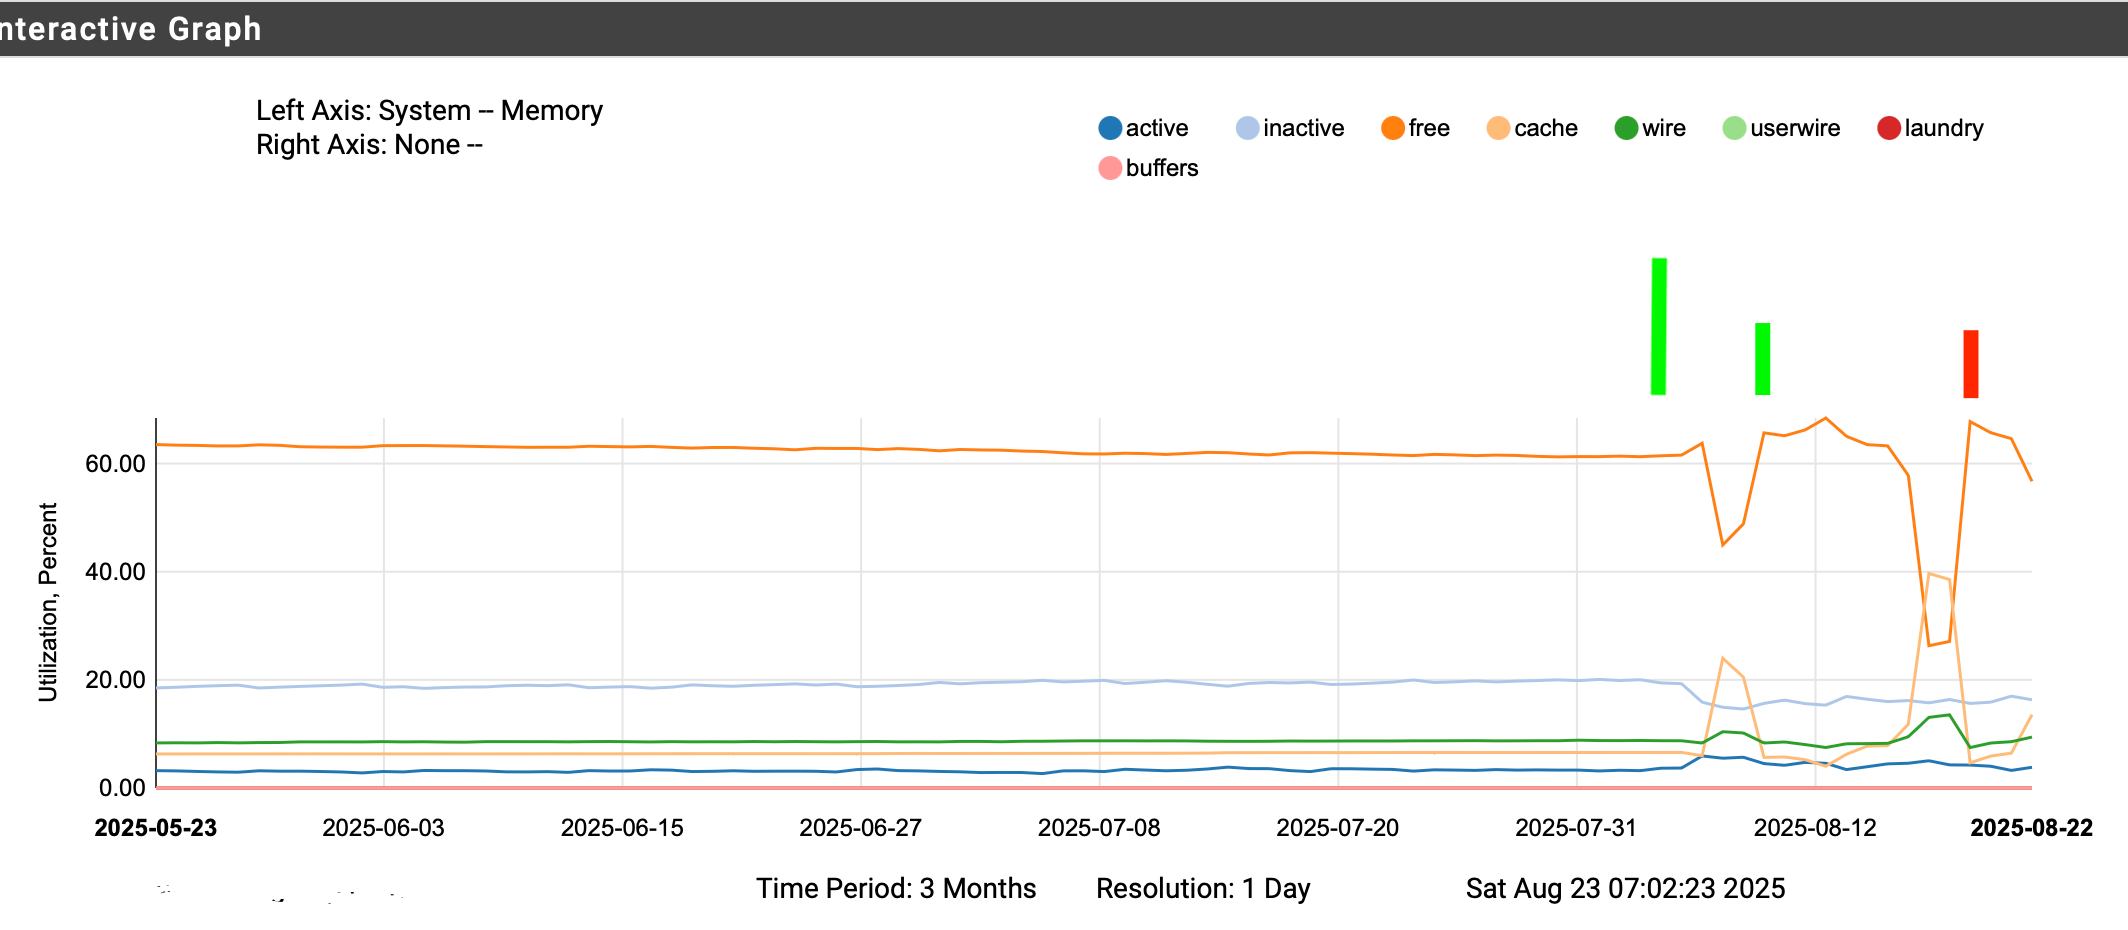
So since upgrading to 25.07 and then 25.07.1 there is this strange shift in memory from free to cache with none of the other baselines changing significantly.
Left of the first tall green line is 24.11
then came 25.07 and after about 4 days running. down on the free up on the cache.
reboot to see if I could spot anything.
then along came 25.07.1 same thing about 4 days in and a much bigger shift from free to cache.
I did a reboot here (red bar) but it has since (again about 4 days) later done the big flip. I'm going to let it run this way, to see if this is the new normal or if it continue more days from now.Everything is running fine. It just seems on that it runs 4 days and then does this.
Change in the memory accounting ?Just curious
-
Hmm, interesting. Not necessarily a problem. Can you see what runs when this starts to happen?
-
Not too concerned - it is for now just an observation for the 260+ days the system was running uninterrupted under 24.11. never a huge bump like this. since 25.07 that's what I see.
zooming in and looking at the "start" time, there is nothing specifically scheduled. when the events (change) start is not even at the same time of day. Other than being somewhere on the 4th day after a reboot, it appears random when it happens.
ZFS ? doing something different maybe - but 4 days in - just curious and watching.
-
hah, spoke too soon -- it is ARC
I just happened to be looking and managed to snag this from top on a ssh session
at 7:50 this for a baseline and the expectation of grabbing another next time it happened
CPU:  4.6% user,  0.7% nice,  3.6% system,  0.4% interrupt, 90.8% idle
Mem: 172M Active, 244M Inact, 421M Wired, 2469M Free
ARC: 142M Total, 39M MFU, 98M MRU, 148K Anon, 887K Header, 3643K Other
who knew at 7:55 this -
CPU:  4.6% user,  0.7% nice,  3.6% system,  0.4% interrupt, 90.8% idle
Mem: 241M Active, 176M Inact, 1565M Wired, 1326M Free
ARC: 1165M Total, 112M MFU, 966M MRU, 148K Anon, 14M Header, 70M Other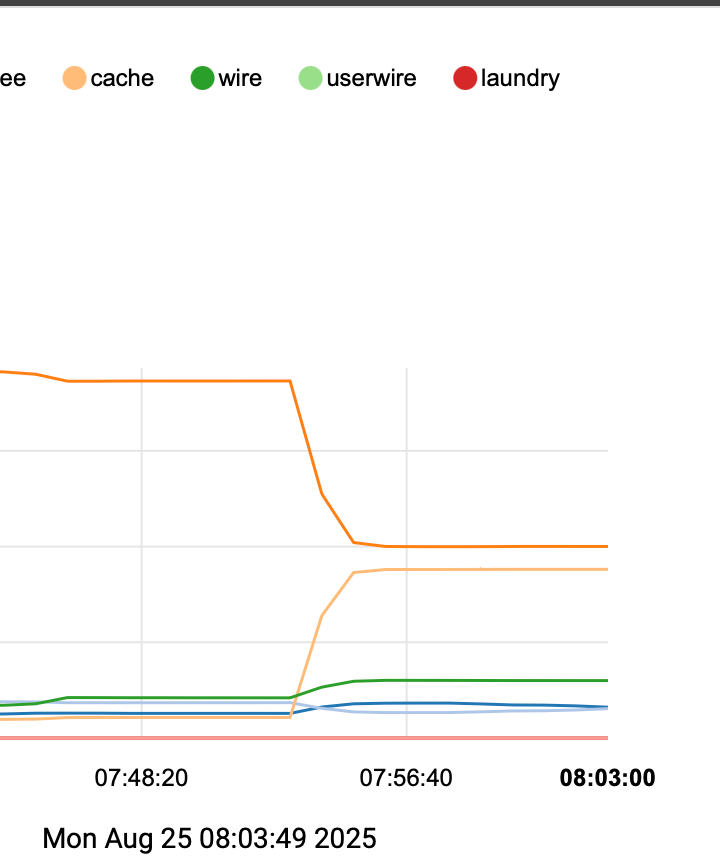
top doesn't show cache specifically, but it is considered part of wired,
the only other thing I see in top is the unit of measure change from K to M on header and other values.cool - begs the question why the difference in "reporting"
25.07 something got "fixed" in the ARC memory accounting ?
kind of makes me wish I new what the values for ARC looked like on 24.11
Nothing special at this time frame (no "jobs" scheduled) not really any heavy system load,
seems maybe this is just the a "normal" unless you can think of anything else to check?
-
Hmm, the ZFS usage was changed to reduce drive writes. You may be seeing that using additional RAM as a result.
Is it actually causing a problem?
-
@stephenw10 said in Strange Memory:
Is it actually causing a problem?
Anything that is different from the "Norm" is a problem until we understand the reason.
The system for 2 versions before 25.07 never had this behaviour. Now there is a new pattern. Clearly there is an interaction here with the use of RAMdisk.
The whole 4 day delay thing before it shifts is most curious. Like what ARC takes 4 days to figure something out and make adjustments.Is there a bring the system down problem, No.
No unfortunately, due to other circumstances, I've had to reboot before hitting say day 8 to see if something else happens.I'm actually starting to think it might somehow be related to the syslogd issue. But the timing is a little off (I think) I've moved one of those syslog servers planned maintenance from Thursday to Friday (and restarted the Netgate) if the memory exhibits the shift on Friday then that might be the problem...
Or it could be nothing, or something else, just trying to understand.
I'd like to get back to the point where I can just glance at the data again and say "yup" everything is fine and run for 260+ uninterrupted days (like 24.11)
-
You could try reverting the ZFS change to see if that restores the previous behaviour. https://redmine.pfsense.org/issues/16210
-
I'll hold on any changes to ZFS for now --
I think the timing and data are pointing more to this observation being an "artifact" and that it is actually caused by the syslogd issue.
I think from looking at the change I highlighted in the syslogd thread that when the remote goes down, and perhaps only if there are two destinations, the syslog code does in fact fail on the reconnect attempt. but it the mean time it continues to try to spew output to a destination (1 of 2) that is not available. those messages are still going somewhere, (we know they still go the the other syslog receiver and the local files, (as they should). but I think they are also getting "lost in space".
I think it is most likely the flood of "sendto: Host is down" messages that I don't see in the logs during the event, (they actually don't show on either destination or local files, but other messages do) on the production server
presumably those messages are going somewhere, and if the remote is down long enough and depending on available memory this is when the memory shift happens. Left unchecked long enough syslog eventually crashes (likely runs out of memory)even restarting syslogd does not recover this memory shift.
in the graphs the difference between the large shift and the smaller shift is an indication of how long the remote was down and syslog subsequently restarted. Also explains why the shift takes time to go from high to low. Sad part is that restarting syslog does not seem to reclaim that shifted memory - rebooting does. (unless the shift back would take a really long time, I think that "memory" allocation is "lost in space" - the longest the system ran before I restarting when in the shifted mode was a little over a day.
Monday morning was the latest observation and I restarted the system and memory has been at "24.11 normal" levels since - I also noted then that I moved the next scheduled syslog receiver server planned outage from Thursday to Friday Theory being if it doesn't shift until then, (that would be a different day timing ) then syslog has been the cause of this memory observation all along.
https://forum.netgate.com/topic/198418/25.07-unbound-pfblocker-python-syslog?_=1756291874803
-
^^ yes - this. - and the syslogd fix in the works should resolve this.