Traffic shaping FQ_CODEL - what should 'Limiter Info' look like under heavy load?
-
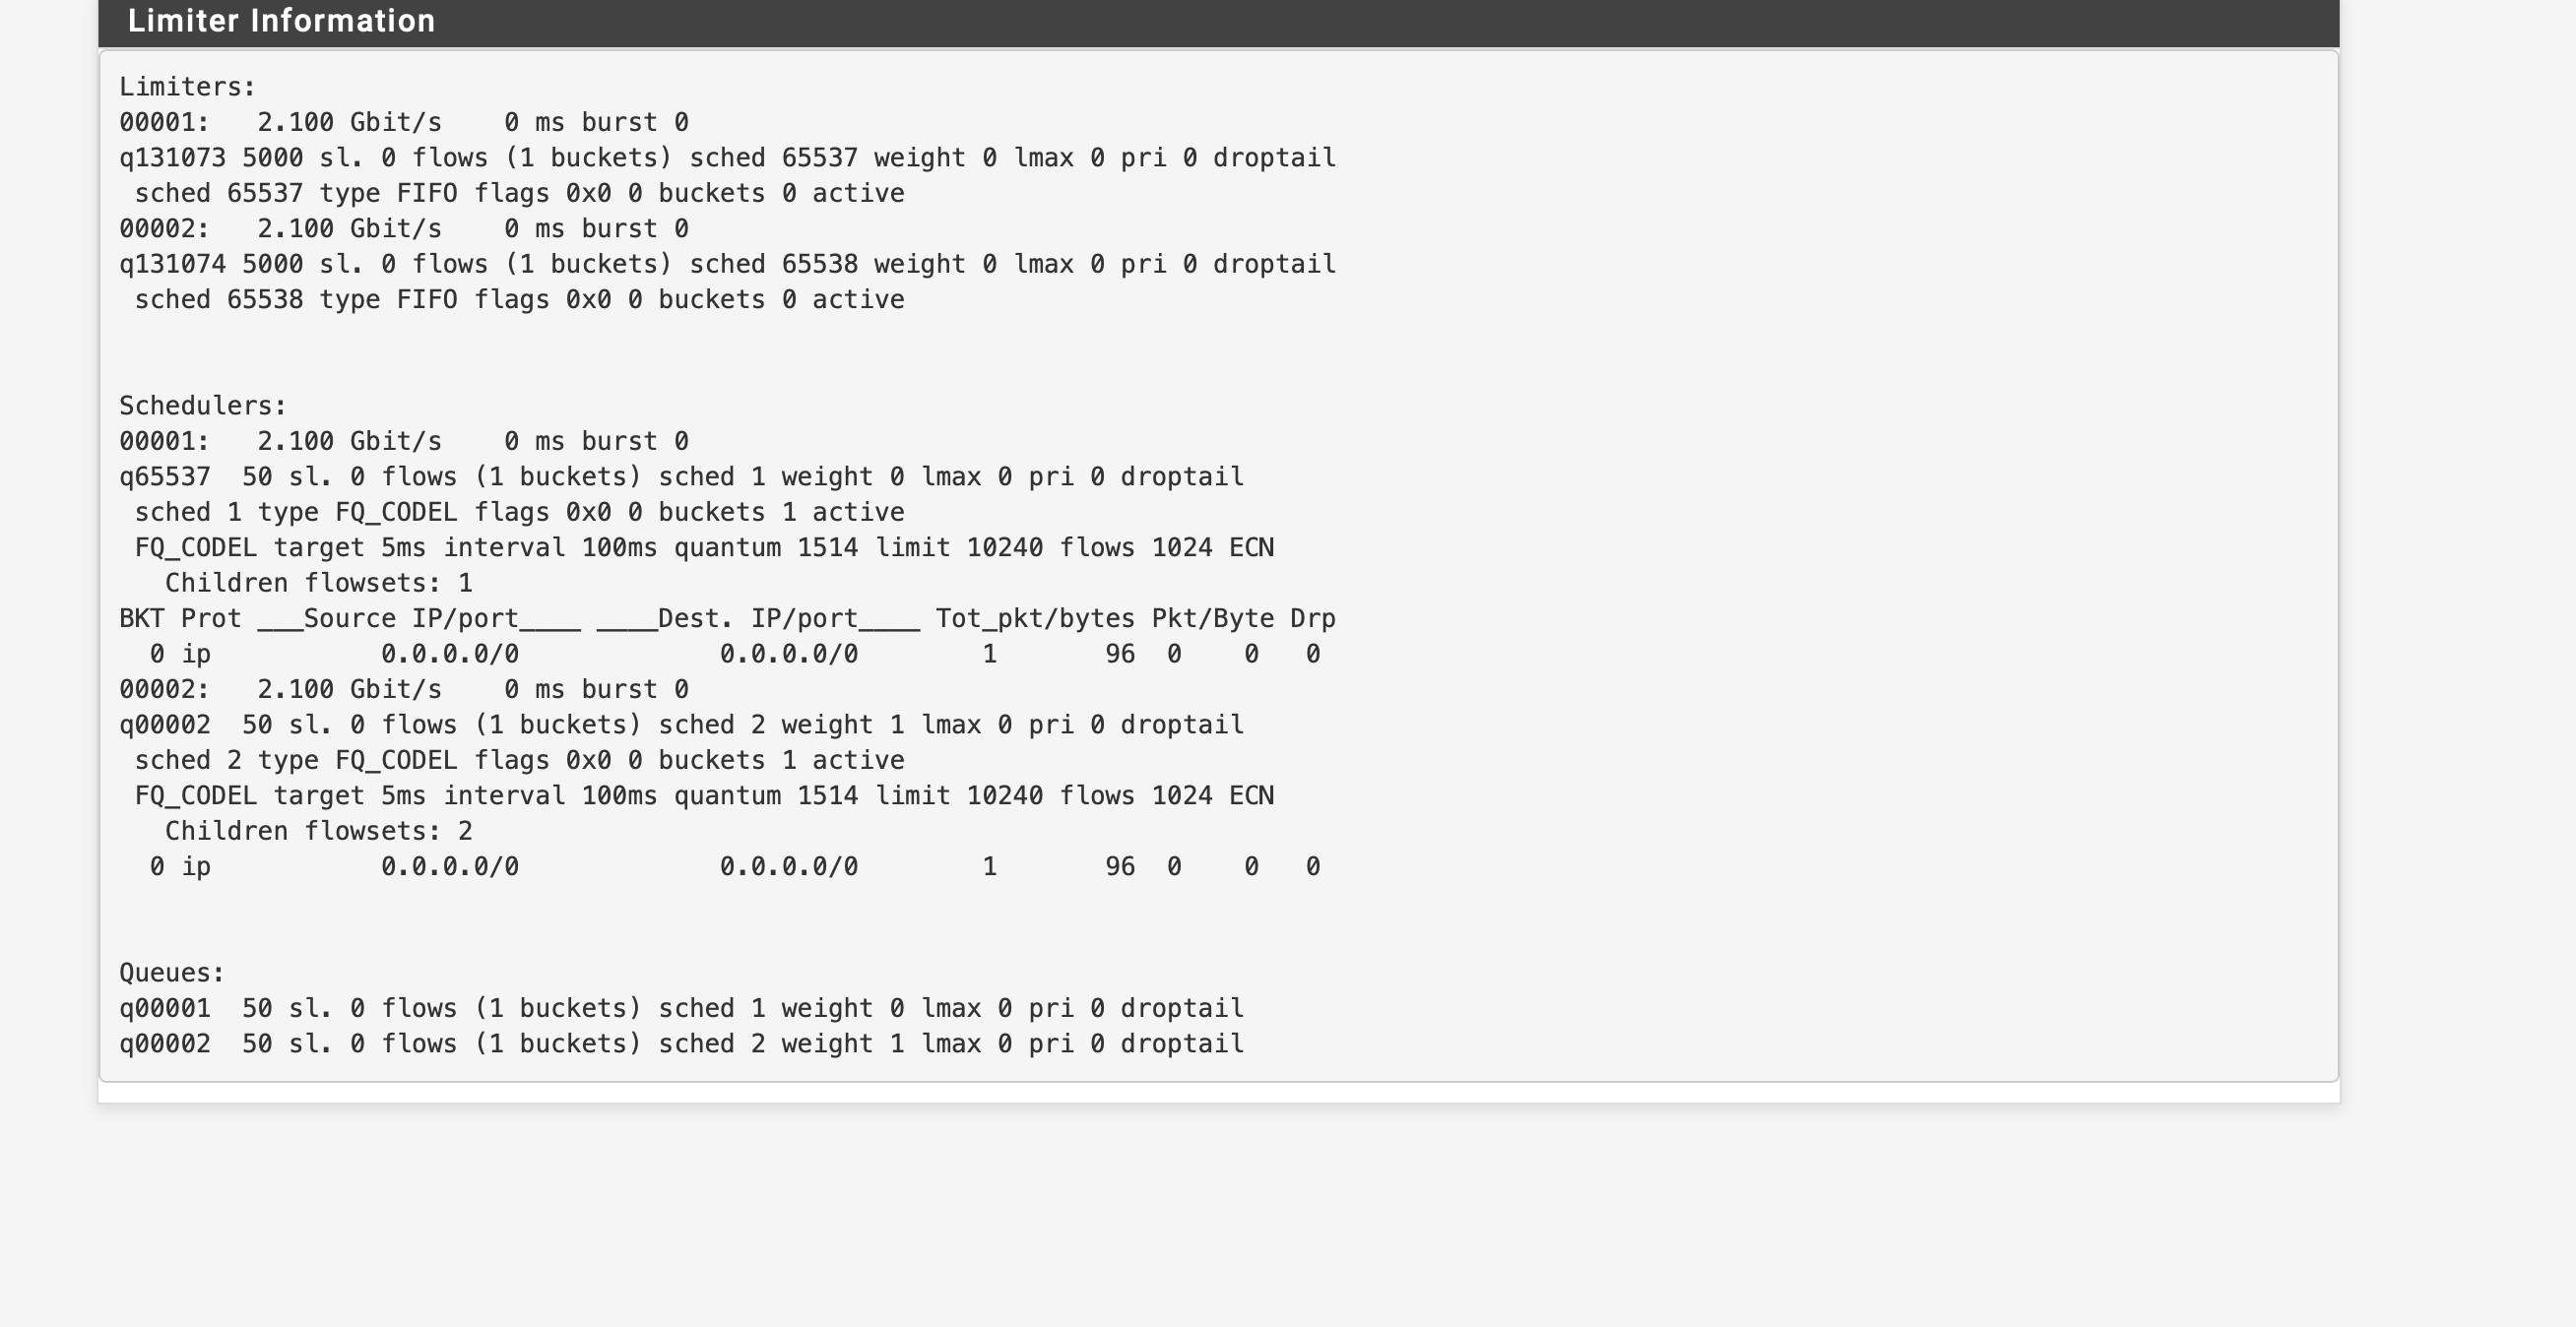
I've configured FQ_CODEL limiters on my WAN connection as per the documentation's recipe, and they seem to be having some kind of effect, but I'm very unclear about how to interpret the info from Diagnostics > Limiter Info. For example, here is a screenshot captured when under heavy load (iperf3 speed test saturating WAN connection).
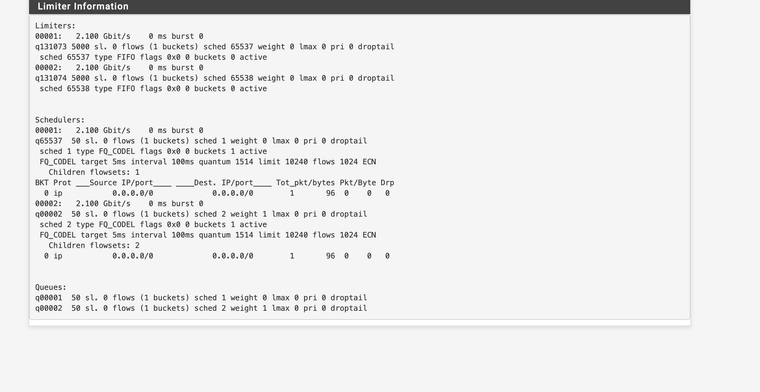
Q1: Is it saying that there is just one bucket in each queue? Is that expected?
Q2: Why, when under heavy load, does it only intermittently show any data for the 'Children flowsets' and when it does there seems tp be almost nothing there.
Q3: My WAN connection is PPPoE with MTU 1492. Should I adjust the quantum downwards (since the value of 1514 is based on an MTU of 1500 plus some kind of padding)? If so, to what should I reduce it?
-
I cannot say more about questions Q1 and Q2.
About Q3.
I have a PPPoE line, 1Gbps/300Mbps, MTU is 1492. My line is fine also without limiters, I had a solid A for bufferbloat, RTT is 6ms (first hop)
I tried limiters, using 1506 as quantum (1492 + 14 interface overhead), set limit at 7ms for download and 5ms for upload, bandwidth (950/285)
I tested with thoese limiters, set the floating rules as per netgate instructions, and now I have a solid A+ on bufferbloat test, with average speeds of 930/280.I suggest to test against bufferbloat issues before using limiters, then repeat the test using limiters so you can see if they are working and improving latency management.