High CPU usage from egrep in pfSense+ v25.07.1
-
@stephenw10 Indeed, they last only a second. Here is the output, thank you for the pause information.
  PID USERNAME    PRI NICE   SIZE    RES STATE    C   TIME    WCPU COMMAND
 5305 root        114   20    14M  2324K CPU5     5   0:01  97.94% egrep -v \\(([0-9a-f:.]|\\[|\\])+\\) (\\->|<\\-)
 1763 root        114   20    14M  2324K CPU1     1   0:01  97.91% egrep -v \\(([0-9a-f:.]|\\[|\\])+\\) (\\->|<\\-)
 6277 root        114   20    14M  2328K CPU13   13   0:01  97.91% egrep -v \\(([0-9a-f:.]|\\[|\\])+\\) (\\->|<\\-)
 1424 root        114   20    14M  2320K CPU15   15   0:01  97.75% egrep \\(([0-9a-f:.]|\\[|\\])+\\) (\\->|<\\-)
   11 root        187 ki31     0B   256K CPU0     0 207.0H  54.05% [idle{idle: cpu0}]
   11 root        187 ki31     0B   256K RUN     10 218.3H  48.24% [idle{idle: cpu10}]
   11 root        187 ki31     0B   256K CPU4     4 208.9H  47.82% [idle{idle: cpu4}]
   11 root        187 ki31     0B   256K RUN      8 208.6H  45.40% [idle{idle: cpu8}]
   11 root        187 ki31     0B   256K CPU7     7 206.5H  44.63% [idle{idle: cpu7}]
   11 root        187 ki31     0B   256K RUN      2 204.7H  44.06% [idle{idle: cpu2}]
   11 root        187 ki31     0B   256K CPU12   12 203.1H  43.89% [idle{idle: cpu12}]
   11 root        187 ki31     0B   256K CPU6     6 206.4H  42.12% [idle{idle: cpu6}]
   11 root        187 ki31     0B   256K RUN     15 195.6H  40.35% [idle{idle: cpu15}]
   11 root        187 ki31     0B   256K RUN      3 199.1H  40.01% [idle{idle: cpu3}]
   11 root        187 ki31     0B   256K RUN     13 203.1H  39.98% [idle{idle: cpu13}]
   11 root        187 ki31     0B   256K CPU14   14 203.2H  39.81% [idle{idle: cpu14}]
   11 root        187 ki31     0B   256K CPU9     9 206.8H  37.60% [idle{idle: cpu9}]
   11 root        187 ki31     0B   256K RUN     11 194.7H  33.27% [idle{idle: cpu11}]
   11 root        187 ki31     0B   256K RUN      5 194.1H  31.14% [idle{idle: cpu5}]
   11 root        187 ki31     0B   256K RUN      1 195.6H  30.36% [idle{idle: cpu1}]
They last very briefly but are repeating almost every second or every other second etc
-
Hmm, OK. That should only run every 60s....

It looks like you have numerous updaterrd processes running. Does this problem continue across a reboot?
-
@stephenw10 Before rebooting the CPU usage was 75% on the Dashboard, after rebooting its 11%.
I do believe I saw high CPU usage like this last week before a reboot too. Perhaps its a cumulative issue?
-
Yes it could be something starting more and more updaterrd processes for some reason.
How many do you see from:
ps -auxwwd | grep updaterrd?For example:
[25.07.1-RELEASE][root@fw1.stevew.lan]/root: ps -auxwwd | grep updaterrd
root    61441   0.0  0.1   4728   2296  0  S+   17:23      0:00.01 |         `-- grep updaterrd
root    52916   0.0  0.1   5260   2728  -  IN   Mon23      2:19.79 |-- /bin/sh /var/db/rrd/updaterrd.sh
root    68822   0.0  0.1   5260   2728  -  IN   Mon23      2:20.28 |-- /bin/sh /var/db/rrd/updaterrd.sh
Also for reference:
[25.07.1-RELEASE][root@fw1.stevew.lan]/root: wc -l /tmp/pfctl_ss_out
    1185 /tmp/pfctl_ss_out
[25.07.1-RELEASE][root@fw1.stevew.lan]/root: time sh -c "cat /tmp/pfctl_ss_out | egrep -v '\(([0-9a-f:.]|[|])+\) (\->|<\-)' | wc -l | sed 's/ //g'"
779
0.026u 0.039s 0:00.04 125.0%	60+292k 0+0io 0pf+0w
You might try that against your far larger states file to check how long it takes.
-
Here is the result of that command:
root    64317    0.0  0.0  14728   3340  -  S    18:36      0:00.00 | | `-- sh -c ps -auxwwd | grep updaterrd 2>&1
root    64926    0.0  0.0  14160   2800  -  S    18:36      0:00.00 | |   `-- grep updaterrd
root    23043    0.0  0.0  14648   3324  -  IN   17:24      0:08.08 |-- /bin/sh /var/db/rrd/updaterrd.sh
root    48380    0.0  0.0  14648   3328  -  SN   17:55      0:04.80 |-- /bin/sh /var/db/rrd/updaterrd.sh
The other command output:
2.09 real 2.01 user 0.05 sysStates right now 188K with 22% CPU usage consistently. By comparison directly after the reboot it was at 178K states and 11% usage.
-
The actual time taken to parse the file is what counts there. On the 1K states I have you can see it takes 39ms and runs every 60s so not significant.
-
Apologies, I cropped out the time response, it takes 4098ms.
-
Hmm, that's a significant time....
-
I guess it sort of makes sense if you take your time of 39ms for 1K states and times it by 188 you get almost 8 seconds.
If we take away the overheads and assume a lot of efficiencies from performing one large egrep as opposed to opening a theorhetical 188 files and performing 188 egreps I could see how it could be 4 seconds for 188K states.
-
Yup, I'm running on a 3100 too which is probably many times slower than your CPU.
Either way it looks like it's probably the multiple process spawning causing the issue. Let's see if they start to multiply again over time.
-
@stephenw10 Just thought I'd give an update on this. So it has been a week since the reboot an the high CPU usage issue has not returned. Right now it's around 11-14% with 200,000 states.
I guess it was just one of those fleeting issues. I'll report back if I see it go high like before.
-
Hmm, interesting. So still only one or two updaterrd processes?
-
@stephenw10 It's still showing a few simuleanteously, but every minute or so, not every other second like it was before.
-
Dear Stephen10,
I'm now at 16 days of uptime and the problem has returned. The firewall is practically idle with only 1-2Mb/s of data moving in/out through one of my two WAN's and the CPU usage is between 50% and 70% constantly.
This is what I get from top -aSH -sl
  PID USERNAME    PRI NICE   SIZE    RES STATE    C   TIME    WCPU COMMAND
14729 root        114   20    14M  2744K CPU15   15   0:02  83.25% egrep -v \\(([0-9a-f:.]|\\[|\\])+\\) (\\->|<\\-)
   11 root        187 ki31     0B   256K RUN      0 300.8H  53.18% [idle{idle: cpu0}]
 3366 root        112   20    14M  2636K CPU14   14   0:01  51.27% egrep -v \\(([0-9a-f:.]|\\[|\\])+\\) (\\->|<\\-)
13332 root        112   20    14M  2644K CPU5     5   0:01  50.23% egrep -v \\(([0-9a-f:.]|\\[|\\])+\\) (\\->|<\\-)
21415 root        112   20    14M  2636K CPU11   11   0:01  49.49% egrep -v \\(([0-9a-f:.]|\\[|\\])+\\) (\\->|<\\-)
23033 root        112   20    14M  2640K CPU13   13   0:01  49.47% egrep -v \\(([0-9a-f:.]|\\[|\\])+\\) (\\->|<\\-)
   11 root        187 ki31     0B   256K CPU8     8 297.9H  47.07% [idle{idle: cpu8}]
   11 root        187 ki31     0B   256K CPU10   10 304.3H  46.48% [idle{idle: cpu10}]
   11 root        187 ki31     0B   256K RUN      7 295.3H  44.32% [idle{idle: cpu7}]
   11 root        187 ki31     0B   256K CPU4     4 299.0H  43.75% [idle{idle: cpu4}]
   11 root        187 ki31     0B   256K RUN     14 293.7H  42.83% [idle{idle: cpu14}]
   11 root        187 ki31     0B   256K RUN      2 294.9H  41.53% [idle{idle: cpu2}]
   11 root        187 ki31     0B   256K CPU12   12 294.9H  41.19% [idle{idle: cpu12}]
   11 root        187 ki31     0B   256K RUN      6 296.4H  40.91% [idle{idle: cpu6}]
   11 root        187 ki31     0B   256K RUN     13 290.5H  39.37% [idle{idle: cpu13}]
   11 root        187 ki31     0B   256K CPU3     3 283.4H  38.60% [idle{idle: cpu3}]
   11 root        187 ki31     0B   256K RUN     15 280.2H  35.89% [idle{idle: cpu15}]
   11 root        187 ki31     0B   256K RUN      9 286.2H  34.99% [idle{idle: cpu9}]
   11 root        187 ki31     0B   256K RUN     11 279.3H  34.25% [idle{idle: cpu11}]
   11 root        187 ki31     0B   256K RUN      1 279.1H  32.74% [idle{idle: cpu1}]
   11 root        187 ki31     0B   256K RUN      5 276.3H  31.31% [idle{idle: cpu5}]
Here is what I get from ps -auxwwd | grep updaterrd
root     6115   1.0  0.0  14648   3332  -  SN    6Sep25     38:40.08 |-- /bin/sh /var/db/rrd/updaterrd.sh
root       22   0.0  0.0  14648   3332  -  SN   Wed18        7:42.23 |-- /bin/sh /var/db/rrd/updaterrd.sh
root      306   0.0  0.0  14648   3324  -  IN   10Sep25     25:56.82 |-- /bin/sh /var/db/rrd/updaterrd.sh
root     1786   0.0  0.0  14648   3332  -  IN   Wed19        7:34.60 |-- /bin/sh /var/db/rrd/updaterrd.sh
root     2356   0.0  0.0  14648   3332  -  SN   10Sep25     26:09.77 |-- /bin/sh /var/db/rrd/updaterrd.sh
root     3786   0.0  0.0  14648   3332  -  IN   10Sep25     26:23.12 |-- /bin/sh /var/db/rrd/updaterrd.sh
root     5951   0.0  0.0  14648   3328  -  IN    6Sep25     38:23.48 |-- /bin/sh /var/db/rrd/updaterrd.sh
root    12340   0.0  0.0  14648   3328  -  IN   10Sep25     26:10.11 |-- /bin/sh /var/db/rrd/updaterrd.sh
root    19569   0.0  0.0  14648   3324  -  SN   10Sep25     25:59.66 |-- /bin/sh /var/db/rrd/updaterrd.sh
root    19687   0.0  0.0  14648   3332  -  IN   10Sep25     25:54.78 |-- /bin/sh /var/db/rrd/updaterrd.sh
root    20942   0.0  0.0  14648   3324  -  IN   10Sep25     26:13.54 |-- /bin/sh /var/db/rrd/updaterrd.sh
root    22805   0.0  0.0  14648   3328  -  SN   10Sep25     26:11.92 |-- /bin/sh /var/db/rrd/updaterrd.sh
root    23043   0.0  0.0  14648   3324  -  IN    3Sep25     44:48.32 |-- /bin/sh /var/db/rrd/updaterrd.sh
root    23470   0.0  0.0  14648   3328  -  IN   Wed18        7:35.29 |-- /bin/sh /var/db/rrd/updaterrd.sh
root    23659   0.0  0.0  14648   3328  -  IN   10Sep25     26:11.67 |-- /bin/sh /var/db/rrd/updaterrd.sh
root    23945   0.0  0.0  14648   3328  -  SN   10Sep25     26:06.20 |-- /bin/sh /var/db/rrd/updaterrd.sh
root     8008   0.0  0.0  14648   3312  -  SN   10:24        0:00.00 | `-- /bin/sh /var/db/rrd/updaterrd.sh
root    26022   0.0  0.0  14648   3324  -  SN   10Sep25     25:58.46 |-- /bin/sh /var/db/rrd/updaterrd.sh
root    26042   0.0  0.0  14648   3332  -  IN   10Sep25     26:23.49 |-- /bin/sh /var/db/rrd/updaterrd.sh
root    28632   0.0  0.0  14648   3340  -  IN   Wed19        7:36.19 |-- /bin/sh /var/db/rrd/updaterrd.sh
root    28730   0.0  0.0  14648   3332  -  SN   Wed19        7:48.57 |-- /bin/sh /var/db/rrd/updaterrd.sh
root    29315   0.0  0.0  14648   3328  -  IN   10Sep25     26:02.06 |-- /bin/sh /var/db/rrd/updaterrd.sh
root    29326   0.0  0.0  14648   3340  -  IN   Wed19        7:35.01 |-- /bin/sh /var/db/rrd/updaterrd.sh
root    29945   0.0  0.0  14648   3332  -  IN   10Sep25     26:10.44 |-- /bin/sh /var/db/rrd/updaterrd.sh
root    30177   0.0  0.0  14648   3332  -  IN   Wed19        7:44.25 |-- /bin/sh /var/db/rrd/updaterrd.sh
root    30685   0.0  0.0  14648   3332  -  IN   Wed19        7:42.13 |-- /bin/sh /var/db/rrd/updaterrd.sh
root    31073   0.0  0.0  14648   3328  -  SN   Wed18        7:37.28 |-- /bin/sh /var/db/rrd/updaterrd.sh
root    33594   0.0  0.0  14648   3328  -  IN   10Sep25     26:04.82 |-- /bin/sh /var/db/rrd/updaterrd.sh
root    67790   0.0  0.0  14080   2712  0  S+   10:24        0:00.00 |       `-- grep updaterrd
root    50702   0.0  0.0  14648   3328  -  IN   Wed19        7:40.90 |-- /bin/sh /var/db/rrd/updaterrd.sh
root    55864   0.0  0.0  14648   3336  -  SN   Wed19        7:45.30 |-- /bin/sh /var/db/rrd/updaterrd.sh
root     4979   0.0  0.0  14648   3320  -  SN   10:24        0:00.00 | `-- /bin/sh /var/db/rrd/updaterrd.sh
root    56232   0.0  0.0  14648   3332  -  IN   Wed18        7:43.99 |-- /bin/sh /var/db/rrd/updaterrd.sh
root    63618   0.0  0.0  14648   3328  -  SN   Wed19        7:42.86 |-- /bin/sh /var/db/rrd/updaterrd.sh
root    64770   0.0  0.0  14648   3332  -  IN   Wed19        7:37.65 |-- /bin/sh /var/db/rrd/updaterrd.sh
root    65043   0.0  0.0  14648   3328  -  IN   Wed19        7:42.31 |-- /bin/sh /var/db/rrd/updaterrd.sh
root    69742   0.0  0.0  14648   3336  -  SN   10Sep25     26:08.58 |-- /bin/sh /var/db/rrd/updaterrd.sh
root    69902   0.0  0.0  14648   3344  -  IN   10Sep25     26:09.77 |-- /bin/sh /var/db/rrd/updaterrd.sh
root    73676   0.0  0.0  14648   3336  -  SN   Wed18        7:43.24 |-- /bin/sh /var/db/rrd/updaterrd.sh
root    64192   0.0  0.0  14648   3324  -  SN   10:24        0:00.00 | `-- /bin/sh /var/db/rrd/updaterrd.sh
root    75268   0.0  0.0  14648   3320  -  IN   Wed18        7:32.65 |-- /bin/sh /var/db/rrd/updaterrd.sh
root    75652   0.0  0.0  14648   3332  -  IN   10Sep25     26:16.90 |-- /bin/sh /var/db/rrd/updaterrd.sh
root    76273   0.0  0.0  14648   3324  -  IN   10Sep25     25:59.07 |-- /bin/sh /var/db/rrd/updaterrd.sh
root    76796   0.0  0.0  14648   3328  -  SN   Wed18        7:36.50 |-- /bin/sh /var/db/rrd/updaterrd.sh
root    81361   0.0  0.0  14648   3328  -  SN   10Sep25     25:58.86 |-- /bin/sh /var/db/rrd/updaterrd.sh
root    66931   0.0  0.0  14648   3312  -  SN   10:24        0:00.00 | `-- /bin/sh /var/db/rrd/updaterrd.sh
root    81782   0.0  0.0  14648   3332  -  IN   10Sep25     26:25.67 |-- /bin/sh /var/db/rrd/updaterrd.sh
root    82851   0.0  0.0  14648   3332  -  IN   Wed18        7:45.65 |-- /bin/sh /var/db/rrd/updaterrd.sh
root    82948   0.0  0.0  14648   3328  -  IN   10Sep25     26:10.74 |-- /bin/sh /var/db/rrd/updaterrd.sh
root    83037   0.0  0.0  14648   3332  -  IN   10Sep25     26:07.16 |-- /bin/sh /var/db/rrd/updaterrd.sh
root    83534   0.0  0.0  14648   3332  -  SN   10Sep25     26:07.22 |-- /bin/sh /var/db/rrd/updaterrd.sh
root    83659   0.0  0.0  14648   3332  -  IN   10Sep25     25:48.59 |-- /bin/sh /var/db/rrd/updaterrd.sh
root    85084   0.0  0.0  14648   3336  -  SN   10Sep25     26:04.50 |-- /bin/sh /var/db/rrd/updaterrd.sh
root    90220   0.0  0.0  14648   3328  -  SN   Wed18        7:44.84 |-- /bin/sh /var/db/rrd/updaterrd.sh
root    90451   0.0  0.0  14648   3316  -  IN   Wed18        7:36.11 |-- /bin/sh /var/db/rrd/updaterrd.sh
root    92223   0.0  0.0  14648   3328  -  SN   10Sep25     26:08.71 |-- /bin/sh /var/db/rrd/updaterrd.sh
root    93506   0.0  0.0  14648   3336  -  SN   Wed18        7:35.40 |-- /bin/sh /var/db/rrd/updaterrd.sh
root     3202   0.0  0.0  14648   3324  -  SN   10:24        0:00.01 | `-- /bin/sh /var/db/rrd/updaterrd.sh
root    95534   0.0  0.0  14648   3328  -  IN   Wed18        7:34.67 |-- /bin/sh /var/db/rrd/updaterrd.sh
root    97556   0.0  0.0  14648   3332  -  SN   Wed18        7:46.68 |-- /bin/sh /var/db/rrd/updaterrd.sh
root    98233   0.0  0.0  14648   3332  -  IN   10Sep25     25:45.26 |-- /bin/sh /var/db/rrd/updaterrd.sh
root    98766   0.0  0.0  14648   3324  -  IN   Wed18        7:40.54 |-- /bin/sh /var/db/rrd/updaterrd.sh
root    98810   0.0  0.0  14648   3332  -  IN   10Sep25     25:46.52 |-- /bin/sh /var/db/rrd/updaterrd.sh
root    99299   0.0  0.0  14648   3328  -  SN   10Sep25     25:53.29 |-- /bin/sh /var/db/rrd/updaterrd.sh
root    99316   0.0  0.0  14648   3328  -  IN   10Sep25     26:01.37 |-- /bin/sh /var/db/rrd/updaterrd.sh
root    99505   0.0  0.0  14648   3324  -  SN   10Sep25     26:34.16 |-- /bin/sh /var/db/rrd/updaterrd.sh
root    99552   0.0  0.0  14648   3332  -  IN   10Sep25     26:15.17 |-- /bin/sh /var/db/rrd/updaterrd.sh
Seems like it takes a while to start malfunctioning, I think I've seen this behaviour three times now after a while over uptime. No changes to my config have been made over the past 1.5 months, reboots resolve it then it comes back eventually.
-
I noticed but didnt get time to debug yet an increase in CPU load that was around the time of the last update.
I'll take a look today and see if its similar to your report here.
UPDATE:
[25.07.1-RELEASE][root@pfsense.local.lan]/root: ps -auxwwd | grep updaterrd root 10344 0.0 0.0 14644 3284 - IN 19Aug25 27:40.03 |-- /bin/sh /var/db/rrd/updaterrd.sh root 96162 0.0 0.0 14076 2700 0 S+ 11:31 0:00.00 | `-- grep updaterrd root 36409 0.0 0.0 14644 3284 - SN 19Aug25 27:38.58 |-- /bin/sh /var/db/rrd/updaterrd.sh root 40744 0.0 0.0 14644 3284 - SN Sat11 0:50.56 |-- /bin/sh /var/db/rrd/updaterrd.sh root 43487 0.0 0.0 14644 3296 - IN 19Aug25 27:40.89 |-- /bin/sh /var/db/rrd/updaterrd.sh root 45279 0.0 0.0 14644 3280 - IN 19Aug25 27:21.49 |-- /bin/sh /var/db/rrd/updaterrd.sh root 49592 0.0 0.0 14644 3288 - IN 19Aug25 27:20.34 |-- /bin/sh /var/db/rrd/updaterrd.sh root 52501 0.0 0.0 14644 3276 - IN 19Aug25 27:39.09 |-- /bin/sh /var/db/rrd/updaterrd.sh root 82361 0.0 0.0 14644 3280 - SN 19Aug25 27:21.90 |-- /bin/sh /var/db/rrd/updaterrd.sh root 94685 0.0 0.0 14644 3272 - SN 11:31 0:00.00 | `-- /bin/sh /var/db/rrd/updaterrd.sh root 91882 0.0 0.0 14644 3276 - IN 19Aug25 27:23.96 |-- /bin/sh /var/db/rrd/updaterrd.sh -
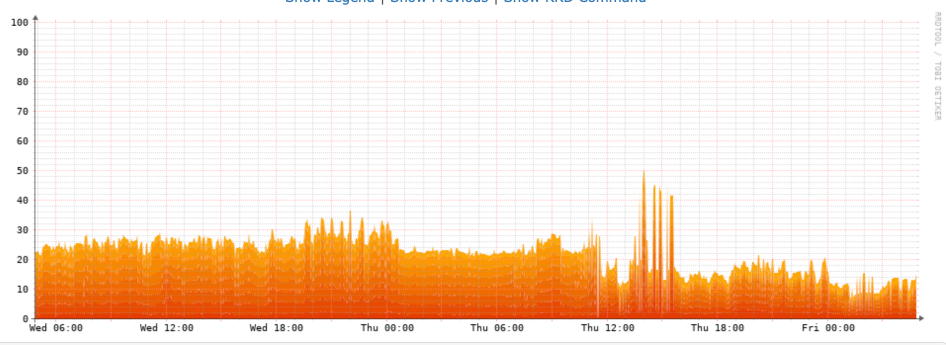
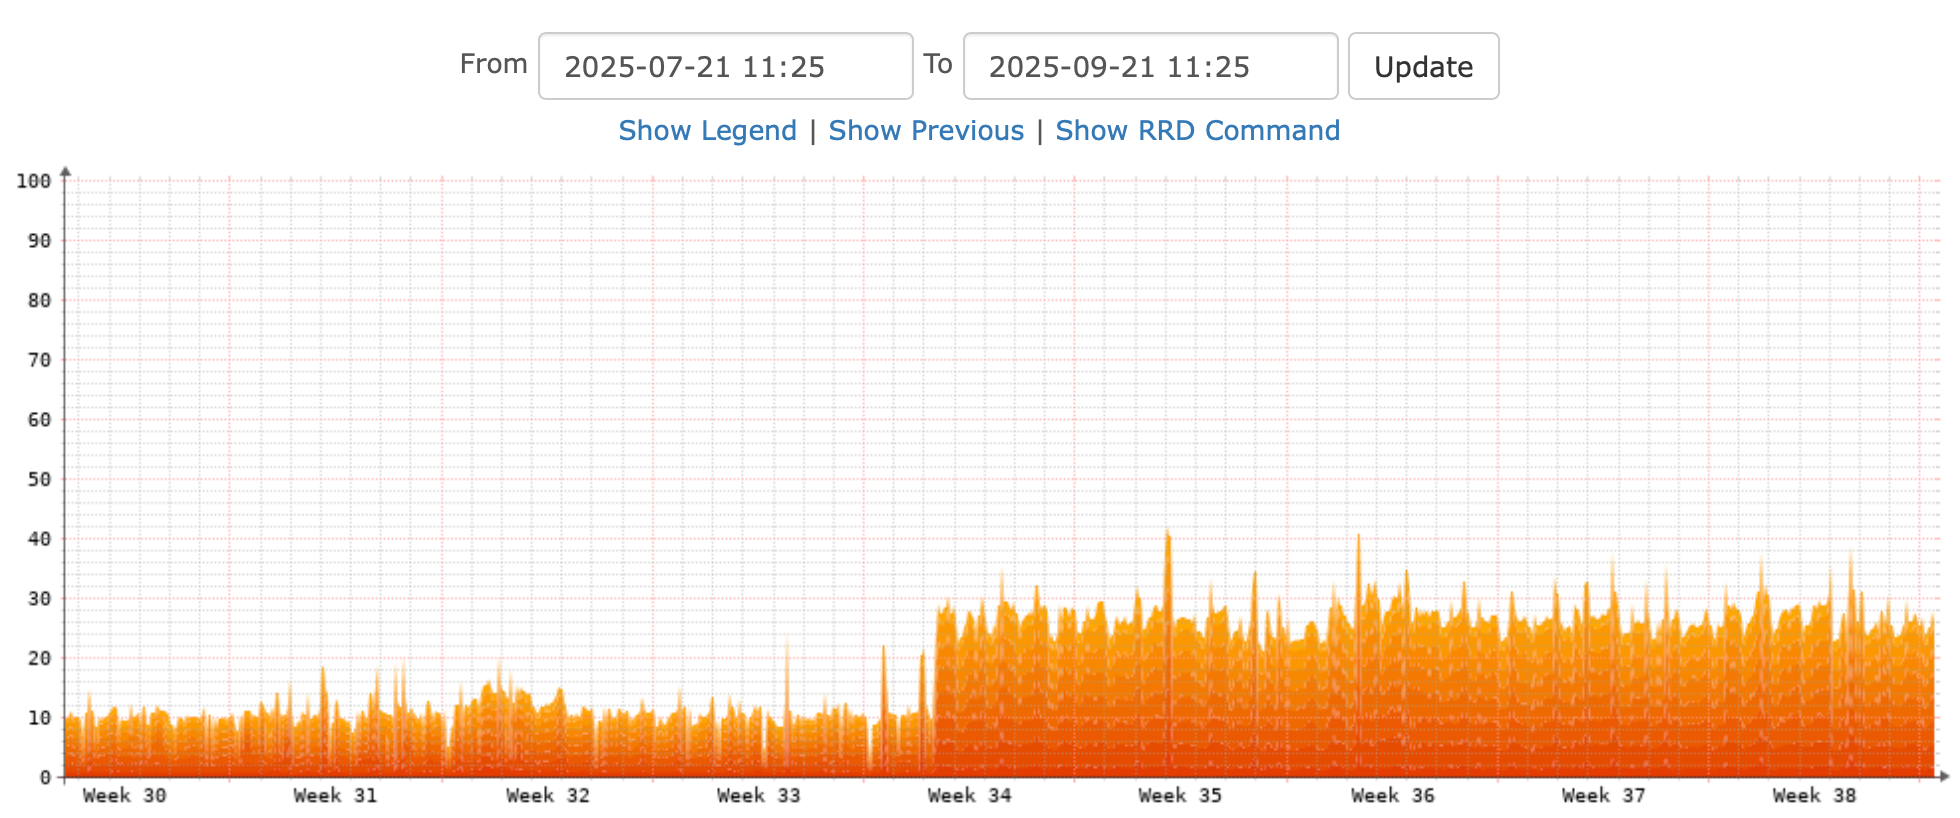
@q54e3w That's great insight to look back at the graphs. This is what I'm seeing.
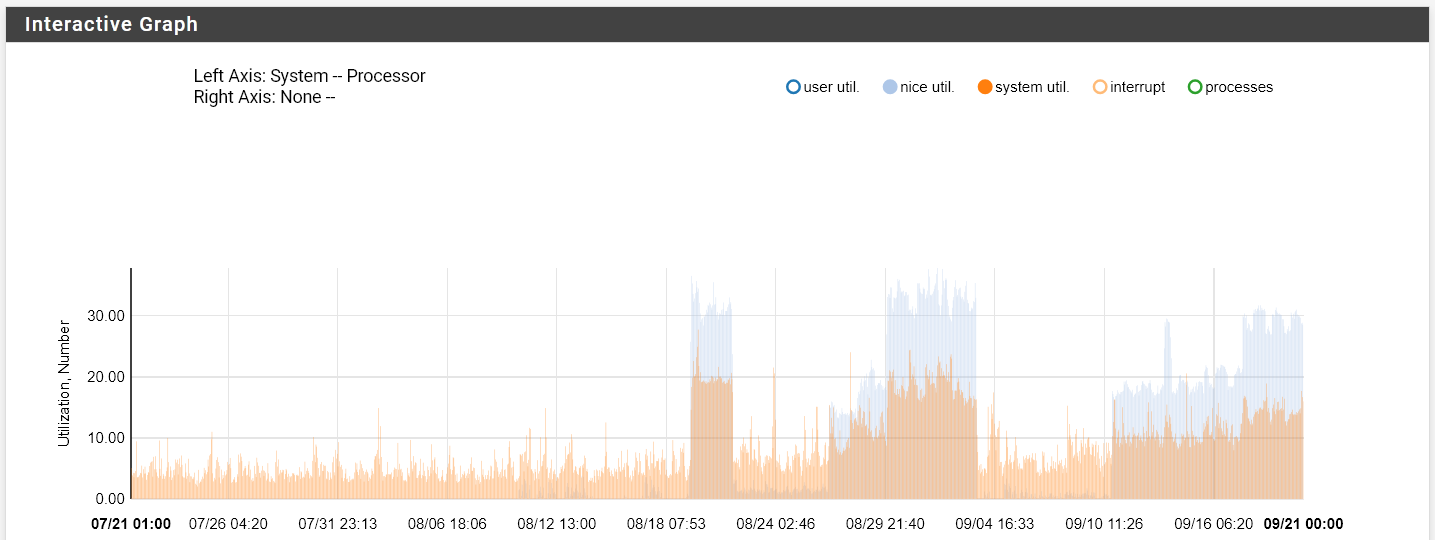
Can essentially see where I reboot for something then randomly it goes high. I think this graphs resolution isn't quite high enough to see the exact amount of CPU utilisation since its so brief that it hits near 100% for a second but cumulatively you can see a trend here of abnormal usage.
Definitely started after I upgraded the version I'm using.
-
Hmm. Good data. Let me see if I can find anything....
-
@stephenw10 I tried removing my dashboard widgets tracking gateway performance but the same number of updaterrd.sh exist a few days later.
I have a similar number of VPN connections to updaterrd.sh files.
Not sure if thats helpful but wanted to share. -
Still nothing logged at the point the RRD process start to rack up?
-
@stephenw10 Found some time to reboot the system so will monitor over the coming days. So far utilisation is back to pre-spiked levels. I disabled RRD graphs associated with NTP statistics that I had enabled too.
This is my current ps aux output
ps -auxwwd | grep updaterrd
root     5801   0.0  0.0  14644   3280  -  IN   11:34      0:36.49 |-- /bin/sh /var/db/rrd/updaterrd.sh
root     5901   0.0  0.0  14644   3288  -  IN   11:34      0:36.20 |-- /bin/sh /var/db/rrd/updaterrd.sh
root    11559   0.0  0.0  14076   2708  0  S+   04:52      0:00.00 |         `-- grep updaterrd
root    47789   0.0  0.0  14644   3292  -  SN   01:18      0:07.50 |-- /bin/sh /var/db/rrd/updaterrd.sh
root    97262   0.0  0.0  14644   3288  -  SN   04:52      0:00.00 | `-- /bin/sh /var/db/rrd/updaterrd.sh
root    53209   0.0  0.0  14644   3288  -  SN   11:34      0:36.96 |-- /bin/sh /var/db/rrd/updaterrd.sh
root    63648   0.0  0.0  14644   3076  -  IN   11:29      0:35.54 |-- /bin/sh /var/db/rrd/updaterrd.sh