Suricata log mgmt settings ineffective
-
I've been meaning to look into this for a while now. On my home router, suricata doesn't appear to be honouring the log size and retention limits set in Services / Suricata / Logs Management.
I figured I'd check on it before intervening in case it ever becomes relevant to our router at work, especially with an 8200 on the way to replace the ancient supermicro DIY job I threw together a while back.
In terms of versions, this is with suricata 7.0.8_1 running on the amd64 flavour of pfsense 2.7.2, but from the contents of the logs this has been going on for a while now. Yes, I know the 2.8 series is available, but the upgrade process regarding packages is cumbersome, and I've been too busy to worry about it for now. It's done at work, but it's still on my to-do list for home.
As far as I can tell, the retention settings have not been touched from the defaults:
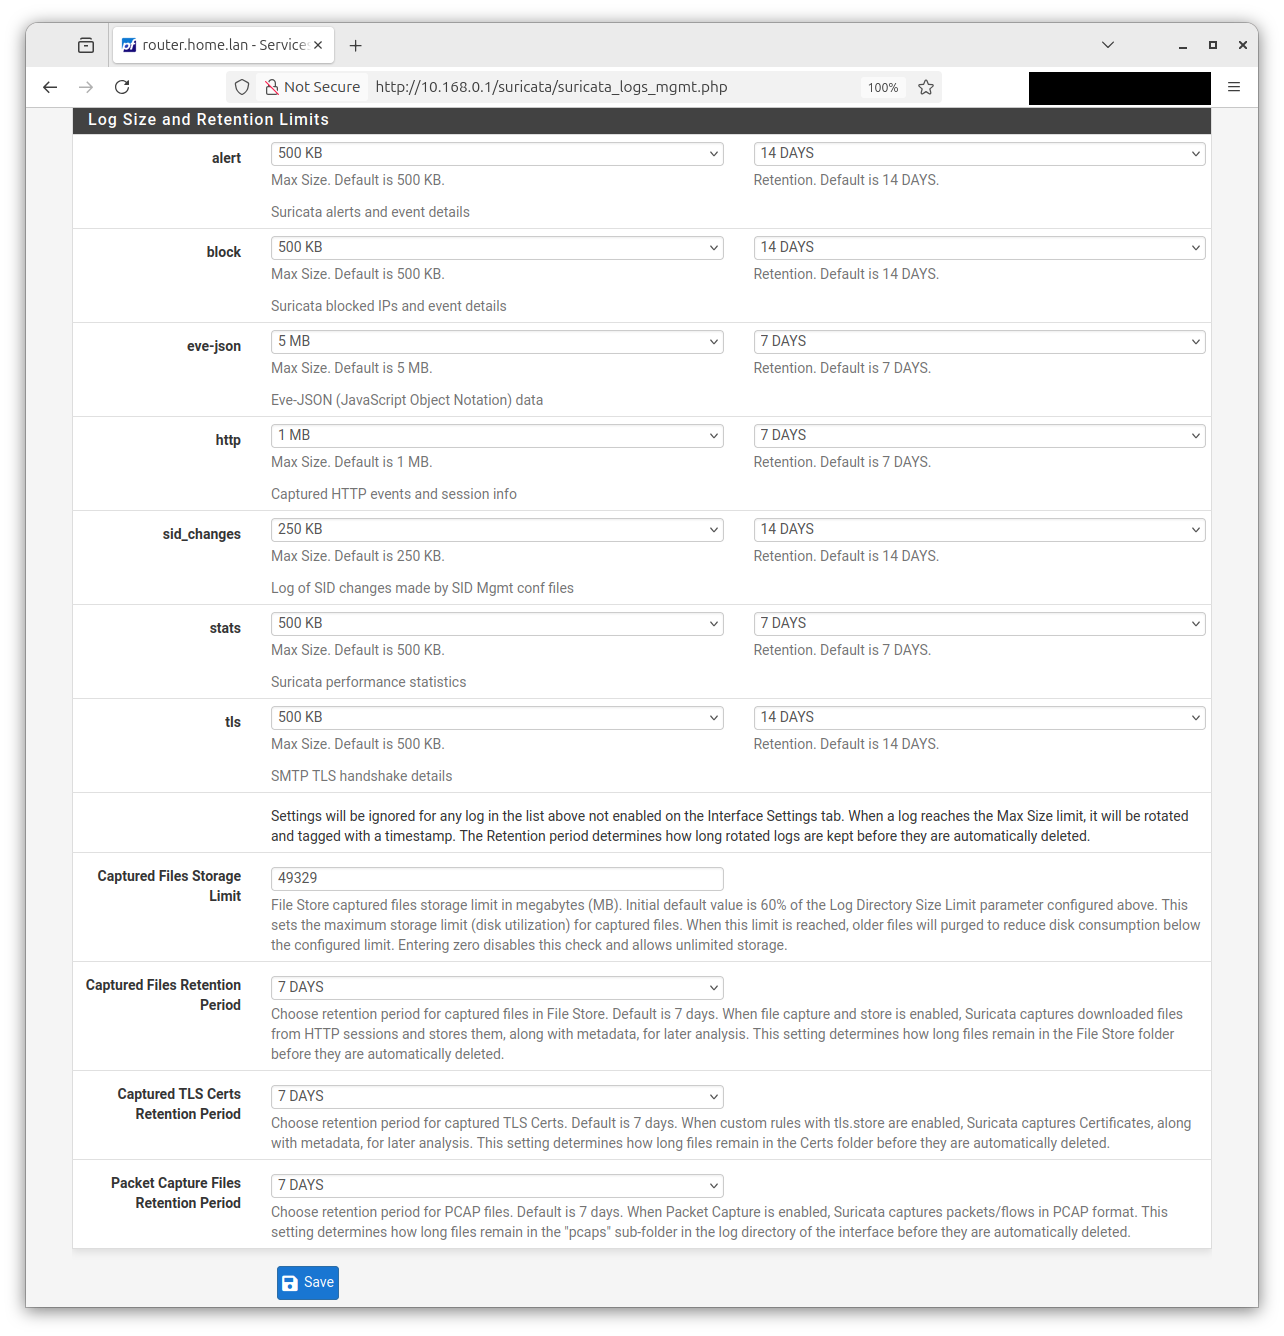
(The
Auto Log Managementcheckbox at the head of the page is definitely checked. TheLog Directory Size Limitbox is not.)However, the logs for my WAN interface have gone a teeny wee bit past those limits:
[2.7.2-RELEASE][root@router.home.lan]/var/log/suricata/suricata_igc16596: ls -alh
total 122691
drwxr-xr-x  2 root wheel    6B Apr 22  2024 .
drwx------  5 root wheel    6B May 31  2024 ..
-rw-r--r--  1 root wheel   26M Sep  5 16:57 alerts.log
-rw-r--r--  1 root wheel  130M Sep  5 16:57 block.log
-rw-r--r--  1 root wheel  553M Sep  5 16:56 http.log
-rw-r--r--  1 root wheel   44K Sep  5 16:45 suricata.log
The contents of both
block.logandhttp.logdate from April 2024 onwards,alerts.logstarts at the end of July of this year, andsuricata.logis 15 minutes old at the time of writing as I restarted the service to see what would happen, which appears to have clobbered the old contents.The contents of
block.logprobably give away the least amount of personally identifiable information; showing the first and last few of the ~720k lines in the log:04/22/2024-11:04:15.079892 [Block Src] [**] [1:2402000:6980] ET DROP Dshield Block Listed Source group 1 [**] [Classification: Misc Attack] [Priority: 2] {TCP} 79.124.60.6:59863 04/22/2024-11:04:16.249589 [Block Src] [**] [1:2400005:3955] ET DROP Spamhaus DROP Listed Traffic Inbound group 6 [**] [Classification: Misc Attack] [Priority: 2] {TCP} 62.122.184.75:43033 04/22/2024-11:04:22.972196 [Block Src] [**] [1:2400005:3955] ET DROP Spamhaus DROP Listed Traffic Inbound group 6 [**] [Classification: Misc Attack] [Priority: 2] {TCP} 62.122.184.82:40186 04/22/2024-11:04:37.554847 [Block Src] [**] [1:2402000:6980] ET DROP Dshield Block Listed Source group 1 [**] [Classification: Misc Attack] [Priority: 2] {TCP} 79.124.59.202:59720 04/22/2024-11:04:38.580444 [Block Src] [**] [1:2402000:6980] ET DROP Dshield Block Listed Source group 1 [**] [Classification: Misc Attack] [Priority: 2] {TCP} 79.124.40.70:59700 ... 09/05/2025-16:59:45.034689 [Block Src] [**] [1:2403306:102913] ET CINS Active Threat Intelligence Poor Reputation IP group 7 [**] [Classification: Misc Attack] [Priority: 2] {TCP} 8.216.65.225:59453 09/05/2025-17:00:16.694614 [Block Src] [**] [1:2403340:102913] ET CINS Active Threat Intelligence Poor Reputation IP group 41 [**] [Classification: Misc Attack] [Priority: 2] {TCP} 35.203.210.129:52196 09/05/2025-17:00:23.916317 [Block Src] [**] [1:2402000:7484] ET DROP Dshield Block Listed Source group 1 [**] [Classification: Misc Attack] [Priority: 2] {TCP} 195.184.76.25:8244 09/05/2025-17:00:32.717653 [Block Src] [**] [1:2402000:7484] ET DROP Dshield Block Listed Source group 1 [**] [Classification: Misc Attack] [Priority: 2] {TCP} 205.210.31.221:50697 09/05/2025-17:01:01.685207 [Block Src] [**] [1:2402000:7484] ET DROP Dshield Block Listed Source group 1 [**] [Classification: Misc Attack] [Priority: 2] {TCP} 65.49.1.132:44299The volume is almost comically oversized for its needs, so I'm in no danger of running out of disk space any time soon. However, what really hurts is entering the blocks page in the web UI; the resulting page is huge.
A lot of the current blocks are from repeat offenders from the poor reputation lists, and each of those is shown with every timestamp from the log that date back a year and a bit, sometimes with hundreds of lines per IP. For example,
35.203.210.254is currently blocked by reputation and has 188 date/time entries.I should mention that I'm somewhat uninterested in long-term log retention (hence why the defaults were left in place), but I'm interested in seeing the difference between what I see at home vs. work, and I also want to have some small retention period to see what sort of stuff the kids have been up to in general terms (I've have the P2P rules in place, for example). I don't really want to turn the logs off completely.
The most recent post I can find that's similar is this. That's from 2020 and mentions pfsense 2.5 and suricata 5.0.3, so I'm assuming it's too dated to be relevant.
I'm leaving things in place for now in case there are requests for more information.
-
@Smeg.Head Have you tried saving the log settings page as is? Years ago IIRC there was a bug there also where it needed saving.
If pfSense is set to compress logs (should not on ZFS or slow CPUs) I wonder if it might be trying and timing out.
-
@SteveITS No, I haven't, but I'll do that now. It never occurred to me that if it was already showing a bunch of limits, it might still need the save button pushed.
If it doesn't compress logs on ZFS, then it won't be trying in this case. The compression ratio for
pfSense/var/logis showing a pretty healthy 14.46x at the moment. -
...and lo and behold, we have rotation:
[2.7.2-RELEASE][root@router.home.lan]/var/log/suricata/suricata_igc16596: ls -alh
total 123753
drwxr-xr-x  2 root wheel    9B Sep  8 16:50 .
drwx------  5 root wheel    6B May 31  2024 ..
-rw-r--r--  1 root wheel  1.5K Sep  8 16:52 alerts.log
-rw-r--r--  1 root wheel   28M Sep  8 16:49 alerts.log.2025_0908_1650
-rw-r--r--  1 root wheel  744B Sep  8 16:52 block.log
-rw-r--r--  1 root wheel  131M Sep  8 16:49 block.log.2025_0908_1650
-rw-r--r--  1 root wheel  184B Sep  8 16:52 http.log
-rw-r--r--  1 root wheel  555M Sep  8 16:47 http.log.2025_0908_1650
-rw-r--r--  1 root wheel   86K Sep  7 09:21 suricata.log
It'll presumably take a little while for the old logs to be pruned, but that's already more activity than it's shown in over a year.
It's also immediately calmed down the contents of the blocks page. A couple of IPs have been sin binned since the rotation occurred, one of which had over 1700 entries in the old log.
I'll have to go look at the instance in the lab at work to see if it also wants the same treatment. There we're downstream of a larger institutional firewall and IDS so there's a lot less noise, but it's proven to be nowhere near 100% effective and still lets some stuff through, so we decided to run suricata there, too.
Is it safe to assume that the proper next step would be to go fill out a bug report on the redmine site, as per the docs?
-
@Smeg.Head I'd think the main question would be whether it's a one-off or reproducible. Obviously that situation isn't correct but it's a question of why, and I haven't seen any other recent posts about it.
Was the install done on 2.7.2 or is it older? I don't recall offhand when the bug was, but I'd guess 5-8 years ago.
-
I have struggled with the log sizes getting too big and then the web pages refusing to list things on them (alerts/blocks pages show empty in UI).
Clearing the logs manually instantly fixes the UI issue.
I think the problem is the fact that logs can grow quite quickly and that relying on the log rotation can lead to a (very minimal) denial of service type event.
I've thought about mucking with how often it rotates but as long as I'm not being legit DDOS'd it is just a nuisance. Suricata still clearly works. The firewall itself clearly works. The only real problem is UI issues when attempting to do a real investigation or troubleshoot. One can work around that manually.
Of course somebody will simply say turn suricata off on the external interface. No. Occasionally good research happens there.