CE 2.8.1 bsnmpd Memory Leak
-
Here a bsnmpd process after ~18 hours uptime on 2.8.1
ps aux | grep bsnmpd
root     9909   0.0 16.9 2990476 1412004  -  Ss   03:00       5:13.17 /usr/sbin/bsnmpd -c /var/etc/snmpd.conf -p /var/run/snmpd.pid
On a 2.7.2 maschine the process barley reaches 400MB after a week of uptime
ps aux | grep bsnmpd
root    73322   20.2  1.0  379016  340036  -  Rs   21Sep25   1129:39.85 /usr/sbin/bsnmpd -c /var/etc/snmpd.conf -p /var/run/snmpd.pid
The configuration is identical on both firewalls, except the redacted <variables>
location := "<location>" contact := "" read := "<ro-community>" system := 1 # pfSense %snmpd sysDescr = "pfSense <hostname> 2.8.1-RELEASE FreeBSD 15.0-CURRENT amd64" begemotSnmpdDebugDumpPdus = 2 begemotSnmpdDebugSyslogPri = 7 begemotSnmpdCommunityString.0.1 = $(read) begemotSnmpdCommunityDisable = 1 begemotSnmpdPortStatus.<ip-1>.161 = 1 begemotSnmpdPortStatus.<ip-2>.161 = 1 begemotSnmpdLocalPortStatus."/var/run/snmpd.sock" = 1 begemotSnmpdLocalPortType."/var/run/snmpd.sock" = 4 # These are bsnmp macros not php vars. sysContact = $(contact) sysLocation = $(location) sysObjectId = 1.3.6.1.4.1.12325.1.1.2.1.$(system) snmpEnableAuthenTraps = 2 begemotSnmpdModulePath."mibII" = "/usr/lib/snmp_mibII.so" begemotSnmpdModulePath."netgraph" = "/usr/lib/snmp_netgraph.so" %netgraph begemotNgControlNodeName = "snmpd" begemotSnmpdModulePath."pf" = "/usr/lib/snmp_pf.so" begemotSnmpdModulePath."hostres" = "/usr/lib/snmp_hostres.so" begemotSnmpdModulePath."ucd" = "/usr/local/lib/snmp_ucd.so" begemotSnmpdModulePath."regex" = "/usr/local/lib/snmp_regex.so" -
Hmm, I haven't seen that. But I'm also not querying that fast or all the rules like that.
In 2.7.2 I assume the total memory use doesn't continue to climb?
And in 2.8.1 it eventually exhausts the available RAM and causes services to fail?
-
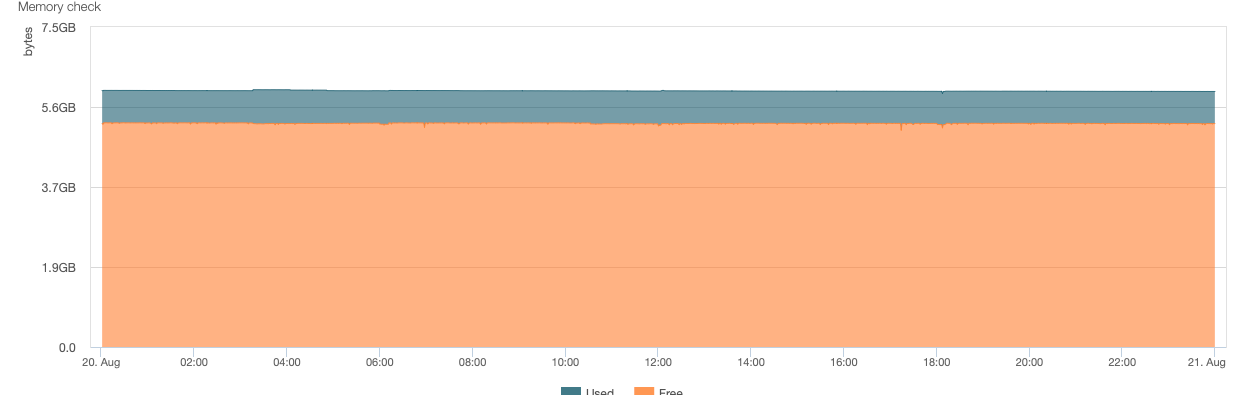
The firewall or services doesn't fail completely, but start to acting unusual due to the memory exhaustion. A few times FFR got stuck and needed to be restarted. With 2.7.2 and all previous releases down to 2.4, the memory usage of the process stayed constant at a level less than 500MB.
This is the memory usage in 2.7.2:
This in is the same firewall in 2.8.1
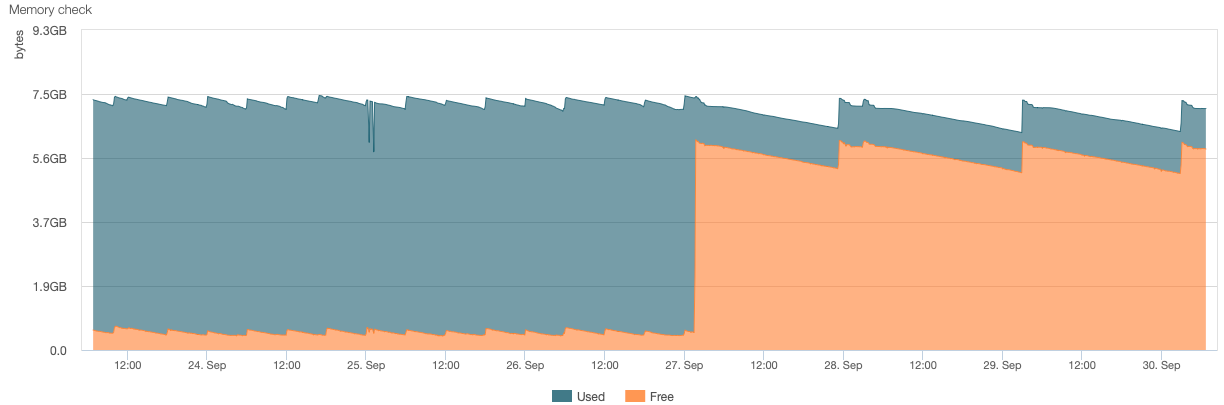
On 27th of September, I noticed the issue and configured a cron to restart the server every 24h.
The next chart shows the swap usage (orange). When hitting the 100% the problems start.
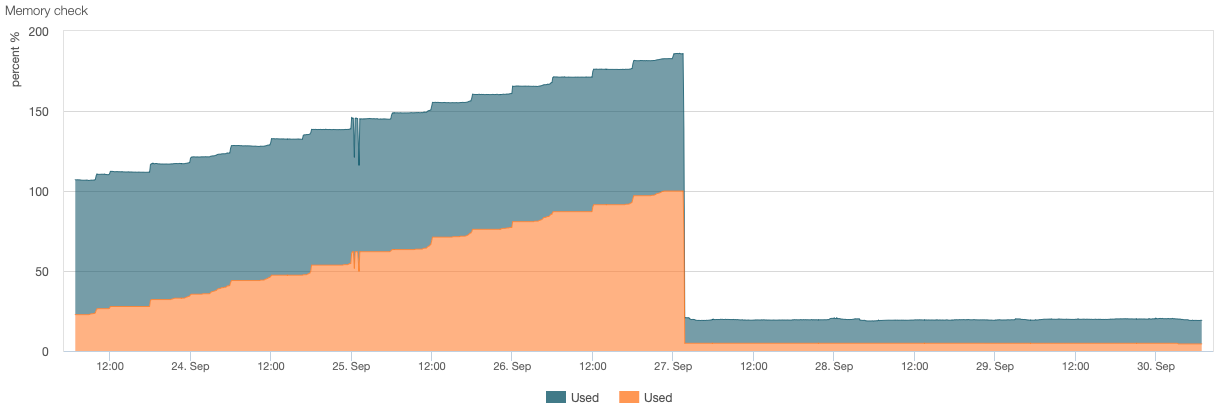
-
Hmm, OK well that seems pretty conclusive. Let me see if I can replicate it....
-
Did you open a bug report for this yet? (not seeing one)
-
Not yet, as I wrote - I want to check first, if someone else is running into this, too. I'll take care of this, as soon as I figure out my credentials for redmine. Haven't been there for a while.
-
Mmm, yeah we haven't managed to replicate it here yet. Still trying some variations....
-
Redmine created: https://redmine.pfsense.org/issues/16456
I've check the complete SNMP monitoring of the affected devices and identified these OIDs of MIBs in use for pooling on a 60 seconds base:
- 1.3.6.1.4.1.2021.4
- 1.3.6.1.4.1.2021.11
- 1.3.6.1.2.1.25.3.3.1
- 1.3.6.1.2.1.25.4.2.1
- 1.3.6.1.2.1.2.2.1
-
@stephenw10 said in CE 2.8.1 bsnmpd Memory Leak:
Let me see if I can replicate it....
Hi @stephenw10, do you had the chance to replicate this behavior?
-
Nope not yet. We did find and fix a different memory leak. Devs are still reviewing.
-
Just to add one vote to confirm memory leak. Using with zabbix standard template reading values, every week needs to restart snmpd service due to swap space full.
As a temporary workaround, added daily in cron: pfSsh.php playback svc restart bsnmpd -
@psp As Steve said, I've been unable to reproduce this.
It'd be helpful if you could narrow down the OID to (repeatedly) query to reproduce the leak.
-
-
@Averlon No telegraf here. Standard Zabbix "pfSense by SNMP" template uses BEGEMOT-PF-MIB and HOST-RESOURCES-MIB to walk interfaces and get OID values.
-
@kprovost BEGEMOT-PF-MIB and HOST-RESOURCES-MIB it is.
-
@Averlon I still can't reproduce this leak. That's why I asked if you could identify the specific OID that's causing the leak. That way I could inspect the code and recent related changes to see if I could identify the leak.
Naturally I cannot do that for the entire trees under those two nodes. -
@kprovost I can nail down the BEGEMOT-PF-MIB to these OIDs for regular walks
- 1.3.6.1.4.1.12325.1.200.1.1
- 1.3.6.1.4.1.12325.1.200.1.11
- 1.3.6.1.4.1.12325.1.200.1.2
- 1.3.6.1.4.1.12325.1.200.1.3
- 1.3.6.1.4.1.12325.1.200.1.5
- 1.3.6.1.4.1.12325.1.200.1.8
For HOST-RESOURCES-MIB to these OIDs
- 1.3.6.1.2.1.25.3.3.1
- 1.3.6.1.2.1.25.4.2.1
After 24h the bsnmp process is at approx. 500MB if the monitoring is querying the device on a 60 second base. Not sure why this doesn't occur when you try to reproduce it. It may require a certain count of firewall rules to trigger the condition which causing the leak. The firewalls I observed this, have ~ 400 to 600 rules.
-
@Averlon Do each of those leak individually or do you need to query all of those to provoke the leak?
You've listed most of the BEGEMOT-PF-MIB mib here.
My test setup has the standard CE ruleset, which is already has 100 rules in it, and there's no point at which the relevant code does different things for more rules.
All of the nodes you mentioned are populated in my test setup, and I've been polling as quickly as the test device would respond, not every 60 seconds. I'd expect that to result in an even faster leak that you described, but there's nothing.
-
@kprovost I'm at the point where I doubt the leak can be triggered by simply running queries on specific MIBs. Monitoring with SNMP is still very common and this topic hasn't got much attention, what let assume that not every configuration is affected by this. In addition your tests shown that the conditions to reproduce this issue, isn't straight forward as running snmpwalks as fast as possible.
I have three different pfSense installations which are affected by leaks of the bsnmp process. All of these have this in common:
- These are VMs
- SNMP v2 is in use (YES - Security Not My Problem)

- Bridge Interfaces for transparent filtering are in used (physical interfaces only, no bridge interface)
- IPSec with VTI Interfaces are used
- The SNMP monitoring runs queries via the VTI IFs to the LAN IP, these may flap.
- BGP from FFR Package is running and peering via VTIs
- There is a pretty high load of dropped / logged IP communication from the firewall
- The Table sizes are pretty large due pfBlockerNG rules
I'm currently on a business trip and cannot do further tests in my environment.I may find some time next weekend to do more investigation.
Meanwhile maybe @psp can share some details about his environment to find the common ground for this issue.
-
Just got home today and my wife told me about the plans for the weekend. Unfortunately it doesn't include troubleshooting sessions for this issue. I'll have to postpone contributions till next week - sorry.