High Memory Usage
-
States - 2428/47000
Aliases - none
Firewall Rules - 13 WAN (typical port forwards), 1 LAN (any/any), 1 PPTP (any/any), 2 OPENVPN (rules for 2 seperate servers, both any/any)Squid taking up memory? Possible, but I installed it just to look at the system config, so I could help out someone else. It's not even configured. Still on default port 3128, non transparent and no one is configured to use it.
-
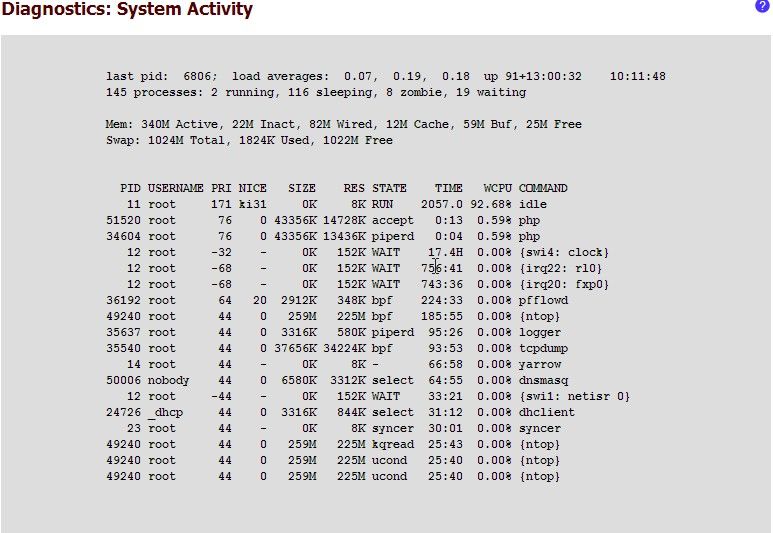
When you go to "Diagnostics -> System Activity" then you can see the memory used by what process.
Or you go to console and type "top" -
"ps uxawww" output and/or "top -SH" output for a bit should help track that down.
We have seen some systems, thought we can't reliably reproduce it, consume a lot of memory in the tcpdump process that produces the pf/firewall log output.
Sometimes you can just kill tcpdump and then then go to System > General and press Save to restart it. -
I am now at 88% memory used.
Here's the system activity:
I did "ps uxawww". The only things that seem to stand out are:
root 49240 0.0 46.0 265380 230892 ?? Ss 12Oct12 282:16.45 /usr/local/bin/ntop -i fxp0 -u root -d -4 -M -x 8102 -X 8192
root 35540 0.0 6.8 37656 34232 v0- S 10Aug12 93:53.54 /usr/sbin/tcpdump -s 256 -v -l -n -e -ttt -i pflog0The above two processes are holding 52.8% of my memory.
Full details below.
USER PID %CPU %MEM VSZ RSS TT STAT STARTED TIME COMMAND
root 11 86.8 0.0 0 8 ?? RL 10Aug12 123427:27.69 [idle]
root 12844 0.7 2.5 43356 12604 ?? R 10:17AM 0:00.45 /usr/local/bin/php
nobody 50006 0.2 0.7 6580 3312 ?? S 20Oct12 64:57.39 /usr/local/sbin/dnsmasq –local-ttl 1 --all-servers --rebind-localhost-ok --stop-dns-rebind --dns-forward-max=5000 --cache-size=10000
root 34604 0.1 2.7 43356 13436 ?? S 10:00AM 0:06.45 /usr/local/bin/php
root 0 0.0 0.0 0 48 ?? DLs 10Aug12 0:20.64 [kernel]
root 1 0.0 0.1 1888 264 ?? ILs 10Aug12 0:00.35 /sbin/init –
root 2 0.0 0.0 0 8 ?? DL 10Aug12 5:10.79 [g_event]
root 3 0.0 0.0 0 8 ?? DL 10Aug12 10:04.83 [g_up]
root 4 0.0 0.0 0 8 ?? DL 10Aug12 8:21.18 [g_down]
root 5 0.0 0.0 0 8 ?? DL 10Aug12 0:00.00 [crypto]
root 6 0.0 0.0 0 8 ?? DL 10Aug12 0:00.00 [crypto returns]
root 7 0.0 0.0 0 8 ?? DL 10Aug12 0:38.70 [fdc0]
root 8 0.0 0.0 0 8 ?? DL 10Aug12 0:00.00 [sctp_iterator]
root 9 0.0 0.0 0 8 ?? DL 10Aug12 11:52.75 [pfpurge]
root 10 0.0 0.0 0 8 ?? DL 10Aug12 0:00.00 [audit]
root 12 0.0 0.0 0 152 ?? WL 10Aug12 2603:05.36 [intr]
root 13 0.0 0.0 0 8 ?? DL 10Aug12 5:54.70 [ng_queue]
root 14 0.0 0.0 0 8 ?? DL 10Aug12 66:57.93 [yarrow]
root 15 0.0 0.0 0 128 ?? DL 10Aug12 2:06.44 [usb]
root 16 0.0 0.0 0 8 ?? DL 10Aug12 0:00.00 [xpt_thrd]
root 17 0.0 0.0 0 8 ?? DL 10Aug12 0:07.91 [pagedaemon]
root 18 0.0 0.0 0 8 ?? DL 10Aug12 0:00.00 [vmdaemon]
root 19 0.0 0.0 0 8 ?? DL 10Aug12 0:00.10 [pagezero]
root 20 0.0 0.0 0 8 ?? DL 10Aug12 0:09.13 [idlepoll]
root 21 0.0 0.0 0 8 ?? DL 10Aug12 0:26.02 [bufdaemon]
root 22 0.0 0.0 0 8 ?? DL 10Aug12 0:26.59 [vnlru]
root 23 0.0 0.0 0 8 ?? DL 10Aug12 30:01.42 [syncer]
root 24 0.0 0.0 0 8 ?? DL 10Aug12 0:38.25 [softdepflush]
root 40 0.0 0.0 0 8 ?? DL 10Aug12 0:06.62 [md0]
root 258 0.0 0.1 3408 716 ?? INs 10Aug12 0:00.09 /usr/local/sbin/check_reload_status
root 260 0.0 0.1 3408 476 ?? IN 10Aug12 0:00.00 check_reload_status: Monitoring daemon of check_reload_status
root 273 0.0 0.1 1888 392 ?? Is 10Aug12 0:00.04 /sbin/devd
_ntp 3006 0.0 0.2 3316 796 ?? IN 19Sep12 0:10.62 ntpd: ntp engine (ntpd)
root 3137 0.0 0.2 3316 756 ?? SNs 19Sep12 0:04.14 ntpd: [priv] (ntpd)
root 3610 0.0 0.0 0 0 ?? ZN 5:44AM 0:00.54 <defunct>root 3718 0.0 0.0 0 0 ?? ZN 5:44AM 0:00.54 <defunct>root 4399 0.0 0.1 1564 508 ?? IN 10:17AM 0:00.00 sleep 60
root 6593 0.0 0.9 7612 4364 ?? S 10Aug12 13:51.91 /usr/local/sbin/lighttpd -f /var/etc/lighty-webConfigurator.conf
root 6981 0.0 1.4 42332 6924 ?? Is 10Aug12 0:00.35 /usr/local/bin/php
root 7479 0.0 1.4 42332 6940 ?? Is 10Aug12 0:01.02 /usr/local/bin/php
root 10101 0.0 0.4 5272 2068 ?? Is 10Aug12 0:00.01 /usr/sbin/sshd
root 11499 0.0 0.0 0 0 ?? ZN 10:09AM 0:00.21 <defunct>root 11684 0.0 0.0 0 0 ?? ZN 10:09AM 0:00.21 <defunct>root 15285 0.0 0.2 3532 848 ?? Is 5Oct12 0:00.04 /usr/local/sbin/sshlockout_pf 15
root 17093 0.0 2.4 43356 11972 ?? S 9:56AM 0:02.91 /usr/local/bin/php
root 18995 0.0 0.2 2020 1160 ?? R 10:18AM 0:00.00 /sbin/ifconfig -l (sh)
root 20059 0.0 0.2 3316 780 ?? Ss 6Sep12 0:09.34 dhclient: re0 [priv] (dhclient)
root 20758 0.0 0.6 7992 3144 ?? Ss 10:18AM 0:00.08 sshd: admin@pts/0 (sshd)
root 23669 0.0 0.7 6140 3480 ?? SNs 19Sep12 16:49.60 /usr/local/sbin/openvpn –config /var/etc/openvpn/server1.conf
_dhcp 24726 0.0 0.2 3316 844 ?? Ss 6Sep12 31:12.11 dhclient: re0 (dhclient)
root 25043 0.0 0.0 0 0 ?? ZN 10:09AM 0:00.61 <defunct>root 25385 0.0 0.0 0 0 ?? ZN 10:09AM 0:00.61 <defunct>root 27567 0.0 2.7 43356 13784 ?? S 9:33AM 0:06.12 /usr/local/bin/php
dhcpd 29129 0.0 1.2 8436 6020 ?? Ss Sun11PM 0:40.93 /usr/local/sbin/dhcpd -user dhcpd -group _dhcp -chroot /var/dhcpd -cf /etc/dhcpd.conf fxp0
root 29522 0.0 0.6 5116 3044 ?? SNs 19Sep12 2:33.23 /usr/local/sbin/openvpn --config /var/etc/openvpn/server3.conf
root 30127 0.0 0.4 4948 1984 ?? Ss Mon10AM 3:48.60 /usr/sbin/syslogd -c -c -l /var/dhcpd/var/run/log -f /var/etc/syslog.conf
root 30586 0.0 0.8 9816 3900 ?? SN 19Sep12 5:44.01 /usr/local/bandwidthd/bandwidthd /usr/local/bandwidthd/etc/bandwidthd.conf
root 30594 0.0 0.2 3316 920 ?? INs 21Sep12 0:00.33 dhclient: rl0 [priv] (dhclient)
root 30694 0.0 0.9 9816 4324 ?? SN 19Sep12 5:36.48 /usr/local/bandwidthd/bandwidthd /usr/local/bandwidthd/etc/bandwidthd.conf
root 30787 0.0 0.8 9816 4144 ?? SN 19Sep12 5:27.94 /usr/local/bandwidthd/bandwidthd /usr/local/bandwidthd/etc/bandwidthd.conf
root 30941 0.0 0.6 8792 2792 ?? SN 19Sep12 5:29.98 /usr/local/bandwidthd/bandwidthd /usr/local/bandwidthd/etc/bandwidthd.conf
root 32578 0.0 0.7 7992 3272 ?? Is 10Aug12 0:17.17 /usr/local/sbin/mpd4 -b -d /var/etc/pptp-vpn -p /var/run/pptp-vpn.pid -s pptps pptps
root 32637 0.0 0.8 9816 3904 ?? SN 19Sep12 5:43.75 /usr/local/bandwidthd/bandwidthd /usr/local/bandwidthd/etc/bandwidthd.conf
root 32948 0.0 0.9 9816 4324 ?? SN 19Sep12 5:35.66 /usr/local/bandwidthd/bandwidthd /usr/local/bandwidthd/etc/bandwidthd.conf
root 33057 0.0 0.8 9816 4144 ?? SN 19Sep12 5:33.44 /usr/local/bandwidthd/bandwidthd /usr/local/bandwidthd/etc/bandwidthd.conf
root 33306 0.0 0.2 3532 1124 ?? Is 2:30PM 0:00.01 /usr/local/sbin/sshlockout_pf 15
root 33396 0.0 0.6 8792 2792 ?? SN 19Sep12 5:32.16 /usr/local/bandwidthd/bandwidthd /usr/local/bandwidthd/etc/bandwidthd.conf
_dhcp 36154 0.0 0.2 3316 1028 ?? SNs 21Sep12 20:19.38 dhclient: rl0 (dhclient)
root 36192 0.0 0.1 2912 348 ?? SNs 19Sep12 224:33.01 /usr/local/sbin/pfflowd -n 192.168.50.129:9996 -s 192.168.50.1 -S any -v 9
root 37248 0.0 0.1 3532 604 ?? Is 6Sep12 0:00.07 /usr/local/sbin/sshlockout_pf 15
root 44632 0.0 0.2 3436 1068 ?? Is 10Aug12 0:00.05 /usr/sbin/inetd -wW -R 0 -a 127.0.0.1 /var/etc/inetd.conf
root 44924 0.0 0.1 3316 524 ?? Is 10Aug12 0:07.26 /usr/local/bin/minicron 240 /var/run/ping_hosts.pid /usr/local/bin/ping_hosts.sh
root 45449 0.0 0.1 3316 588 ?? Is 10Aug12 0:00.52 /usr/local/bin/minicron 3600 /var/run/expire_accounts.pid /etc/rc.expireaccounts
root 46078 0.0 0.1 3316 588 ?? Is 10Aug12 0:00.02 /usr/local/bin/minicron 86400 /var/run/update_alias_url_data.pid /etc/rc.update_alias_url_data
root 49003 0.0 0.1 1564 508 ?? S 10:18AM 0:00.00 sleep 55
root 49240 0.0 46.0 265380 230892 ?? Ss 12Oct12 282:16.45 /usr/local/bin/ntop -i fxp0 -u root -d -4 -M -x 8102 -X 8192
root 51258 0.0 1.2 8232 6008 ?? Ss 20Oct12 7:15.84 /usr/sbin/bsnmpd -c /var/etc/snmpd.conf -p /var/run/snmpd.pid
root 52722 0.0 0.1 3532 604 ?? Is 10Aug12 0:00.09 /usr/local/sbin/sshlockout_pf 15
root 56044 0.0 0.1 3316 752 ?? Ss 20Oct12 9:18.73 /usr/local/sbin/apinger -c /var/etc/apinger.conf
root 56442 0.0 0.2 4564 1200 ?? S 20Oct12 0:11.71 /usr/local/bin/rrdtool -
root 57848 0.0 0.2 3656 948 ?? IN 20Oct12 9:15.64 /bin/sh /var/db/rrd/updaterrd.sh
root 59604 0.0 0.2 3352 1064 ?? Ss 10Aug12 12:30.05 /usr/local/sbin/miniupnpd -f /var/etc/miniupnpd.conf -P /var/run/miniupnpd.pid
root 59620 0.0 0.2 3404 792 ?? Is 10Aug12 0:11.60 /usr/sbin/cron -s
root 61420 0.0 0.2 3656 856 ?? S 12Oct12 0:43.24 /bin/sh /usr/local/etc/rc.d/proxy_monitor.sh
root 62036 0.0 0.0 0 0 ?? ZN 10:16AM 0:00.17 <defunct>root 62062 0.0 0.0 0 0 ?? ZN 10:16AM 0:00.17 <defunct>root 62114 0.0 0.5 7296 2596 ?? Is 12Oct12 0:00.00 /usr/local/sbin/squid -D
proxy 62289 0.0 1.2 11392 5792 ?? S 12Oct12 2:37.61 (squid) -D (squid)
proxy 62343 0.0 0.1 1564 368 ?? I 12Oct12 0:00.00 (unlinkd) (unlinkd)
root 35540 0.0 6.8 37656 34232 v0- S 10Aug12 93:53.54 /usr/sbin/tcpdump -s 256 -v -l -n -e -ttt -i pflog0
root 35637 0.0 0.1 3316 580 v0- S 10Aug12 95:25.78 logger -t pf -p local0.info
root 52563 0.0 0.2 3684 772 v0 Is 10Aug12 0:00.01 login [pam] (login)
root 52908 0.0 0.1 3656 656 v0 I 10Aug12 0:00.00 -sh (sh)
root 54621 0.0 0.1 3656 656 v0 I+ 10Aug12 0:00.00 /bin/sh /etc/rc.initial
root 19090 0.0 0.2 3456 1148 0 R+ 10:18AM 0:00.00 ps uxawww
root 26068 0.0 0.3 3656 1288 0 Is 10:18AM 0:00.01 /bin/sh /etc/rc.initial
root 43623 0.0 0.5 4696 2408 0 S 10:18AM 0:00.02 /bin/tcsh</defunct></defunct></defunct></defunct></defunct></defunct></defunct></defunct> -
82% memory used is not necessarily a bad thing. For example, when a program terminates its text segment MIGHT be kept in memory in order to activate it more quickly if it is run again, but this shouldn't be a permanent allocation, the memory should be able to be reclaimed quickly if required.
I counted at least 8 bandwidthd processes. This seems unnecessaily high, but I don't know how bandwidthd is supposed to operate.
Diagnostics -> System Activity shows 145 processes but the ps output doesn't seem to show anything like that number. Did you inadvertently truncate the ps output you posted?
For comparison, here is a top snapshot from my system (with 256MB RAM):
last pid: 28437; load averages: 0.02, 0.06, 0.07 up 28+19:07:18 06:35:50
43 processes: 1 running, 42 sleeping
CPU: 0.0% user, 0.0% nice, 0.4% system, 2.3% interrupt, 97.3% idle
Mem: 64M Active, 20M Inact, 37M Wired, 88K Cache, 27M Buf, 94M Free
Swap: 260M Total, 260M FreePID USERNAME THR PRI NICE SIZE RES STATE TIME WCPU COMMAND
28437 root 1 44 0 3712K 1988K RUN 0:00 0.20% top
9107 root 1 76 20 3656K 1496K wait 34:32 0.00% sh
31680 root 1 44 0 4948K 2564K select 25:42 0.00% syslogd
4121 nobody 1 44 0 5556K 2648K select 8:47 0.00% dnsmasq
15259 root 1 44 0 5176K 2632K select 6:57 0.00% hostapd
31771 root 1 44 0 3316K 924K piperd 6:06 0.00% logger
31729 root 1 44 0 21272K 19356K bpf 6:05 0.00% tcpdump
12323 root 1 64 20 3316K 1352K select 4:23 0.00% apinger
8666 root 1 44 0 8464K 4204K select 3:52 0.00% mpd5
33684 root 1 64 20 2912K 740K bpf 2:57 0.00% pfflowd
58867 root 1 44 0 6588K 3460K kqread 2:17 0.00% lighttpd
3568 root 2 65 r21 7824K 5880K select 1:44 0.00% siproxd
8697 root 1 64 20 5116K 3336K select 1:39 0.00% openvpn
42967 root 1 76 0 34140K 21676K accept 1:21 0.00% php
1793 root 1 49 0 34140K 20180K accept 1:19 0.00% php
2067 dhcpd 1 44 0 8436K 5784K select 0:31 0.00% dhcpd
15949 _ntp 1 64 20 3316K 1360K select 0:17 0.00% ntpd
12655 root 1 64 20 4496K 1888K piperd 0:08 0.00% rrdtool
56129 root 1 44 0 3404K 1372K nanslp 0:08 0.00% cronIs your memory usage going up? If it is pretty stable after a few days running you probably don't have anything to worry about.
-
Pretty sure I grabbed the whole output, but more than willing to repost if you think I missed something.
Is my memory going up? The short answer is yes. In my original post, it was @ 82%. Two days later it was up to 88%. But as of today it's down to 68%.
So, it's down 20%, but even 68% seems pretty high.
-
Pretty sure I grabbed the whole output, but more than willing to repost if you think I missed something.
Unless my counting was wildly off, your ps output showed under 100 processes whereas the pfSense web GUI reported 143 processes. Why the difference?
Is my memory going up? The short answer is yes. In my original post, it was @ 82%. Two days later it was up to 88%. But as of today it's down to 68%.
So, it's down 20%, but even 68% seems pretty high.
What do you think memory usage should be and why do you think that?
Your system reported it had 145 processes running. My system gets by with under 50 processes. Memory is required to run processes. If you want to reduce the % of memory used it seems there are two obvious courses:
1. Reduce the number of processes.
2. Increase the amount of RAM. -
Looks like the main culprit was ntop.
I uninstalled pfflowd a couple weeks ago… not much change... still hovering around 88% on a regular basis.
So, with my memory usage sitting at 88%... I uninstalled ntop and it immediately dropped my memory usage down to 40%.
Then after uninstalling BandwidthD and Squid it is down to 35%.
-
I found the following FAQ entry at tcpdump:
http://www.tcpdump.org/faq.html#q3
It says that tcpdump should be run with flag -S to avoid high memory usage.
-
good find, we'll try that one out.
-
I've been noticing the same issues, due to the unconstrained growth of the tcpdump process. I'm running the Feb 4th snapshot, so I do have the -S flag.
I filed a bug report: https://redmine.pfsense.org/issues/2819