Playing with fq_codel in 2.4
-

aftre london rebooted :D
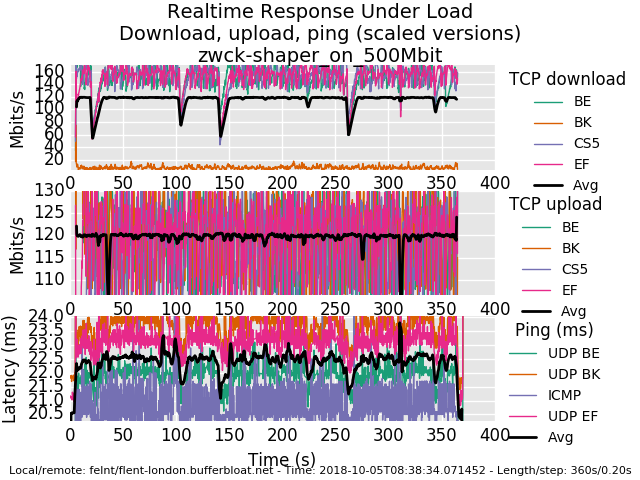
1_1538721917996_rrul-2018-10-05T083834.071452.zwck-shaper_on_500Mbit.flent.gz
admin@pfsense:~ # ipfw sched show 10000: 500.000 Mbit/s 0 ms burst 0 q75536 50 sl. 0 flows (1 buckets) sched 10000 weight 0 lmax 0 pri 0 droptail sched 10000 type FQ_CODEL flags 0x0 512 buckets 1 active FQ_CODEL target 5ms interval 60ms quantum 1514 limit 10240 flows 1024 ECN Children flowsets: 10000 BKT Prot ___Source IP/port____ ____Dest. IP/port____ Tot_pkt/bytes Pkt/Byte Drp 0 ip 0.0.0.0/0 0.0.0.0/0 2357 2546546 0 0 0 10001: 500.000 Mbit/s 0 ms burst 0 q75537 50 sl. 0 flows (1 buckets) sched 10001 weight 0 lmax 0 pri 0 droptail sched 10001 type FQ_CODEL flags 0x0 512 buckets 1 active FQ_CODEL target 5ms interval 60ms quantum 1514 limit 10240 flows 1024 ECN Children flowsets: 10001 0 ip 0.0.0.0/0 0.0.0.0/0 306719 434714257 106 154656 7 admin@pfsense:~ # ipfw sched show 10000: 500.000 Mbit/s 0 ms burst 0 q75536 50 sl. 0 flows (1 buckets) sched 10000 weight 0 lmax 0 pri 0 droptail sched 10000 type FQ_CODEL flags 0x0 512 buckets 1 active FQ_CODEL target 5ms interval 60ms quantum 1514 limit 10240 flows 1024 ECN Children flowsets: 10000 BKT Prot ___Source IP/port____ ____Dest. IP/port____ Tot_pkt/bytes Pkt/Byte Drp 0 ip 0.0.0.0/0 0.0.0.0/0 4507 5174782 8 6208 0 10001: 500.000 Mbit/s 0 ms burst 0 q75537 50 sl. 0 flows (1 buckets) sched 10001 weight 0 lmax 0 pri 0 droptail sched 10001 type FQ_CODEL flags 0x0 512 buckets 1 active FQ_CODEL target 5ms interval 60ms quantum 1514 limit 10240 flows 1024 ECN Children flowsets: 10001 0 ip 0.0.0.0/0 0.0.0.0/0 362125 513262875 133 199500 7 admin@pfsense:~ # ipfw sched show 10000: 500.000 Mbit/s 0 ms burst 0 q75536 50 sl. 0 flows (1 buckets) sched 10000 weight 0 lmax 0 pri 0 droptail sched 10000 type FQ_CODEL flags 0x0 512 buckets 1 active FQ_CODEL target 5ms interval 60ms quantum 1514 limit 10240 flows 1024 ECN Children flowsets: 10000 BKT Prot ___Source IP/port____ ____Dest. IP/port____ Tot_pkt/bytes Pkt/Byte Drp 0 ip 0.0.0.0/0 0.0.0.0/0 46 61760 0 0 0 10001: 500.000 Mbit/s 0 ms burst 0 q75537 50 sl. 0 flows (1 buckets) sched 10001 weight 0 lmax 0 pri 0 droptail sched 10001 type FQ_CODEL flags 0x0 512 buckets 1 active FQ_CODEL target 5ms interval 60ms quantum 1514 limit 10240 flows 1024 ECN Children flowsets: 10001 0 ip 0.0.0.0/0 0.0.0.0/0 5427 7667181 0 0 0 admin@pfsense:~ # ipfw sched show 10000: 500.000 Mbit/s 0 ms burst 0 q75536 50 sl. 0 flows (1 buckets) sched 10000 weight 0 lmax 0 pri 0 droptail sched 10000 type FQ_CODEL flags 0x0 512 buckets 1 active FQ_CODEL target 5ms interval 60ms quantum 1514 limit 10240 flows 1024 ECN Children flowsets: 10000 BKT Prot ___Source IP/port____ ____Dest. IP/port____ Tot_pkt/bytes Pkt/Byte Drp 0 ip 0.0.0.0/0 0.0.0.0/0 3294 3669449 14 10864 0 10001: 500.000 Mbit/s 0 ms burst 0 q75537 50 sl. 0 flows (1 buckets) sched 10001 weight 0 lmax 0 pri 0 droptail sched 10001 type FQ_CODEL flags 0x0 512 buckets 1 active FQ_CODEL target 5ms interval 60ms quantum 1514 limit 10240 flows 1024 ECN Children flowsets: 10001 0 ip 0.0.0.0/0 0.0.0.0/0 90572 128064966 100 147104 1 -
well, the 500mbit results are awesome. there's 4 bursty drop episodes on the download that could be coming from anywhere for any cause - my box, yours, linode's shapers, the path, cosmic radiation.
try a rrul_be test to see if you get that big bursy drop. It's midnight here. I'm fading
-
@dtaht Thanks for the awesome help. It's in am's over here and i need to get to work. I have to read your flent documentation properly, enjoy your sailing trip.
-
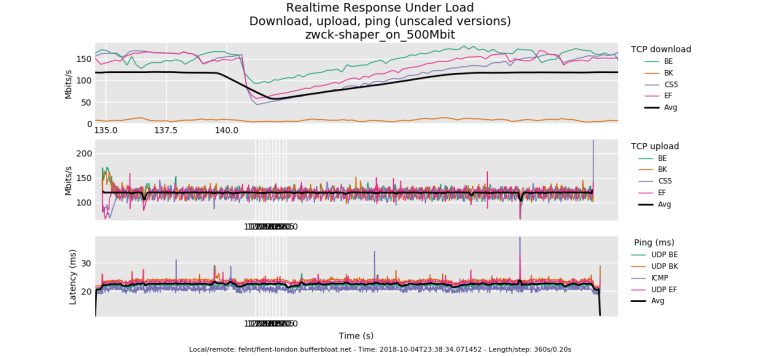
I don't have much insight into that drop but the recovery pattern looks normal
I dont have bbr on that box so can't try that, and is not the miracle of the juniper bushes enough? 800mbit still weird, though?
this also show's diffserv cs1 being respected.
.... you normally shouldn't see all 3 flows dropping a packet at the same time, just one (and you'd see, as in earlier in the test the flows trading bandwidth back and forth in the tcp sawtooth pattern). with 3 simultaneous drops they all cut their bandwidth in half and utilization is lowered while they recover.
-
This post is deleted! -
have a song: https://plus.google.com/u/0/107942175615993706558/posts/UtcLY2W9NXy
-
@dtaht have fun
10000: 800.000 Mbit/s    0 ms burst 0
q75536  50 sl. 0 flows (1 buckets) sched 10000 weight 0 lmax 0 pri 0 droptail
 sched 10000 type FQ_CODEL flags 0x0 512 buckets 1 active
 FQ_CODEL target 5ms interval 60ms quantum 1514 limit 10240 flows 1024 ECN
   Children flowsets: 10000
BKT Prot ___Source IP/port____ ____Dest. IP/port____ Tot_pkt/bytes Pkt/Byte Drp
  0 ip           0.0.0.0/0             0.0.0.0/0     3780  4324863  0    0   0
10001: 800.000 Mbit/s    0 ms burst 0
q75537  50 sl. 0 flows (1 buckets) sched 10001 weight 0 lmax 0 pri 0 droptail
 sched 10001 type FQ_CODEL flags 0x0 512 buckets 1 active
 FQ_CODEL target 5ms interval 60ms quantum 1514 limit 10240 flows 1024 ECN
   Children flowsets: 10001
  0 ip           0.0.0.0/0             0.0.0.0/0     107473 153093543 201 297156   1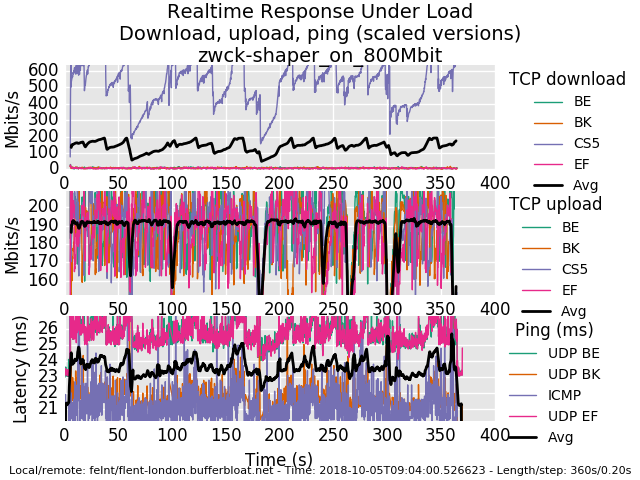
0_1538723446599_rrul-2018-10-05T090400.526623.zwck-shaper_on_800Mbit.flent.gz
-
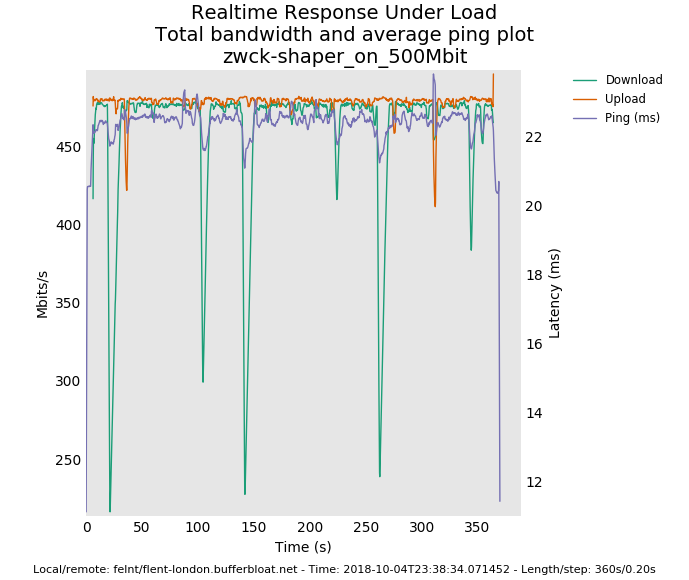
I do gotta say I think these major drops are significant... but I'm tired! need to fire up a different netperf server in a different cloud to see if it's on my end. Got a fav cloud provider? this is linode....
or @uptownvagrant can weigh in
-
It's probably on my end, I have beefier hardware that I can try plus I can maybe set it up similar to what vagrant is doing.
-
do you have any major daemons running out of cron or elsewhere? this is happening ever ~40 sec it looks like... or a gc interval in the kernel?
bed, calling
-
thos 40 second dropouts are the sort of tiny long term misbehavior I have ocd over, even though you'd hardly notice it in normal use. For example this bug in wifi causes drones to physically crash:
http://blog.cerowrt.org/post/disabling_channel_scans/
-
So I'd end up running tests for hours while poking at all the other system resources, watching top for high cpu processes, cron, syslogs...
-
Probably saturday morning i'll do some more testing.
-
@dtaht Thanks again! Please go and enjoy your boating!!!!
In the mean time i try to isolate my network a bit. Are there some good examples how it should look. So i can quickly compare. Will see what i can come up with. I am also waiting for some better hardware for my pfsense box.
-
@zwck I will! The times I've seen something like this are:
local process eating 100% cpu briefly
system management interrupt
kernel gc on something
renewing an ip address via dhcp (router or host on the path)
another program on the network wanting some bandwidth
missing an arp
route update or flap (somewhere)
channel scan (in wifi)
unaligned access trap (in mips)... cosmic radiation and other explanations from the the bofh. :)
-
last bit of ocd. I'm not sure if the interrupt change or the increase in rx ringbuffer size did any good, but I note these are things that are not fixed numbers and need to scale by the bandwidth. "more" interrupts is generally better for low latency networking but too many interrupts overwhelms a modern cpu faster.
I think the sysctl for tso and "large receive" offloads to the igp card are here:
net.inet.tcp.tso="0"
net.inet.tcp.lro="0"These "bulk up packets" in the card and lower system memory and interrupt requirements. I'm all about unbulking and interleaving (FQ-ing) packets. lro in particular is often notoriously buggy, but worth enabling as intel's network cards (igp) in particular generally has good support for it. (be prepared to totally crash the network side of the box though, or break something elsewhere in the network stack).
Now that it is repeatable, can the icmp nat issue get reported somewhere?
-
@dtaht More interrupts is generally better for low end NICs. Higher end NICs have soft-interrupts and dynamic low latency interrupt rate limiting.
The Intel i350 does interrupt coalescing to reduce the interrupt average rate, but if an interrupt has not occurred in a certain amount of time, it can immediately issue an interrupt instead of delaying it. This allows the NIC to quickly respond to sparse data flows. I think Intel implements it as if an interrupt has not occurred within the past N time where N is the size of the coalescing.
In the past, I have measured single digit microsecond(~8us) latency ping flooding my LAN NIC with ~70,000 pps through my switch from my desktop. All the while averaging a nearly perfect 600 total interrupts per second. About 150 interrupts per second per core.
It's been a while since I did that test and I think drivers have changed and I now see a less stead interrupt rate under load. But even when I did my ~1.48Mpps load test on my firewall, I was seeing only a hair bit over 1,000 interrupts per core, hanging around 13% cpu on my 3.3ghz quad i5. Should have went with a dual core. Oh, and that test was with HFSC shaping enabled. The actual pps was closer to 1.43-1.44Mpps because it was from my desktop and it was having issues. But it was 1.44Mpps ingress LAN and 1.44Mpps egress WAN ~13% cpu and ~5k total interrupts per second with shaping.
A soft interrupt is when the device driver using MSI-X to mask off an interrupt, processes some data, then before returning control to the kernel, checks to see if any new data came in. If it sees new data, it can continue to process the new data without any new hardware interrupts, at least from itself not sure about other devices. Once the data is fully consumed, the interrupt mask is removed and new data can cause the hardware to interrupt the CPU again.
-
@harvy66 Would you then recommend we allow the pfSense igb driver dictate the max interrupt rate rather than forcing it via sysctl values in the /boot/loader.conf.local file? I force my max interrupt rate to 32,000.
-
@dtaht Yes, we can create a bug report here:
https://www.netgate.com/docs/pfsense/development/bug-reporting.htmlThere are still some details I would like to collect before filing the bug but anyone can file it now if they have an itch. I believe folks thought the limiter NAT issues were fixed in 2.4+. I'll be away for the next few days but will check in next week.
Here is the most recent related bug I could find that looks to be related:
https://redmine.pfsense.org/issues/4326Post about the long-standing limitation:
https://forum.netgate.com/topic/104297/limiters-do-not-work-with-nat/ -
@Harvy66 Great explanation, thanks.
Some items -
A) 1000 interrupts/sec = 1ms delay in processing packets. We are seeing 2-3ms delays here for the sparse flows on the rrul test. This implies coalescing at about a 1ms interval - where the total delay for those flows were fq_codel running closer to the hw, on a 500mbit workload, should be about, um, 104 usec. there's 6k of tcp packets, 440 bytes by the sparse flows and 256ish for the acks.
So if coalesing could be tuned down to half what's being shown here, observed interlfow latency would be halved. If ya got 13% of cpu used up maybe (is there a tool?) you can turn down coalesing by 7x and get 7x less latency.
(bad measure in that that doesn't deal with context switch overhead. 4x? The tool in linux is called ethtool)
Rant:
Most pps tests with lro, tso tests suck in that they A) only test one 5 tuple stream, not mixed traffic (like the various rrul tests - and real traffic do). This also means you don't stress out the routing cache table which is a huge bottleneck. I'd LOVE a pps test that simulated, oh, 280 flows simultaneously each lasting for .5-2 sec over a minute, using different packet sizes).
We wrote rrul in part because all the industry pps tests were misleading, people were sinking years into things like gro to lie to those tests, instead of focusing on the real underlying traffic problem on real workloads people really had. If we'd focused on the right thing, perhaps we'd have TCAMS in way more hardware, maybe even cpus. Cisco is still laughing all the way to bank on this front.
B) Same goes for outbound shaping - some intel hardware has a programmable completion interrupt rate so you can just tell it "it's a 500mbit interface", and you can just throw fq_codel at it with no limiter and negligable overhead.
Hmm... That hardware might actually be in this atom box we've been debugging. It's not in the apu2. I can't remember the specific model. But the freebsd implementation would have to have fq_codel as a native qdisc.
C) I'd really hoped the isps would demand hardware for their shaping needs that ran fq_codel - it's not that more expensive than a fifo is. There was some early work on this subject from arris ( http://snapon.lab.bufferbloat.net/~d/trimfat/Cloonan_Presentation.pdf ) but I've heard nothing since, and my comcast links still have 680ms of overbuffering where they should have turned it down to under 100ms years ago.
inbound shaping is always going to be very cpu intensive. we can try to parallize that
but that involves fixing the entire path from the driver and hashing in the hardware card.fixing oubound would save 1/3 the cpu for inbound on a symmetric connection.
I'd really hoped the users would rise up and demand less latency, and the isps respond to their bufferbloat "F" scores on:
http://www.dslreports.com/speedtest/results/bufferbloatand their dslam/bras/enodeb/cmts vendors rush in with new or upgraded products to meet the demand in a virtuous circle. I do know of a few isps now getting it right....
D)
Multicores have a tendency to not scale well for routed network traffic. It usually pays to do all the network processing on one core and use the other for administrative processing. Even with a good shared l2 cache, it sucks to cross cores to get to another device. On arm boxes I have, locking eth0 to one core and eth1 to another nearly halves routed throughput.E) I've already ranted about the stupidity of tuning the entire internet for a 20 second test from speedtest.net instead of running realistic tests for hours at a time, or ever even looking at the carnage at t+21.
end rant. I need to go sailing. :)