Playing with fq_codel in 2.4
-
ok, glutton for punishment. Shaped up only. I sure hope the rest of the world isn't as miserably overbuffered as comcast's CMTSes are.....
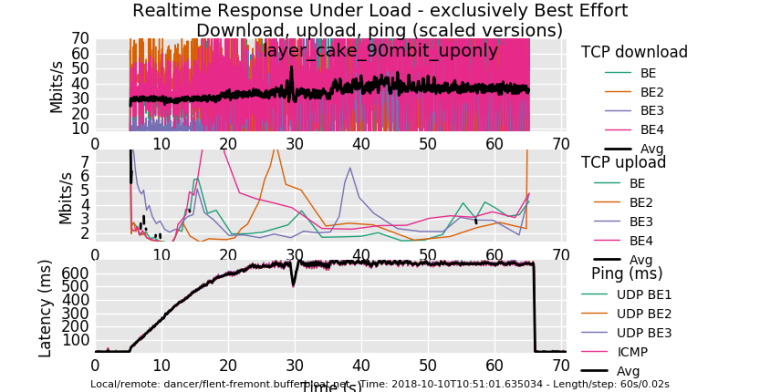
0_1539194140099_rrul_be-2018-10-10T105101.635034.layer_cake_90mbit_uponly.flent.gz
I campaigned hard to get the cable industry to cut their CMTS buffering to a 100ms TOPs. So we're still suffering. pie on the modem is not enough. cheap arm and x86 hardware is not enough....
-
@tibere86 look at the link tman posted, they did try 1024,2048,4096 as values.
-
@zwck Thanks. I see it now.
-
@dtaht thanks for filing the icmp + limiter + NAT bug #9024. I added my note addressing the comment on the filter rules.
I also did some testing with OPNsense 18.7.4 where the aforementioned bug is not present. I've noticed that both with and without NAT, latency is lower across OPNsense with regard to limiters + codel + fq_codel at 800mbit in my tests using the lab. (Codel, and fq_codel settings were same for both distros) Trying to track down what's different between the distros that may address this.
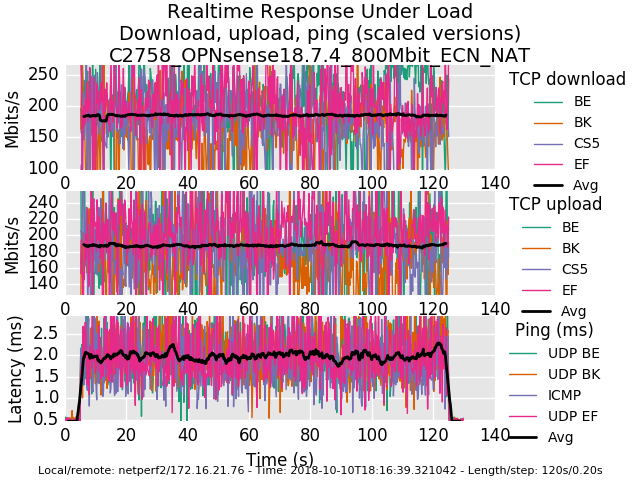
0_1539221734101_rrul-2018-10-10T181639.321042.C2758_OPNsense18_7_4_800Mbit_ECN_NAT.flent.gz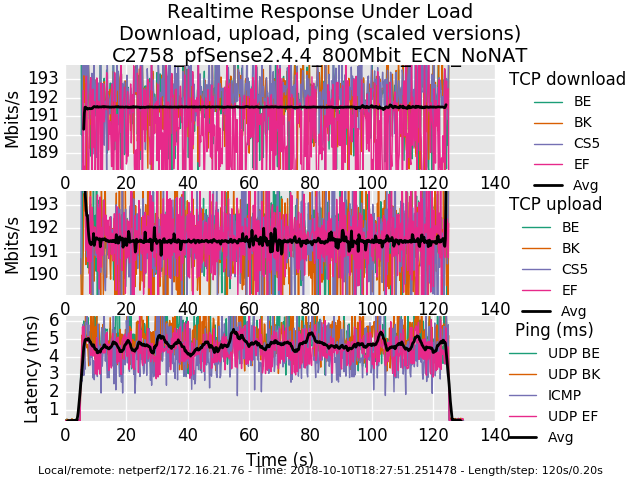
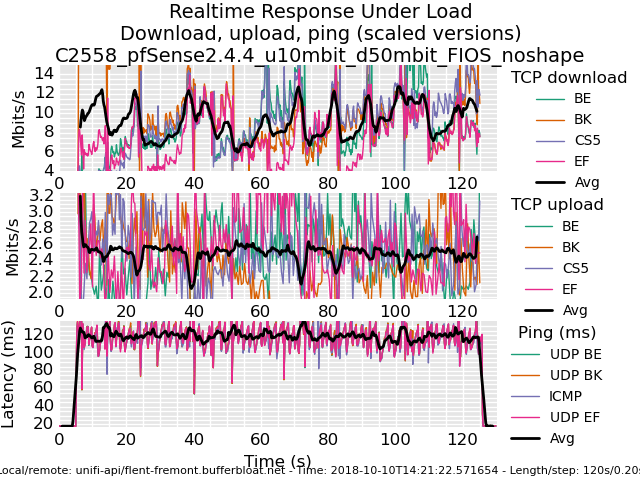
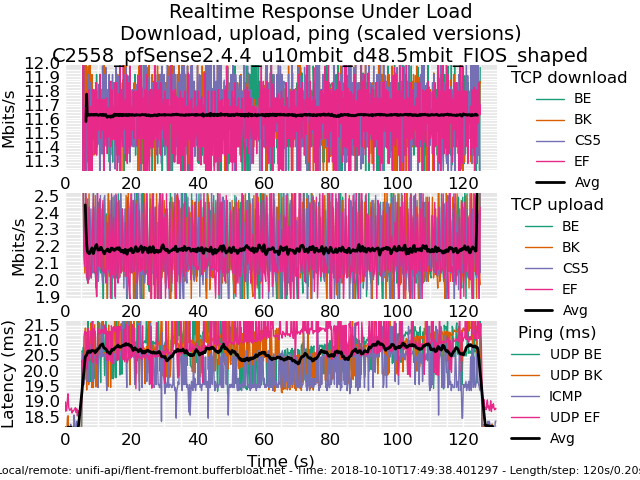
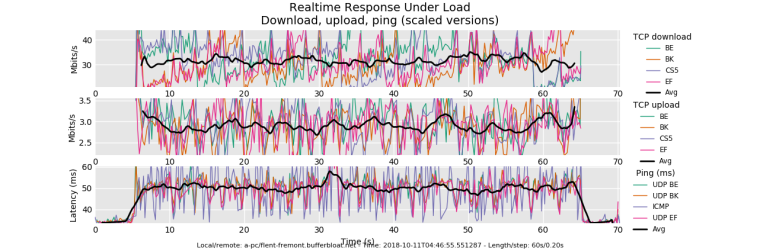
0_1539221755472_rrul-2018-10-10T182751.251478.C2758_pfSense2_4_4_800Mbit_ECN_NoNAT.flent.gzAnd for posterity, here is a comparison of a Frontier FIOS connection without and with fq_codel shaping today.
-
I distinctly remember my graphs being flatter before the 2.4.4 update.
edit: re-uploading the pic results in an "error"
0_1539252489446_rrul-2018-10-11T115959.048554.300_100-with-masks.flent.gz
I am testing against my own vps server. Limiters are applied on the LAN interface as interface rules.
-
Here is one with rules applied on the WAN via a floating rule.
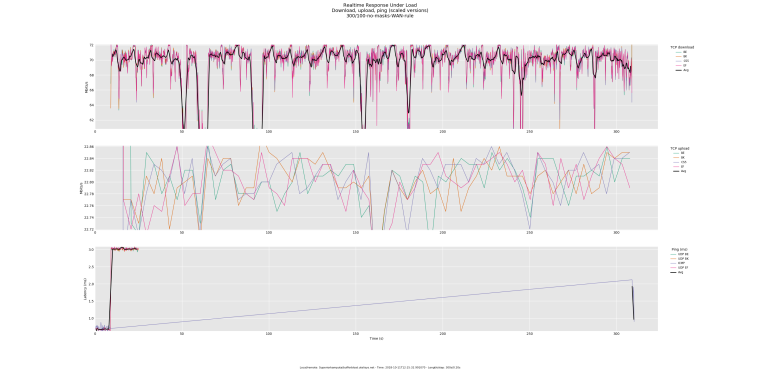
0_1539253359216_rrul-2018-10-11T121532.991070.300_100-no-masks-WAN-rule.flent.gz
FYI, the above results are on 1G symmetrical link. The test server is also on a 1G symmetrical link. The LAN is NAT-ted on a CARP address.
-
My results are really bad. It could be that my modem is listed on that bad modem website
I tweaked some settings but keep getting bad results.
ipfw sched show 00001: 181.000 Mbit/s 0 ms burst 0 q65537 50 sl. 0 flows (1 buckets) sched 1 weight 0 lmax 0 pri 0 droptail sched 1 type FQ_CODEL flags 0x0 0 buckets 0 active FQ_CODEL target 8ms interval 80ms quantum 1518 limit 10240 flows 1024 NoECN Children flowsets: 1 00002: 16.000 Mbit/s 0 ms burst 0 q65538 50 sl. 0 flows (1 buckets) sched 2 weight 0 lmax 0 pri 0 droptail sched 2 type FQ_CODEL flags 0x0 0 buckets 0 active FQ_CODEL target 8ms interval 80ms quantum 1518 limit 10240 flows 1024 NoECN Children flowsets: 2 -
@strangegopher Your induced latency is poor. Your up graph looks fairly normal, your down graph is not quite matching what you set it to. (cpu?). There's evidence of pre-2002 levels of dscp prioritization (somewhere) in that BK (CS1) is treated better than BE (CS1), CS5 is also prioritized, and EF is deprioritized. (try a rrul_be test on the same modem, though)
This bit of magic keeps my badmodem.com modem "more alive", at a cost of some bandwidth:
hping3 -2 -d 0 -s 10080 -k -p 80 -i u150 IP-OF-FIRST-OUTSIDE-CABLE-HOP-HERE
courtesy the relevant thread on the cake mailing list: https://lists.bufferbloat.net/pipermail/cake/2018-July/004128.html
-
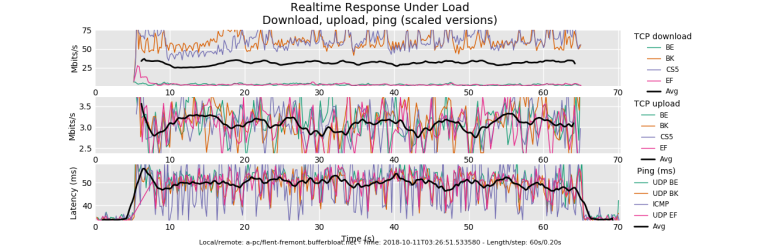
First of all thank you dtaht & the bufferbloat team for an absolutly outstanding toolset. I used HFSC/fq_codel on PFSense before, and the results were good. Then I read about CAKE, so I slammed together an AMD Kabini mini-itx box I had flying about, put ubuntu server and CAKE on it, and deployed that between my PFSense gateway and my Negear CM600 modem. I switched off shaping/limiters on the PFSense gateway, all shaping is handled by the new box using cake.
Below are the results, first pic is without shaping, second one with shaping.
Cheers,
Christian.


-
@xciter327 yea, that's miserable. You lost all the udp packets under load, too. But is it the floating rule or something else? What speed hardware? Whose 1G link? What's the next device in the chain up? Can you temporarily drop carp out of the equation?
I would just like to depressedly note that these sort of problems are seemingly universal across home and business links today - not just the bufferbloat - it's amazing the internet works at all, sometimes.
-
@dtaht said in Playing with fq_codel in 2.4:
@xciter327 yea, that's miserable. You lost all the udp packets under load, too. But is it the floating rule or something else? What speed hardware? Whose 1G link? What's the next device in the chain up? Can you temporarily drop carp out of the equation?
I would just like to depressedly note that these sort of problems are seemingly universal across home and business links today - not just the bufferbloat - it's amazing the internet works at all, sometimes.
I deeply share You sentiment about the Internet working at all. To answer some questions:
- I don't know if it's the floating rule or not, that's why I am testing :)
- Hardware is Atom C2758 with Intel NICs with all the offloading capabilities disabled.
- My 1Gbps link. I work for an ISP. Can control pretty much anything in the chain.
- I can rule out CARP as a culprit. Will test this in a closed environment.
P.S. - for some reason I keep getting an error messages when I try to add a screenshot to a post.
-
@gsakes love the before/after. I like these 35ms cake RTT tests because they more clearly show the sawtooth in tcp. On your download you can see the BE, cs5 and ef flows duking it out, when one drops, the other gets a bit of bandwidth, trading sides (so the average is flat) and because it's on inbound (less control) you only get a little boost to the other marked flows. On outbound (tons more control) you get 6.5% for background, 25% for the BS5 and EF flows combined, and the rest for BE.
You can get more resolution on the reflected sawtooths with -s .02. You can actually capture the tcp sawtooths, rtt, and cwnd on a tcp_nup test with
-s .02 --te=upload_streams=4 --socket-stats tcp_nup
You'll see additional options for various new tcp related plots on files with that additional data in the gui.
Also socket-stats EATS memory especially with .02. I need 6GB of ram and minutes of post-processing to process a 5 minute test with this much data, so... don't run for 5 minutes.
All praise to toke for the flent tool. He so totally deserves his PHD and tons of beer. I really have no idea how he manages all he does (he is a devout user of emacs's org-mode, among other things) but this is the story of flent:
https://blog.tohojo.dk/2017/04/the-story-of-flent-the-flexible-network-tester.html
A ton of folk worked on cake. after 5 years of development and a great deal of "second system syndrome", I am ambivalent about many features of cake, but things like this, per host fq, and someone actually using it do cheer me up. thx.
Are the ack-filter or nat options on in this test? :P It's really amazing how much ack traffic can be safely dropped.
-
@gsakes I'm also loving that people here are posting their flent.gz files. Can you add those to your recent post? I like producing comparison graphs when I can. I am also really fond of the CDF plots in general. I find those the most useful after we determine sanity. Then their's the "winstein" plots taken from the remy paper: http://web.mit.edu/remy/
Through all these processes we'd hoped to find plots that "spoke" to people according to how they think... and how things actually worked. Single number summaries don't work.
And to raise the quality of public conversation: Instead of the stupid fixed number of the stupid fixed cyclic public discussion: "that's my bandwidth. My (speedtest) ping at idle is nothing. My internet sucks." ""You just need more bandwidth and that will make everything better". "It doesn't." "You're doing something wrong.".
"NO. IT's THIS! (bufferbloat, badmodems, floating limiters, broken stacks, firewall stupidity, busted ideas as to prioritzation, ipv6 vs ipv4)"
and not hearing crickets... "Here's a f-ing rrul test showing how your network's f-cked up." "What's a rrul test?"... "aahhhh, glad you asked. Let me explain.... first, apt-get install flent, then...." To quote alice's restaurant, "if all we could do is get 50 people a day to walk into your network, 50 people a day, to run the rrul test, post the results publicly . and walk out... why, we'd have ourselves a movement!
And we're getting there. 2b routers to fix, though. Need all the help we can get - and tests like these have got to start getting into isp's evaluation labs, and chipset makers and vendors, so they find these problems before shipping. (that's also why flent is designed like it is - two simple DUT test servers (irtt and netperf) - and a tool for driving, plotting and scripting the tests that can run on anything. You don't need any of it on the public internet.
We just got word that irtt is now available on some versions of android.
-
@dtaht Preparing an answer - yep, spent 7 years as an OPS Engineer with the second largest CDN on the planet - so yes, I know all about bufferbloat; it's a huge issue with streaming video, maybe the biggest last mile problem, and as a CDN we can't do anything about it, very frustrating.
I will run the sawtooth graphs and provide the flent files in a few minutes.
-
@gsakes -s .02 --te=upload_streams=4 --socket-stats tcp_nup
my bad. Also this EATS memory especially with .02
-
@dtaht i am running tests in vmware player in bridged mode.
here is rrul_be:
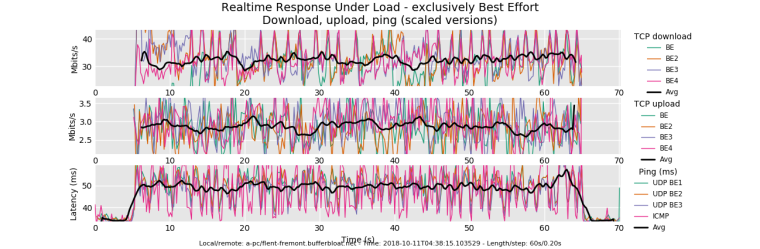
Not so bad considering what I am working with. But my download/upload speed should be higher
I made more changed to my settings
ipfw sched show 00001: 181.000 Mbit/s 0 ms burst 0 q65537 50 sl. 0 flows (1 buckets) sched 1 weight 0 lmax 0 pri 0 droptail sched 1 type FQ_CODEL flags 0x0 0 buckets 1 active FQ_CODEL target 8ms interval 72ms quantum 1518 limit 10240 flows 1024 NoECN Children flowsets: 1 BKT Prot ___Source IP/port____ ____Dest. IP/port____ Tot_pkt/bytes Pkt/Byte Drp 0 ip 0.0.0.0/0 0.0.0.0/0 19 24320 0 0 0 00002: 16.000 Mbit/s 0 ms burst 0 q65538 50 sl. 0 flows (1 buckets) sched 2 weight 0 lmax 0 pri 0 droptail sched 2 type FQ_CODEL flags 0x0 0 buckets 1 active FQ_CODEL target 8ms interval 72ms quantum 300 limit 1000 flows 1024 NoECN Children flowsets: 2 0 ip 0.0.0.0/0 0.0.0.0/0 15 1080 0 0 0 -
@dtaht said in Playing with fq_codel in 2.4:
--te=upload_streams=4 --socket-stats tcp_nup
I'm getting timeouts on the nup test, here's my command line:
flent -s .02 -x -H flent-fremont.bufferbloat.net -H flent-newark.bufferbloat.net -H flent-fremont.bufferbloat.net -H flent-fremont.bufferbloat.net --te=upload_streams=4 --socket-stats tcp_nup root@bitmatrix:~# tc -s qdisc show dev enp1s0 qdisc cake 8005: root refcnt 2 bandwidth 21Mbit diffserv4 dual-srchost nat nowash no-ack-filter split-gso rtt 100.0ms raw overhead 0 Sent 1112850004 bytes 2160750 pkt (dropped 3282, overlimits 5795627 requeues 2) backlog 0b 0p requeues 2 memory used: 93612b of 4Mb capacity estimate: 21Mbit min/max network layer size: 42 / 1514 min/max overhead-adjusted size: 42 / 1514 average network hdr offset: 14 Bulk Best Effort Video Voice thresh 1312Kbit 21Mbit 10500Kbit 5250Kbit target 13.8ms 5.0ms 5.0ms 5.0ms interval 108.8ms 100.0ms 100.0ms 100.0ms pk_delay 15.7ms 182us 7us 1.5ms av_delay 13.4ms 13us 0us 434us sp_delay 3us 4us 0us 4us backlog 0b 0b 0b 0b pkts 252299 1050251 4 861478 bytes 42532854 912242440 360 163019006 way_inds 0 18976 0 0 way_miss 13 11904 4 131 way_cols 0 0 0 0 drops 722 1030 0 1530 marks 0 0 0 0 ack_drop 0 0 0 0 sp_flows 1 2 1 1 bk_flows 0 1 0 0 un_flows 0 0 0 0 max_len 3028 12112 90 3028 quantum 300 640 320 300 qdisc ingress ffff: parent ffff:fff1 ---------------- Sent 4163690073 bytes 3328344 pkt (dropped 0, overlimits 0 requeues 0) backlog 0b 0p requeues 0 root@bitmatrix:~# tc -s qdisc show dev ifb4enp1s0 qdisc cake 8006: root refcnt 2 bandwidth 144Mbit diffserv4 dual-dsthost nat wash no-ack-filter split-gso rtt 100.0ms raw overhead 0 Sent 4302999869 bytes 3330326 pkt (dropped 160, overlimits 4589923 requeues 0) backlog 0b 0p requeues 0 memory used: 447108b of 7200000b capacity estimate: 144Mbit min/max network layer size: 60 / 1514 min/max overhead-adjusted size: 60 / 1514 average network hdr offset: 14 Bulk Best Effort Video Voice thresh 9Mbit 144Mbit 72Mbit 36Mbit target 5.0ms 5.0ms 5.0ms 5.0ms interval 100.0ms 100.0ms 100.0ms 100.0ms pk_delay 0us 80us 0us 10us av_delay 0us 21us 0us 7us sp_delay 0us 5us 0us 2us backlog 0b 0b 0b 0b pkts 0 3288436 0 42050 bytes 0 4300691985 0 2550124 way_inds 0 5366 0 0 way_miss 0 12349 0 9 way_cols 0 0 0 0 drops 0 160 0 0 marks 0 0 0 0 ack_drop 0 0 0 0 sp_flows 0 1 0 1 bk_flows 0 0 0 0 un_flows 0 0 0 0 max_len 0 43906 0 188 quantum 300 1514 1514 1098 -
@dtaht the first plot must have had some kind of issue because now my new plot looks like this:
-
all vm's have additional latency for networking. Try pinging the local gw in another window, while testing, and I'll bet a beer that's at around 5ms under this load.
your vm could switch to fq_codel on it's virtual network qdisc, if it isn't already, but it won't help much, and might hurt.
-
@gsakes I goofed when I wrote that, I meant to specifiy flent-newark twice.
as for timeouts? well, --socket-stats eats cpu... or we have a bug. Or flent-newark is acting up... or... (post a bug to the flent github tracker)