Snort + Barnyard2 + What?
-
@pwnell said in Snort + Barnyard2 + What?:
So what GUI tool exist that can:
Talk to Barnyard2 / interface with its mysql DB
Is supported on a modern OS
Has the ability to categorize / inspect alerts and drill down to packet dump levelAny opinions would be greatly appreciated.
I use Graylog + Grafana for this.
I am new to those platforms, so I won't be much help when you run into issues.
The general configuration is as follows:
-
Get a Graylog VM/container setup on a machine with a good amount of RAM+SSD space. Be aware that the default OVA image from Graylog 2.4 will require some modifications. I forget what I had to do, but it was annoying tinkering to get it even up and running. This will give you something similar to an ELK stack (which is another way of doing this).
-
Configure your logging to feed into Graylog. I use Suricata, so I use the built-in EVE JSON logging which means setup on the Graylog side is far simpler. If you're set on using Snort, then you have to either see if someone has created plugins for Barnyard/Syslog from Snort, or make your own parser. To forward logs in a more robust way, I use the "filebeat" log forwarder rather than syslogng or rsyslog.
-
Once you can process basic events in Graylog, expand your capabilities by adding in geo location for mapping, reverse dns, and perhaps OTX data.
-
Install Grafana. I have a few templates I've modified, but you can also find reasonable starting places at the Grafana site.
I found this link helpful: https://github.com/opc40772/suricata-graylog as a quickstart for Suricata + Graylog -- but know that he's pretty spare with details, the tutorial is for older versions, and some of his steps are ill-advised (his template for the Elasticsearch index, for example, changes the datatypes to mostly text/keyword rather than more advanced datatypes) -- you will have to learn on your own and make changes.
It took me a few days to get it all figured out, and you will use a ton of disk space for the logging if you have a busy network and keep logs for any period of time.
The benefits are much more actionable alerts due to:
- reverse DNS for every IP by default
- immediate links to rule source and documentation at snort/et/suricata websites
- the ability to correlate streams across interfaces
- additional IP reputation data and links to determine if traffic is a potential issue or if an IP can be whitelisted (I use VirusTotal, RiskIQ, Hybrid-Analysis, and a few others)
Somewhere in the forum here is a screenshot of a small portion of the dashboard I made if you look around you'll get an idea.
-
-
@boobletins said in Snort + Barnyard2 + What?:
Install Grafana
I have managed to get filebeats, grafana and suricata all running. However I am stumped at this step:
Configured lookup table <Service Port Translator> doesn't existWhen I try to apply the content pack "Suricata Content Packs". I did copy the csv file:
cp service-names-port-numbers.csv /etc/graylog/serverBut I did not see where I need to inform Graylog of this lookup table. Any pointers? Google did not help.
** Nevermind - I see I had to manually create the data adapter, cache then lookup table.
** Update2: Seems like I was wrong. If I create it manually I now get duplicate key violation. I have no idea how to get this content pack installed :(
** Update3: For anyone in my shoes, I ended up editing the content pack file, deleted everything except the lookup table config, imported it and applied it, then uninstalled it and then removed the lookup table definitions and applied the rest of the config. It seems like the latest Graylog does not allow creation of a lookup table and using it in one content pack? Anyway, now I have raw Suricata logs in Graylog.
** Update4: I am nearly there but stumped. Grafana is installed, I defined the ElasticSearch data source and then imported the dashboard ID 5243 but I have only Interface, protocol, Alert Category and Destination Service Name selectors in my grafana dashboard - nothing else. Clicking on Add Panel does nothing. Dark grey screen. No errors in logs. Just this in the JavaScript console:
TypeError: undefined is not an object (evaluating 'this.pluginInfo.exports') — DashboardGrid.tsx:166 -
Ehe, yeah, that sounds about like how my experience went only I would have had an "** Update15" or so. Sorry I wasn't around earlier to save you some headaches.
Your current error isn't one I ran into, but did you check the dependencies for that dashboard?
Dependencies:
GRAFANA 5.0.3
ELASTICSEARCH 5.0.0
GRAPH 5.0.0
PIE CHART 1.2.0
SINGLESTAT 5.0.0
TABLE 5.0.0If you have all of those installed, then I won't be much help. For some reason I think WorldMap wasn't installed when I did this, and it isn't in that list, but it's used in the dashboard. Maybe that's the missing component?
That's the same dash I started with and modified. I'll see if I can scrub the ones I created and export them for you tomorrow. The base version is attractive, but not as useful as I'd like it to be.
Some ideas if you're spending the weekend working on this:
-
Don't get married to your initial data. You will need to adjust the datatypes in your Elasticsearch indices which will purge existing data. You will also need to reconcile field names and normalize them across different logging functions as you add features.
-
If you're using Suricata in inline IPS mode, start by creating a table that contains "allowed" events. These would be Alerts that fired, but were not blocked due to your current SID management settings. This is often the most useful data as it indicates a rule that needs to be adjusted or traffic that needs to be investigated (because it's not being blocked). The query would just add something like: "AND alert_action:allowed" - as far as I know, this is difficult to get out of pfSense easily, but it's the most useful view.
-
The EVE JSON logging from Suricata can output DNS logs. This is very useful because true reverse DNS lookups (PTR records) are often missing which means if you enable automatic reverse DNS in Graylog (this is a lookup table + plugin you create -- its own complication), you can still lack human-readable data. If you use the logging from the initial DNS resolution and run the query in reverse, you can often get more information about what was happening. This also allows you to search for traffic to/from IP addresses which were not recently resolved which is its own kind of suspicious traffic. I initially tried to investigate accessing Unbound's cache to accomplish this, but found that the EVE JSON logging was easier. I suggest using actual RDNS at the same time because the PTR records provide different information in many cases (if there are CNAME records, etc).
-
Add links to table cells. Unfortunately Grafana is a little frustrating here (I wish there was a way to add arbitrary HTML easily) -- but you can still get a lot of mileage out of turning IP address, domains, and SIDs into links to useful resources (eg VirusTotal and similar services). Turning SIDs into links to the rule data can be quite useful as well. I was recently getting a lot of alerts on SID 2026487 from ET Open. I was able to click through to the alert text, read what was happening, click back to my FLOW and read the data that triggered it, and determine that the rule was either overly broad or contained a typo. I wrote the ET Open guys and they adjusted the rule (you can also modify them in Suricata).
-
Add additional JSON lookup tables. The Cache+Adapter+LookupTable feature in Graylog is great for interacting with external APIs without much work. DShield, for example, has a free API to check IP addresses against their sensors. If you checked every IP address every time Graylog saw it, you'd be hammering the API. The built-in caching in Graylog is very nice as it allows you to create the Data Adapter, set some cache settings, and off you go. I'm using this API to get the "attacks" and "count" values for each IP the network sees ( https://isc.sans.edu/api/#ip ) -- without hammering. Obviously if you run into 1000 new IP addresses a second, this isn't a great idea. But for a home network? It's great. AlienVault OTX has a free API (limited) as does VirusTotal (limited) -- I plan to add these in the near future.
Just one note: the dShield drop list is consistently responsible for blocking the most attacks. Today it was responsible for blocking 92% of 4500+ alerts. There are lots of factors here (pfBlocker, the selection bias of taking out entire class Cs), but it's still by far the most "valuable" rule in the ET Open rules. It's interesting to experience that visually over time. It's also interesting to think about the noise reduction it provides...
-
-
Hey,
Thanks for the big update. I stopped posting at Update 4 as I thought it was getting annoying - eventually I figured it out (that it was missing plugins) but I have to confess - I did not look at the dependencies doh, I reviewed the panel JSON and looked up which plugin would for instance support geo data. What a roundabout way.
I had to change some column names (the geo field names did not match my setup), change data types etc. like you said. His Elasticsearch suricata index template did not work for me at all, so I am using the grafana one modified a bit.
I'll review your ideas next... Thanks so much for your help.
-
How are you faring with this? Any useful APIs or views you're willing to share? Let me know if you'd like to see the dashboards I use.
A tip for anyone else who might try this: the EVE JSON encodes packets using base64 -- scapy can take the base64 packet and convert it into a .pcap for use in WireShark. That would look something like this:
from elasticsearch import Elasticsearch
from scapy.all import Ether, wrpcap
from flask import Flask, send_file

import base64

app = Flask(__name__)

@app.route("/<flow_id>")
def get_flow_single_packet(flow_id):
        es = Elasticsearch(
                ['YOUR_IP'],
                scheme="http",
                port=9200
        )

        res = es.search(index="", body={"query": {"match_all": {}}}, q='flow_id:' + flow_id + ' AND _exists_:packet', size=1)

        p = Ether(base64.b64decode(res['hits']['hits'][0]['_source']['packet']))
        wrpcap(flow_id + '-single.pcap', p)
        return(send_file(flow_id + '-single.pcap'))

if (__name__ == '__main__'):
        app.run(debug=True, host='0.0.0.0', port=9201)
Note: This example is wildly insecure, doesn't clean up the .pcap files after sending them, and only returns a single packet from a flow. It's just an example.
Something like this would let you click from a flow in Grafana and open the packet in WireShark -- without having to deal with base64 and so forth.
-
So far I have connected my pfSense filter log to graylog / grafana to see some firewall rule statistics. I also connected another remote node's suricata to the same stream so I have been dealing with setting up new filters to filter on source.
I built some new panels but this is still early days. I had to restart from scratch after I could not delete an extractor, turns out Safari is pretty pathetic and it was not an app issue, but a browser memory leak issue.
Will share once I have something novel :)
-
A quick update:
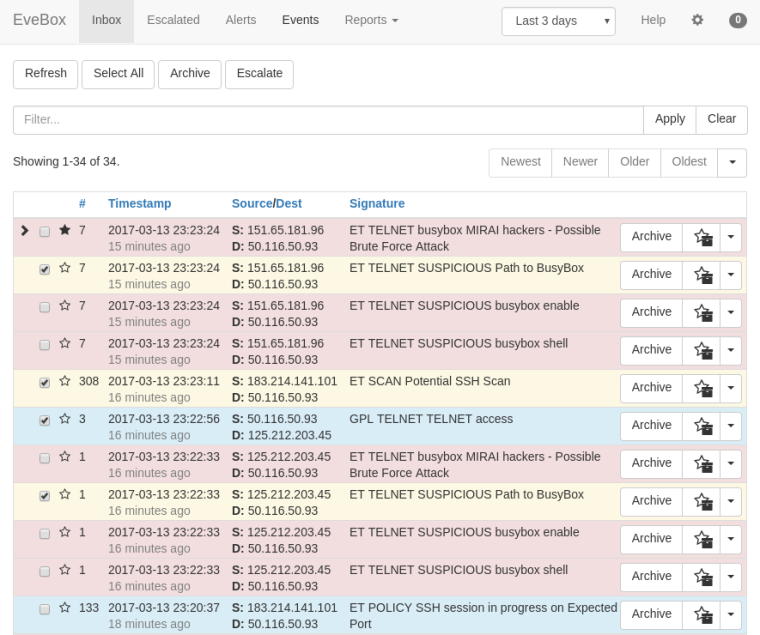
For anyone using Suricata on pfSense, you might want to investigate EveBox. This is by one of the guys who works for OISF (the developers of Suricata).
In its default configuration its meant to be used with an entire ELK stack and a larger product (SELKS), but you can use it with just Elasticsearch. For that you will need an ES instance and FileBeat installed on pfSense and configured to send EVE JSON logs.
This gives a nice interface to search, ignore, download pcaps, etc. I didn't try to put EveBox on pfSense, it's running with the ES instance on Ubuntu.
-
For anyone reading this thread and using Barnyard2 with either Suricata or Snort -- you need to be looking at migrating to a Barnyard2 replacement that works with JSON logging. The Suricata team has already announced they will eventually drop support for the unified2 binary logging format needed by Barnyard2. Currently all new development in Suricata for logging is happening on the EVE (JSON) side of Suricata while the Barnyard2 code in Suricata is just being updated in "maintenance mode" (meaning no new features will be added there).
On the Snort side, Snort3 (when it goes to RELEASE) will have a strong JSON logging component (much like EVE in Suricata). So I would not be surprised to see Barnyard2 eventually deprecated in Snort as well. No material updates of any kind have been done to Barnyard2 in the FreeBSD ports tree for at least 4 years. That's another sign Barnyard2 is slowly dying.
About three years ago I experimented with a logstash-forwarder package on pfSense, but it was a little problematic to maintain. I never did publish it as production code. I'm open to suggestions for something similar to logstash that is lightweight and does not come with a ton of dependencies that will load up the firewall with more attack surfaces. The package would need to ingest JSON logs and then export them to an external host for storage and processing (SIEM-style).
-
Is filebeat not lightweight enough? It will take arbitrary log files and forward them to either a logstash or elasticsearch instance. It is based on the code from logstash-forwarder
To get this working on pfSense 2.4.4 I used the package here:
https://www.freshports.org/sysutils/filebeat -
@boobletins said in Snort + Barnyard2 + What?:
Is filebeat not lightweight enough? It will take arbitrary log files and forward them to either a logstash or elasticsearch instance. It is based on the code from logstash-forwarder
To get this working on pfSense 2.4.4 I used the package here:
https://www.freshports.org/sysutils/filebeatYeah, it can probably work. I just wish there was something out there written in plain old C. The filebeat port, like logstash-forwarder, needs the go language compiled and installed on the firewall in order to execute. That is just more baggage with more security vulnerability exposure points in my old fashioned view.
-
I gave the incorrect link to the port which should have been:
https://www.freshports.org/sysutils/beats/I'm probably confused, but I don't think I have go installed? It may be required to compile, but not execute?
find / -name "go*"doesn't return any results that look like go to me.I can't recall now if it installed and then uninstalled go to compile.
Below is the output from pkg info if that helps at all
beats-6.4.2 Name : beats Version : 6.4.2 Installed on : Wed Nov 28 21:34:33 2018 CST Origin : sysutils/beats Architecture : FreeBSD:11:amd64 Prefix : /usr/local Categories : sysutils Licenses : APACHE20 Maintainer : elastic@FreeBSD.org WWW : https://www.elastic.co/products/beats/ Comment : Collect logs locally and send to remote logstash Options : FILEBEAT : on HEARTBEAT : on METRICBEAT : on PACKETBEAT : on Annotations : FreeBSD_version: 1102000 Flat size : 109MiB Description : Beats is the platform for building lightweight, open source data shippers for many types of operational data you want to enrich with Logstash, search and analyze in Elasticsearch, and visualize in Kibana. Whether you're interested in log files, infrastructure metrics, network packets, or any other type of data, Beats serves as the foundation for keeping a beat on your data. Filebeat is a lightweight, open source shipper for log file data. As the next-generation Logstash Forwarder, Filebeat tails logs and quickly sends this information to Logstash for further parsing and enrichment or to Elasticsearch for centralized storage and analysis. Metricbeat Collect metrics from your systems and services. From CPU to memory, Redis to Nginx, and much more, Metricbeat is a lightweight way to send system and service statistics. Packetbeat is a lightweight network packet analyzer that sends data to Logstash or Elasticsearch. WWW: https://www.elastic.co/products/beats/ -
@boobletins said in Snort + Barnyard2 + What?:
I gave the incorrect link to the port which should have been:
https://www.freshports.org/sysutils/beats/I'm probably confused, but I don't think I have go installed? It may be required to compile, but not execute?
find / -name "go*"doesn't return any results that look like go to me.I can't recall now if it installed and then uninstalled go to compile.
Below is the output from pkg info if that helps at all
beats-6.4.2
Name           : beats
Version        : 6.4.2
Installed on   : Wed Nov 28 21:34:33 2018 CST
Origin         : sysutils/beats
Architecture   : FreeBSD:11:amd64
Prefix         : /usr/local
Categories     : sysutils
Licenses       : APACHE20
Maintainer     : elastic@FreeBSD.org
WWW            : https://www.elastic.co/products/beats/
Comment        : Collect logs locally and send to remote logstash
Options        :
        FILEBEAT       : on
        HEARTBEAT      : on
        METRICBEAT     : on
        PACKETBEAT     : on
Annotations    :
        FreeBSD_version: 1102000
Flat size      : 109MiB
Description    :
Beats is the platform for building lightweight, open source data
shippers for many types of operational data you want to enrich with
Logstash, search and analyze in Elasticsearch, and visualize in Kibana.
Whether you're interested in log files, infrastructure metrics, network
packets, or any other type of data, Beats serves as the foundation for
keeping a beat on your data.

Filebeat is a lightweight, open source shipper for log file data. As the
next-generation Logstash Forwarder, Filebeat tails logs and quickly
sends this information to Logstash for further parsing and enrichment or
to Elasticsearch for centralized storage and analysis.

Metricbeat Collect metrics from your systems and services. From CPU to memory,
Redis to Nginx, and much more, Metricbeat is a lightweight way to send system
and service statistics.

Packetbeat is a lightweight network packet analyzer that sends data to Logstash
or Elasticsearch.

WWW: https://www.elastic.co/products/beats/
lang/go is a build requirement for sure. Further reading and research indicates to me that a go runtime is bundled into the compiled exectuable. The go runtime is described as being similar to the libc library used by C programs, except in the case of go the runtime library is statically-linked into the executable. There is probably no avoiding the use of one of these 'trendy and new sexy" languages when adding a log distributer package. They all seem to have one as either a build, runtime or both requirement. Heaven forbid I once even found one that needed Java on the firewall! What was that developer thinking???
I am not familiar with beats. Does it allow the creation of secure connections with the external log host? For example, logstash-forwarder could use SSL certs to establish a secure connection with the logstash host.
-
Yes, you can specify SSL/TLS settings
One limitation I've run into is that you cannot easily send the same logs to multiple destinations directly from Filebeat. You have to either run multiple instances on the firewall or duplex it from eg a central Logstash service to other locations. It has load balancing built-in, but not duplexing.