Suricata sometimes pegs CPU after rule update
-
@boobletins Yes the CPU will remain high until I notice and do something about it, usually a day or two.
Not sure what you are talking about with "using Advanced Configuration Pass-Through". Could you please point me in the right direction.
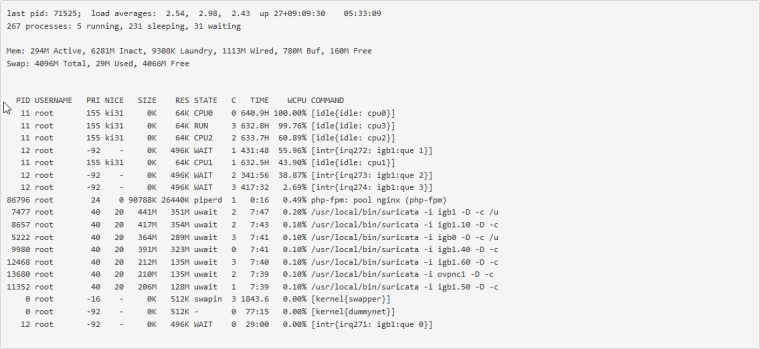
I have looked at what is going on in System Activity when Suricata is acting up. If I'm understanding things correctly, there is a PID for each interface that is being monitored. So I have 7 running, IPS on WAN and IDS on internal network. At normal usage levels the CPU on these is around 0.3-0.5% per. When things break this will jump up into the double digits on several of these. I will have to do a screen shot or something next time it happens. I'll have to try some of the procstat commands on the rouge PIDs next time as well.
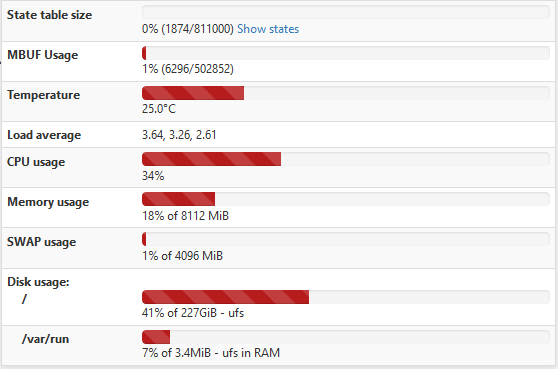
I have never seen the memory usage measured on the dashboard higher than the mid-20's. Swap usage is normally at 1% or so, I don't remember seeing it much higher than that.
-
The easiest way to temporarily add the "-vv" verbose logging option would be to edit the shell script that launches Surictata when the firewall boots and/or pfSense itself restarts packages. That file is /usr/local/etc/rc.d/suricata.sh.
Open that file and you will see the lines that start Suricata on each of your interfaces. Carefully edit those lines to include the "-vv" option.
Now the caveat with this method --
- This change is temporary because each time you stop/start Suricata yourself from within the GUI that shell script is rebuilt from scratch by the PHP code. So any changes made will disappear.
So if you just want to troubleshoot the high CPU usage, then run this set of commands from a shell prompt at the firewall:
/usr/local/etc/rc.d/suricata.sh stopEdit the shell script as described above. You can put the "-vv" option on all interfaces or just the ones you want to monitor. Restart Suricata with this command:
/usr/local/etc/rc.d/suricata.sh startThe shell script will stop/start all interfaces. If you mess up the script, no problem. Just go into the GUI and click Save on the Interface Settings page. That will regenerate a fresh shell script.
-
@bmeeks Thanks for the info. Does the edit survive the restart of Suricata post rule update? Since whatever the issue is usually survives a recycle of the service it will probably just be easier to turn up the logging when there is an issue.
Which log file should I be looking at after adding the -vv option?
-
@mouseskowitz said in Suricata sometimes pegs CPU after rule update:
@bmeeks Thanks for the info. Does the edit survive the restart of Suricata post rule update? Since whatever the issue is usually survives a recycle of the service it will probably just be easier to turn up the logging when there is an issue.
Which log file should I be looking at after adding the -vv option?
Yes, the edit should survive a rules update. It will not survive any edits/saves within the GUI, nor will it survice a Suricata interface start/stop from within the GUI. Any change you make and save within the GUI will recreate that shell script, even for interfaces you did not make an edit for within the GUI.
-
Thanks for the ideas everyone. I will post back after is breaks again and I can get some more detailed info on the problem.
-
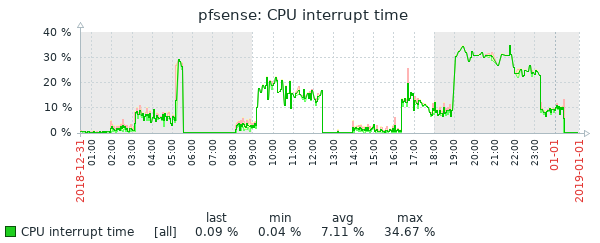
Well, I had issues again this morning. This is the second time it has broken this way, non-Suricata PID with high CPU usage. The main symptom was the RTTsd on WAN to be 100's of ms to the point of the gateway showing down. I didn't try to turn Suricata logging on since I wasn't 100% sure it was related to that. But a recycle of the service fixed things. Hopefully these screen shots will help make sense of things.
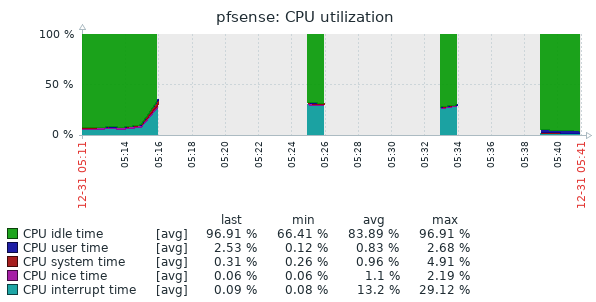
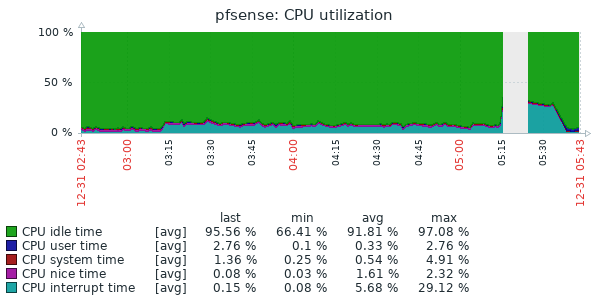
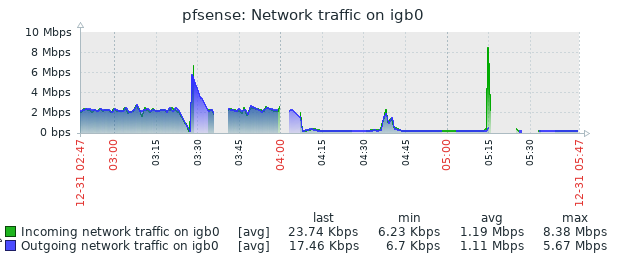
The slight CPU increase around 3:15 looks to the the start of things. The 5:15 download spike is probably downloading roughly 90 MB Steam update. That triggered a spike in CPU that lasted way longer than the download. The tailing off to normal levels of CPU usage is when I recycled Suricata.
Should I just turn on the -vv logging now so that it's on for next time?
-
I'm sure others here will be more knowledgeable, but I see high interrupt usage probably unrelated to Suricata. This is more likely the result of a hardware or driver issue (I believe restarting Suricata on the interface has the side effect that it restarts the interface by taking it up and down to take it in and out of netmap mode, so it may feel like Suricata is the issue).
Could you provide more detail on the NIC? Could you also please provide the information requested under "Asking for help?" here.
Have you added any system tunables?
-
@boobletins This is a Supermicro X9DRD-LF MOBO with dual Intel i350 NICs. I just added the two system tunables mentioned in the article you linked, but there was nothing custom before that.
We'll try the command output as a file since it was flagged for spam when I had it in code brackets.
0_1546329036464_pfsense help.txt
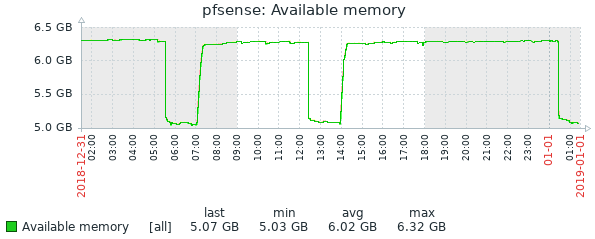
24 hour history of 8GB total memory
-
If you aren't doing anything fancy with cpu pinning/affinity, then you might try setting
hw.igb.num_queues: 1in system tunables.You might also (separately) try changing the MSI/MSIX settings for igb
hw.igb.enable_msix.Something seems off with the balance of these queues which looks to me like it's reflected in the interrupt usage:
dev.igb.1.queue0.rx_packets: 64537749
dev.igb.1.queue0.tx_packets: 454472179
dev.igb.1.queue1.rx_packets: 132156368
dev.igb.1.queue1.tx_packets: 117660
dev.igb.1.queue2.rx_packets: 43342779
dev.igb.1.queue2.tx_packets: 5487
dev.igb.1.queue3.rx_packets: 179038759
dev.igb.1.queue3.tx_packets: 63183
I don't know what exactly would be causing that. Maybe something to do with the vlans it looks like you're running.
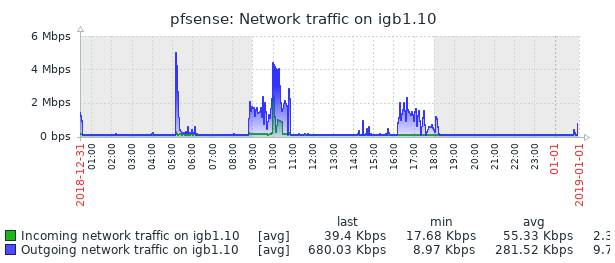
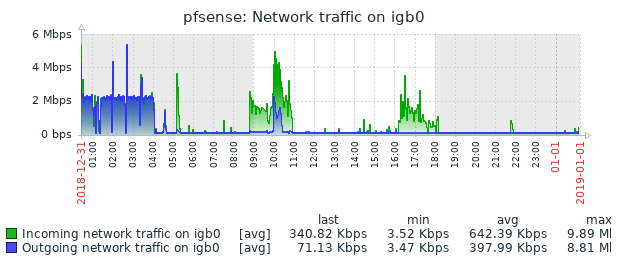
Also note that the issue is with igb1. That's the interface with high interrupt (cpu) usage, but your network traffic graph is for igb0. I would be looking at your VLAN traffic here. Maybe there's a faulty process/configuration somewhere sending a huge number of smaller packets and that interrupt usage is reflecting actual traffic?
Regardless, it doesn't look like this is a suricata issue at all. I would try some of the FreeBSD or pfSense networking forums. I would be interested in knowing how you get it resolved...
-
@boobletins I added the first tunable. What would I put for the value of the second one?
I see what you're saying with an issue on igb1, but how would that cause elevated ping on igb0?
When everything is acting "normally" I was only able to get igb1:que 3 up to 35% WCPU by running an iperf test across vlans. Normally the busiest vlan only has 30 Kbps of traffic that hits the router that is not going out the WAN. There is no traffic that should have caused that high a interrupt usage. It looks like there were two more problems later in the day. But things have been behaving since then without me touching anything.
I'll have to see if anyone in the networking forums has any ideas.
-
@mouseskowitz said in Suricata sometimes pegs CPU after rule update:
What would I put for the value of the second one?
I would leave MSIX alone and wait to see what happens with a single queue.
The i350-T2 should be able to handle the default of 4 queues per port, but something isn't right with the interrupt usage and load balancing across cores. Again, I'm not sure exactly what is causing that -- that's a relatively advanced networking question.
Could you provide the output from
dmesg | grep interruptandvmstat -i?I see what you're saying with an issue on igb1, but how would that cause elevated ping on igb0?
I don't know, but I'm not convinced the two are related.
Another way of answering this question is to ask you which problem you are currently trying to solve
- high cpu usage (as originally reported -- but likely not related to suricata)
- or WAN latency issues (which may be unrelated to above)
-
@boobletins Ideally I would like to solve both of the issues, but the WAN latency is a higher priority. I think they are interrelated, but I have no idea which is causing the other.
dmesg | grep interrupt
igb0: Using MSIX interrupts with 5 vectors
igb1: Using MSIX interrupts with 5 vectors
igb0: Using MSIX interrupts with 5 vectors
igb1: Using MSIX interrupts with 5 vectors
igb0: Using MSIX interrupts with 5 vectors
igb1: Using MSIX interrupts with 5 vectors
vmstat -i
interrupt                          total       rate
irq1: atkbd0                           6          0
irq9: acpi0                            2          0
irq16: ehci0                     3845256          1
irq23: ehci1                     1831351          1
cpu0:timer                    2673498411       1035
cpu1:timer                     377015655        146
cpu3:timer                     376025919        146
cpu2:timer                     375885908        146
irq264: isci0                          1          0
irq266: igb0:que 0             186663825         72
irq267: igb0:que 1              39564243         15
irq268: igb0:que 2              46355532         18
irq269: igb0:que 3              49144499         19
irq270: igb0:link                      2          0
irq271: igb1:que 0             285667733        111
irq272: igb1:que 1              67109876         26
irq273: igb1:que 2              43993156         17
irq274: igb1:que 3              62085685         24
irq275: igb1:link                      8          0
irq276: ahci0                    9574415          4
Total                         4598261483       1781