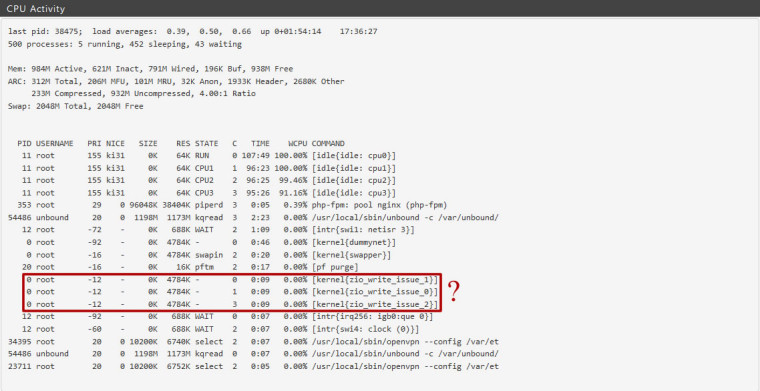
CPU Activity - Possible Problem ?
-
Hello, noticed this while viewing CPU Activity. Couldn't find any info from google so I thought I would ask here.
Does the kernel zio write issue indicate a problem and if so what should I do about it?

-
http://lmgtfy.com/?q=freebsd+kernel+zio+write+issue
-
Yeah, that's normal if you're running ZFS:
[2.4.5-DEVELOPMENT][root@xtm800.stevew.lan]/root: top -aSH

last pid: 10629;  load averages:  0.23,  0.18,  0.09                                                                                                                                   up 0+00:06:40  17:23:12
565 processes: 5 running, 498 sleeping, 62 waiting
CPU:     % user,     % nice,     % system,     % interrupt,     % idle
Mem: 445M Active, 95M Inact, 1031M Wired, 260K Buf, 14G Free
ARC: 451M Total, 72M MFU, 372M MRU, 965K Anon, 1226K Header, 4108K Other
     110M Compressed, 338M Uncompressed, 3.09:1 Ratio
Swap: 2048M Total, 2048M Free

  PID USERNAME   PRI NICE   SIZE    RES STATE   C   TIME    WCPU COMMAND
   11 root       155 ki31     0K    64K CPU2    2   6:30 100.00% [idle{idle: cpu2}]
   11 root       155 ki31     0K    64K CPU3    3   6:28 100.00% [idle{idle: cpu3}]
   11 root       155 ki31     0K    64K CPU0    0   6:28 100.00% [idle{idle: cpu0}]
   11 root       155 ki31     0K    64K RUN     1   6:29  98.00% [idle{idle: cpu1}]
27391 root        21    0   191M   150M nanslp  0   0:05   1.76% /usr/local/bin/ntopng -d /var/db/ntopng -G /var/run/ntopng.pid -s -e -w 0 -W 3000 -i em8 --dns-mode 0 --local-networks 192.168.
27391 root        20    0   191M   150M nanslp  2   0:02   0.68% /usr/local/bin/ntopng -d /var/db/ntopng -G /var/run/ntopng.pid -s -e -w 0 -W 3000 -i em8 --dns-mode 0 --local-networks 192.168.
27391 root        20    0   191M   150M nanslp  3   0:02   0.20% /usr/local/bin/ntopng -d /var/db/ntopng -G /var/run/ntopng.pid -s -e -w 0 -W 3000 -i em8 --dns-mode 0 --local-networks 192.168.
25118 root        20    0   156M   116M uwait   1   0:01   0.10% /usr/local/bin/suricata -i em8 -D -c /usr/local/etc/suricata/suricata_19205_em8/suricata.yaml --pidfile /var/run/suricata_em819
    0 root       -16    -     0K  4960K swapin  3   0:27   0.00% [kernel{swapper}]
   12 root       -60    -     0K   992K WAIT    1   0:01   0.00% [intr{swi4: clock (0)}]
    0 root       -12    -     0K  4960K -       1   0:01   0.00% [kernel{zio_write_issue_0}]
    0 root       -12    -     0K  4960K -       0   0:01   0.00% [kernel{zio_write_issue_2}]
    0 root       -12    -     0K  4960K -       2   0:01   0.00% [kernel{zio_write_issue_1}]
28211 root        30    0 98712K 39896K accept  0   0:01   0.00% php-fpm: pool nginx (php-fpm){php-fpm}
Steve
-
@Grimson , I did mention I tried to google for an explanation with no luck. I found nothing specific to my question and what I did find was beyond my understanding. I did get a really good chuckle out of your link though.
@stephenw10 , Even though the wording would seem to indicate a problem, I'll take your word for it that it isn't. I am using ZFS so it's good to know its normal, thanks!
-
Yeah it's not that sort of an issue but rather a process that's issuing writes as I understand it. I won't pretend to be any sort of ZFS expert though.

Suffice to say I see that on every box I have running ZFS and have never seen any problems on any of them.Steve
-
little over a year later i find myself here. then i think ok let me scroll down, there are MANY 'zio_free_issue_'
i assume this means free/available threads for write capability (zfs - input/output - free - issue - then the rest i assume is threads and then counts or something..) trails off
compared to most in the forums i know jack nothin about specifics like this (excluding majority networking) but the labeling makes sense
thanks either way to everyone


