CPU Usage when network used
-
Yes. I have a PPPoE WAN but fortunately/unfortunately it's no where near fast enough to worry about this.

No benchmarks for the C3958 but if we assume it's the same as the C3858 but with 4 more cores then it should make about ~40% better single thread performance.
It does seem like a waste of cores unless you virtualise it.
Steve
-
Hi Steve,
So I flipped it over. Performance so far looks drastically better. CPU in the gui was about 5-6% while transferring over pppoe. I believe still just the 1 core.
PID USERNAME PRI NICE SIZE RES STATE C TIME WCPU COMMAND
11 root 155 ki31 0K 256K CPU1 1 7:39 97.26% [idle{idle: cpu1}]
11 root 155 ki31 0K 256K CPU10 10 7:41 97.12% [idle{idle: cpu10}]
11 root 155 ki31 0K 256K CPU13 13 7:33 96.96% [idle{idle: cpu13}]
11 root 155 ki31 0K 256K CPU7 7 7:45 96.85% [idle{idle: cpu7}]
11 root 155 ki31 0K 256K CPU11 11 7:38 96.51% [idle{idle: cpu11}]
11 root 155 ki31 0K 256K RUN 4 7:43 96.46% [idle{idle: cpu4}]
11 root 155 ki31 0K 256K CPU3 3 7:44 96.46% [idle{idle: cpu3}]
11 root 155 ki31 0K 256K CPU9 9 7:36 96.26% [idle{idle: cpu9}]
11 root 155 ki31 0K 256K CPU5 5 7:42 95.99% [idle{idle: cpu5}]
11 root 155 ki31 0K 256K RUN 8 7:19 95.56% [idle{idle: cpu8}]
11 root 155 ki31 0K 256K CPU6 6 7:42 95.12% [idle{idle: cpu6}]
11 root 155 ki31 0K 256K CPU2 2 7:42 94.98% [idle{idle: cpu2}]
11 root 155 ki31 0K 256K CPU12 12 7:40 93.93% [idle{idle: cpu12}]
11 root 155 ki31 0K 256K RUN 15 7:35 87.04% [idle{idle: cpu15}]
11 root 155 ki31 0K 256K CPU14 14 7:31 82.95% [idle{idle: cpu14}]
11 root 155 ki31 0K 256K RUN 0 7:24 79.60% [idle{idle: cpu0}]irq298: ix0:q0 2716423 6058
irq299: ix0:q1 244578 545
irq300: ix0:q2 461159 1029
irq301: ix0:q3 243416 543
irq302: ix0:q4 378891 845
irq303: ix0:q5 124788 278
irq304: ix0:q6 478729 1068
irq305: ix0:q7 125913 281
irq306: ix0:link 1 0
irq307: ix1:q0 326596 728
irq308: ix1:q1 254938 569
irq309: ix1:q2 614196 1370
irq310: ix1:q3 250402 558
irq311: ix1:q4 388996 868
irq312: ix1:q5 128709 287
irq313: ix1:q6 492403 1098
irq314: ix1:q7 130143 290
irq315: ix1:link 1 0ix0 is pppoe and ix1 is internal lans.
I was thinking about virtualizing. However I've seen so many talks about people suggesting this is not a great choice for a firewall. However I'm open to exploring this more. Do you have any thoughts? Proxmox was my first choice.
Cheers!
-
Nice, what sort of throughput were you seeing at that point?
I can't really advise on hypervisors, I'm not using anything right now.
A lot of people here are using Proxmox though. ESXi is also popular.
Steve
-
Same throughput but I believe this is more because of the source. I have not had a chance to test internally the network to see if anything there is improved. Will update once I have.
-
so testing with iperf3, I still don't seem to be getting anywhere close to 10G bandwidth.
It looks about spot on with 1G.
[ 41] 0.00-10.00 sec 56.4 MBytes 47.4 Mbits/sec 3258 sender
[ 41] 0.00-10.00 sec 56.4 MBytes 47.3 Mbits/sec receiver
[ 43] 0.00-10.00 sec 58.1 MBytes 48.8 Mbits/sec 3683 sender
[ 43] 0.00-10.00 sec 58.0 MBytes 48.6 Mbits/sec receiver
[SUM] 0.00-10.00 sec 1.10 GBytes 943 Mbits/sec 69930 sender
[SUM] 0.00-10.00 sec 1.10 GBytes 941 Mbits/sec receiverAny ideas?
This is literally SFP+ 10G interface on pfsense to switch to fileserver. The file server has two 10G bonded links. Nothing else running.
Cheers!
-
How many processes are you running there?
You have 8 queues so I don't expect to any advantage over 8.
Is that result testing over 1G? What do you actually see over 10G?
I would anticipate something ~4Gbps maybe. Though if you're running iperf on the firewall it may reduce that.Steve
-
My test with iperf was sending 20 connections (what I saw someones example on the internets doing) and it looks pretty much to saturate if it were 1G.
This is not 1G. This is using my internal network. Pfsense reports it as 10G, the switch is all 10G, and the file server has 2x10G.
Curious why would iperf on the firewall reduce this?
fyi cpu did not appear stressed in any way.
Cheers!
-
That seems far too much like a 1G link limit to be coincidence.
Check that each part is actually linked at 10G.
Steve
-
so on my pfsense I can see all my internal interface vlans are listed with:
media: Ethernet autoselect (10Gbase-T <full-duplex>)
on my NAS I see the bonded interfaces:
Settings for eth4:
Supported ports: [ FIBRE ]
Supported link modes: 1000baseKX/Full
10000baseKR/Full
Supported pause frame use: Symmetric Receive-only
Supports auto-negotiation: No
Advertised link modes: 1000baseKX/Full
10000baseKR/Full
Advertised pause frame use: Symmetric
Advertised auto-negotiation: No
Speed: 10000Mb/s
Duplex: Full
Port: Direct Attach Copper
PHYAD: 0
Transceiver: internal
Auto-negotiation: off
Cannot get wake-on-lan settings: Operation not permitted
Current message level: 0x00000014 (20)
link ifdown
Link detected: yesSettings for eth5:
Supported ports: [ FIBRE ]
Supported link modes: 1000baseKX/Full
10000baseKR/Full
Supported pause frame use: Symmetric Receive-only
Supports auto-negotiation: No
Advertised link modes: 1000baseKX/Full
10000baseKR/Full
Advertised pause frame use: Symmetric
Advertised auto-negotiation: No
Speed: 10000Mb/s
Duplex: Full
Port: Direct Attach Copper
PHYAD: 0
Transceiver: internal
Auto-negotiation: off
Cannot get wake-on-lan settings: Operation not permitted
Current message level: 0x00000014 (20)
link ifdown
Link detected: yesOn the switch:
0/3 PC Mbr Enable Auto D 10G Full Up Enable Enable Disable (nas)
0/4 PC Mbr Enable Auto D 10G Full Up Enable Enable Disable (nas)
...
0/16 Enable Auto 10G Full Up Enable Enable Disable (pfsense) -
Do you use traffic shaping/limiters?
-
Unless there is something configured from a default install I have not set anything myself. Going into the traffic shaper area it does not appear to have anything set.
For reference I have dismantled my NAS bonded interfaces and just using 1 interface now. Results are about the same showing about 1G speed.
Thanks!
-
Update: I have now separated the NAS from the rest of the VLAN's I had to try and ensure nothing going on there. Now its on its own 10G interface. Results about the same.
Another interesting fact. If I reverse the iperf direction. NAS to PFsense I can see the bandwidth spike up to more around the 2G range.
Doing -P20 (20 transfers at once)
[SUM] 0.00-10.00 sec 2.71 GBytes 2.33 Gbits/sec receiverWithout, it will drop down to a little over 1G.
Any ideas?
-
Is that using the -R switch? Can you try running the actual client on the NAS and server on pfSense? That will open firewall states differently.
You could also try disabling pf as a test. If there is a CPU restriction still that should show far higher throughput.
Steve
-
I had not used -R before but I tried it with or w/o -P20 and the results seem to be about the same.
I have also tried replacing the SFP+ cables with brand new ones. No difference.
Disabling PF (firewall) did not appear to do anything noticeable.
Two things I have noticed now.
-
Transfer with PFSense as the client and Fileserver as the server the speed is best and using parallel connections (-P20) it gets a little over 2G.
However when I reverse this and have PFSense as the server and the file server as client the speeds are drastically worse. -
There does appear to be a lot of retries with the iperf sending. I am not sure if this is a "normal" result or not. It does appear to happen regardless of the direction. But is always the sender.
[ ID] Interval Transfer Bitrate Retr
[ 5] 0.00-10.00 sec 304 MBytes 255 Mbits/sec 15 sender
[ 5] 0.00-10.00 sec 302 MBytes 253 Mbits/sec receiver
[ 7] 0.00-10.00 sec 25.5 MBytes 21.4 Mbits/sec 9 sender
[ 7] 0.00-10.00 sec 24.2 MBytes 20.3 Mbits/sec receiver
[ 9] 0.00-10.00 sec 210 MBytes 176 Mbits/sec 15 sender
[ 9] 0.00-10.00 sec 208 MBytes 174 Mbits/sec receiver
[ 11] 0.00-10.00 sec 116 MBytes 97.5 Mbits/sec 9 sender
[ 11] 0.00-10.00 sec 114 MBytes 95.9 Mbits/sec receiver
[ 13] 0.00-10.00 sec 35.9 MBytes 30.1 Mbits/sec 19 sender
[ 13] 0.00-10.00 sec 34.2 MBytes 28.7 Mbits/sec receiver
[ 15] 0.00-10.00 sec 104 MBytes 87.1 Mbits/sec 17 sender
[ 15] 0.00-10.00 sec 102 MBytes 85.5 Mbits/sec receiver
[ 17] 0.00-10.00 sec 127 MBytes 106 Mbits/sec 13 sender
[ 17] 0.00-10.00 sec 124 MBytes 104 Mbits/sec receiver
[ 19] 0.00-10.00 sec 449 MBytes 377 Mbits/sec 11 sender
[ 19] 0.00-10.00 sec 447 MBytes 375 Mbits/sec receiver
[ 21] 0.00-10.00 sec 64.1 MBytes 53.8 Mbits/sec 18 sender
[ 21] 0.00-10.00 sec 62.4 MBytes 52.3 Mbits/sec receiver
[ 23] 0.00-10.00 sec 261 MBytes 219 Mbits/sec 19 sender
[ 23] 0.00-10.00 sec 258 MBytes 216 Mbits/sec receiver
[ 25] 0.00-10.00 sec 182 MBytes 153 Mbits/sec 15 sender
[ 25] 0.00-10.00 sec 180 MBytes 151 Mbits/sec receiver
[ 27] 0.00-10.00 sec 129 MBytes 108 Mbits/sec 13 sender
[ 27] 0.00-10.00 sec 127 MBytes 106 Mbits/sec receiver
[ 29] 0.00-10.00 sec 288 MBytes 242 Mbits/sec 13 sender
[ 29] 0.00-10.00 sec 285 MBytes 239 Mbits/sec receiver
[ 31] 0.00-10.00 sec 48.7 MBytes 40.8 Mbits/sec 11 sender
[ 31] 0.00-10.00 sec 47.3 MBytes 39.6 Mbits/sec receiver
[ 33] 0.00-10.00 sec 332 MBytes 279 Mbits/sec 13 sender
[ 33] 0.00-10.00 sec 330 MBytes 277 Mbits/sec receiver
[ 35] 0.00-10.00 sec 76.5 MBytes 64.2 Mbits/sec 17 sender
[ 35] 0.00-10.00 sec 74.6 MBytes 62.6 Mbits/sec receiver
[ 37] 0.00-10.00 sec 233 MBytes 196 Mbits/sec 16 sender
[ 37] 0.00-10.00 sec 230 MBytes 193 Mbits/sec receiver
[ 39] 0.00-10.00 sec 78.1 MBytes 65.5 Mbits/sec 16 sender
[ 39] 0.00-10.00 sec 76.6 MBytes 64.3 Mbits/sec receiver
[ 41] 0.00-10.00 sec 58.4 MBytes 49.0 Mbits/sec 16 sender
[ 41] 0.00-10.00 sec 57.1 MBytes 47.9 Mbits/sec receiver
[ 43] 0.00-10.00 sec 67.5 MBytes 56.6 Mbits/sec 18 sender
[ 43] 0.00-10.00 sec 65.8 MBytes 55.2 Mbits/sec receiver
[SUM] 0.00-10.00 sec 3.11 GBytes 2.68 Gbits/sec 293 sender
[SUM] 0.00-10.00 sec 3.08 GBytes 2.64 Gbits/sec receiveriperf Done.
I have started engaging support with the file server manufacture to see if they have any thoughts. It's looking more and more likely that PFSense is not the issue here. But as always open to any suggestions...
Cheers!
-
-
Use iperf3 if you can. That's available for installing from the command line in pfSense.
pfSense is not optimised to be a server (or client in this case). It will almost certainly perform better testing through it rather than to it.
Steve
-
Yes sorry I am using iperf3 as I had compatibility issues with the NAS before.
I will also be trying to fire up some sort of test box to see if it can achieve more desirable results.
Cheers!
-
Hi again,
So I did manage to fire up a test box. Results are better but unfortunately it does look like there is something with the PFSense hw/config.
Test1. Connected test box to the same network as the NAS. Did a basic iperf3 -c mynas speeds show about 10G.
Test2. Connected test box to another network (same switch) which would have the test box route through the PFSense box and the speeds dropped. I'll give it that the speeds were still better than my other testing but still considerably lower than without PFSense.
I also checked the CPU graph on PFSense and it was pretty still around the 12% mark during my tests.
Thoughts?
Nas same network:
Through PFSense:
-
Your CPU did sit around 12%, right? What about running "top" and looking for Interrupts etc.? Could be that the buffers, caches, interfaces are maxed out via IRQ handling?
-
Yeah, 12% overall tells us nothing really but that's not miles away from what I expect for that CPU.
Were you able to test with pf disabled?
pfctl -dSteve
-
Hi again,
This time it does look like disabling PF pretty much solved the issue. When I tried before (when testing from PFSense it did not change a thing)
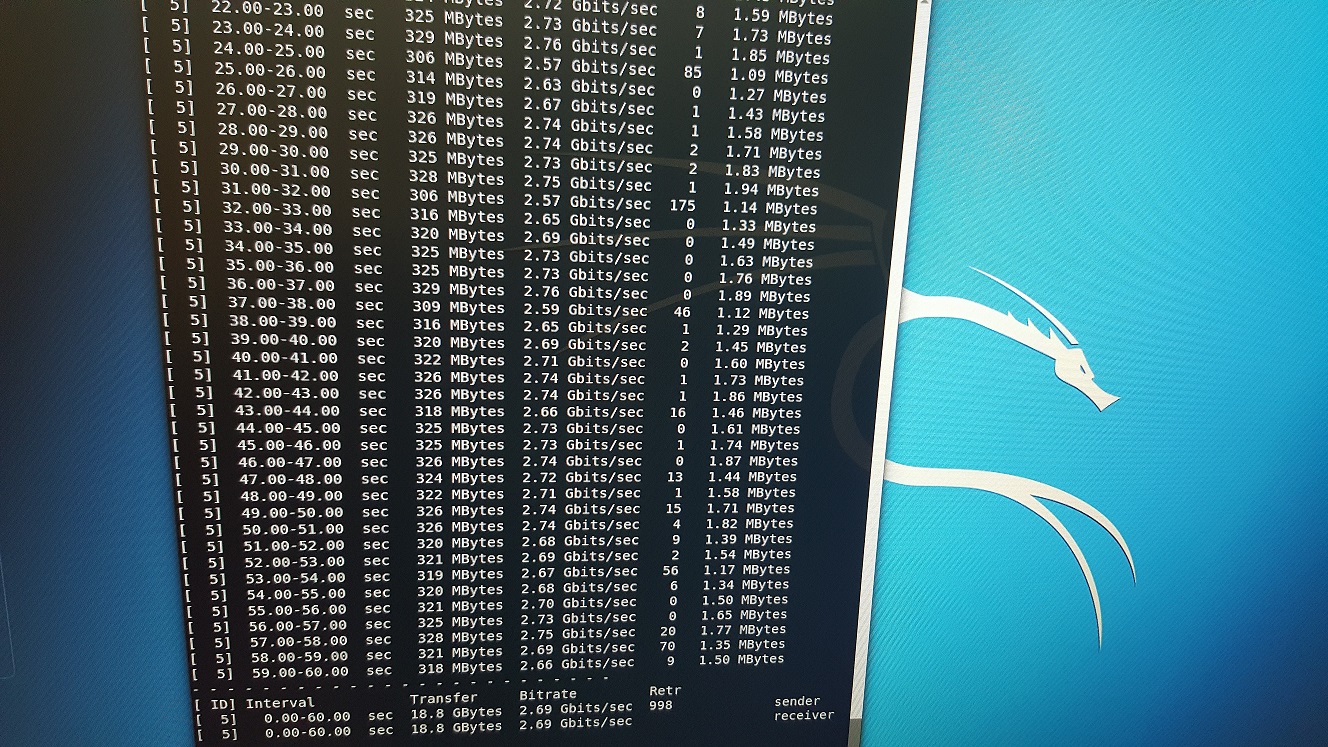
Results with PF enabled:
last pid: 50914; load averages: 1.01, 0.28, 0.09 up 0+22:44:44 16:42:41
375 processes: 19 running, 249 sleeping, 107 waiting
CPU: 0.0% user, 0.0% nice, 2.0% system, 10.6% interrupt, 87.4% idle
Mem: 35M Active, 249M Inact, 484M Wired, 41M Buf, 15G Free
Swap: 3979M Total, 3979M FreePID USERNAME PRI NICE SIZE RES STATE C TIME WCPU COMMAND
11 root 155 ki31 0K 256K CPU15 15 22.7H 100.00% [idle{idle: cpu15}]
11 root 155 ki31 0K 256K CPU11 11 22.7H 100.00% [idle{idle: cpu11}]
11 root 155 ki31 0K 256K RUN 10 22.7H 99.80% [idle{idle: cpu10}]
11 root 155 ki31 0K 256K CPU1 1 22.7H 99.78% [idle{idle: cpu1}]
11 root 155 ki31 0K 256K CPU7 7 22.7H 99.71% [idle{idle: cpu7}]
11 root 155 ki31 0K 256K CPU6 6 22.7H 98.94% [idle{idle: cpu6}]
11 root 155 ki31 0K 256K CPU5 5 22.7H 98.33% [idle{idle: cpu5}]
11 root 155 ki31 0K 256K CPU0 0 22.7H 96.57% [idle{idle: cpu0}]
11 root 155 ki31 0K 256K CPU13 13 22.7H 95.53% [idle{idle: cpu13}]
11 root 155 ki31 0K 256K CPU2 2 22.7H 94.74% [idle{idle: cpu2}]
12 root -72 - 0K 1744K CPU8 8 1:00 92.85% [intr{swi1: netisr 11}]
11 root 155 ki31 0K 256K CPU12 12 22.7H 92.58% [idle{idle: cpu12}]
11 root 155 ki31 0K 256K CPU4 4 22.7H 90.53% [idle{idle: cpu4}]
11 root 155 ki31 0K 256K CPU14 14 22.7H 89.40% [idle{idle: cpu14}]
11 root 155 ki31 0K 256K RUN 3 22.7H 56.39% [idle{idle: cpu3}]
12 root -92 - 0K 1744K CPU3 3 0:14 28.57% [intr{irq310: ix1:q3}]
0 root -92 - 0K 1552K - 13 0:09 22.01% [kernel{ix3:q3}]
12 root -92 - 0K 1744K WAIT 3 0:13 15.01% [intr{irq328: ix3:q3}]
12 root -72 - 0K 1744K WAIT 14 0:12 14.52% [intr{swi1: netisr 12}]
12 root -92 - 0K 1744K WAIT 4 0:05 6.14% [intr{irq329: ix3:q4}]
12 root -92 - 0K 1744K WAIT 4 0:03 3.32% [intr{irq311: ix1:q4}]
0 root -92 - 0K 1552K - 12 0:01 2.74% [kernel{ix1:q3}]
11 root 155 ki31 0K 256K RUN 8 22.7H 2.61% [idle{idle: cpu8}]
32 root -16 - 0K 16K - 15 7:40 0.28% [rand_harvestq]
80008 root 20 0 9860K 5928K CPU10 10 0:01 0.11% top -aSH
12 root -72 - 0K 1744K WAIT 1 1:26 0.10% [intr{swi1: netisr 6}]
0 root -92 - 0K 1552K - 7 0:00 0.09% [kernel{ix1:q4}]
12 root -92 - 0K 1744K WAIT 6 1:04 0.08% [intr{irq313: ix1:q6}]
12 root -60 - 0K 1744K WAIT 0 0:41 0.04% [intr{swi4: clock (0)}]
12 root -92 - 0K 1744K WAIT 6 0:24 0.03% [intr{irq331: ix3:q6}]
9081 root 20 0 50912K 33804K nanslp 13 0:22 0.02% /usr/local/bin/php -f /usr/l
74004 root 20 0 9464K 6288K select 11 0:04 0.02% /usr/local/sbin/miniupnpd -f
31 root -16 - 0K 16K pftm 14 0:12 0.02% [pf purge]
73853 root 20 0 12904K 8152K select 7 0:00 0.01% sshd: admin@pts/0 (sshd)
12 root -72 - 0K 1744K WAIT 7 0:34 0.01% [intr{swi1: netisr 0}]
17045 dhcpd 20 0 12576K 8524K select 5 0:05 0.01% /usr/local/sbin/dhcpd -user
63118 root 20 0 6600K 2364K bpf 11 0:02 0.01% /usr/local/sbin/filterlog -i
21342 root 20 0 6900K 2444K nanslp 4 0:03 0.01% [dpinger{dpinger}]
12 root -72 - 0K 1744K WAIT 11 0:05 0.01% [intr{swi1: netisr 3}]
25 root -68 - 0K 80K - 11 0:02 0.00% [usb{usbus0}]
12 root -72 - 0K 1744K WAIT 10 0:07 0.00% [intr{swi1: netisr 9}]
21239 root 20 0 6900K 2444K nanslp 11 0:04 0.00% [dpinger{dpinger}]
12 root -88 - 0K 1744K WAIT 13 0:02 0.00% [intr{irq297: xhci0}]
12 root -92 - 0K 1744K WAIT 0 0:17 0.00% [intr{irq298: ix0:q0}]
96011 root 20 0 6392K 2544K select 7 0:01 0.00% /usr/sbin/syslogd -s -c -c -
25 root -68 - 0K 80K - 13 0:02 0.00% [usb{usbus0}]and
irq264: nvme0 38 0
irq265: nvme0 1756 0
irq266: nvme0 1786 0
irq267: nvme0 1305 0
irq268: nvme0 1290 0
irq269: nvme0 1701 0
irq270: nvme0 1624 0
irq271: nvme0 1310 0
irq272: nvme0 1954 0
irq273: nvme0 2337 0
irq274: nvme0 2399 0
irq275: nvme0 2888 0
irq276: nvme0 2851 0
irq277: nvme0 2944 0
irq278: nvme0 2897 0
irq279: nvme0 2315 0
irq280: nvme0 2348 0
irq297: xhci0 410058 5
irq298: ix0:q0 3057905 37
irq299: ix0:q1 533877 7
irq300: ix0:q2 235685 3
irq301: ix0:q3 367108 4
irq302: ix0:q4 474028 6
irq303: ix0:q5 253455 3
irq304: ix0:q6 261186 3
irq305: ix0:q7 392968 5
irq306: ix0:link 1 0
irq307: ix1:q0 1116057 14
irq308: ix1:q1 1365989 17
irq309: ix1:q2 705360 9
irq310: ix1:q3 875524 11
irq311: ix1:q4 804571 10
irq312: ix1:q5 1401773 17
irq313: ix1:q6 10436614 127
irq314: ix1:q7 284189 3
irq315: ix1:link 3 0
irq325: ix3:q0 2237440 27
irq326: ix3:q1 1483077 18
irq327: ix3:q2 1307394 16
irq328: ix3:q3 2478508 30
irq329: ix3:q4 1207271 15
irq330: ix3:q5 1488009 18
irq331: ix3:q6 8584592 105
irq332: ix3:q7 1970132 24
irq333: ix3:link 8 0
Total 54144694 661Transfer was going at just shy of 3 Gbits/sec.
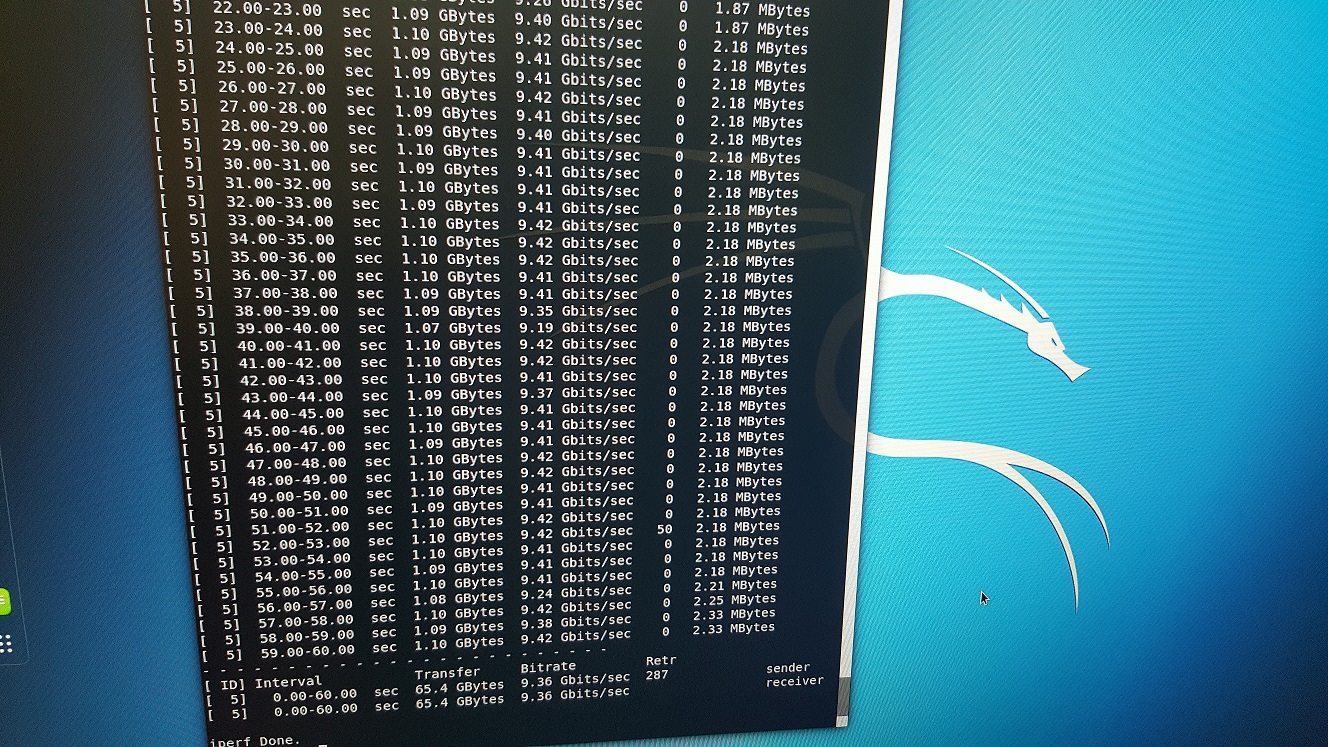
With PF Disabled:
last pid: 16305; load averages: 2.29, 0.79, 0.31 up 0+22:47:27 16:45:24
375 processes: 22 running, 247 sleeping, 106 waiting
CPU: 0.0% user, 0.0% nice, 7.3% system, 12.4% interrupt, 80.3% idle
Mem: 35M Active, 249M Inact, 484M Wired, 41M Buf, 15G Free
Swap: 3979M Total, 3979M FreePID USERNAME PRI NICE SIZE RES STATE C TIME WCPU COMMAND
11 root 155 ki31 0K 256K CPU7 7 22.8H 100.00% [idle{idle: cpu7}]
11 root 155 ki31 0K 256K RUN 1 22.8H 100.00% [idle{idle: cpu1}]
11 root 155 ki31 0K 256K RUN 9 22.8H 100.00% [idle{idle: cpu9}]
11 root 155 ki31 0K 256K CPU14 14 22.8H 100.00% [idle{idle: cpu14}]
11 root 155 ki31 0K 256K CPU3 3 22.8H 100.00% [idle{idle: cpu3}]
11 root 155 ki31 0K 256K CPU15 15 22.8H 100.00% [idle{idle: cpu15}]
11 root 155 ki31 0K 256K CPU10 10 22.7H 100.00% [idle{idle: cpu10}]
11 root 155 ki31 0K 256K CPU2 2 22.8H 99.88% [idle{idle: cpu2}]
11 root 155 ki31 0K 256K CPU8 8 22.7H 99.26% [idle{idle: cpu8}]
11 root 155 ki31 0K 256K CPU11 11 22.7H 99.18% [idle{idle: cpu11}]
11 root 155 ki31 0K 256K CPU4 4 22.8H 94.85% [idle{idle: cpu4}]
0 root -92 - 0K 1552K CPU5 5 0:29 77.98% [kernel{ix3:q6}]
11 root 155 ki31 0K 256K CPU0 0 22.8H 56.52% [idle{idle: cpu0}]
12 root -92 - 0K 1744K CPU6 6 1:22 50.47% [intr{irq313: ix1:q6}]
12 root -92 - 0K 1744K RUN 6 0:40 44.32% [intr{irq331: ix3:q6}]
0 root -92 - 0K 1552K CPU1 1 0:14 41.05% [kernel{ix1:q6}]
11 root 155 ki31 0K 256K RUN 5 22.8H 22.02% [idle{idle: cpu5}]
11 root 155 ki31 0K 256K RUN 6 22.7H 5.19% [idle{idle: cpu6}]
12 root -72 - 0K 1744K WAIT 11 0:07 4.15% [intr{swi1: netisr 4}]
12 root -92 - 0K 1744K WAIT 4 0:08 3.58% [intr{irq329: ix3:q4}]
12 root -92 - 0K 1744K WAIT 4 0:04 1.56% [intr{irq311: ix1:q4}]
32 root -16 - 0K 16K - 15 7:41 0.24% [rand_harvestq]
80008 root 20 0 9860K 5928K CPU9 9 0:01 0.12% top -aSH
12 root -60 - 0K 1744K WAIT 0 0:41 0.04% [intr{swi4: clock (0)}]
9081 root 20 0 50912K 33804K nanslp 9 0:22 0.01% /usr/local/bin/php -f /usr/l
31 root -16 - 0K 16K pftm 9 0:12 0.01% [pf purge]
17045 dhcpd 20 0 12576K 8524K select 3 0:05 0.01% /usr/local/sbin/dhcpd -user
12 root -92 - 0K 1744K WAIT 0 0:03 0.00% [intr{irq307: ix1:q0}]
12 root -92 - 0K 1744K WAIT 0 0:17 0.00% [intr{irq298: ix0:q0}]
12 root -72 - 0K 1744K WAIT 15 0:34 0.00% [intr{swi1: netisr 0}]
12 root -72 - 0K 1744K WAIT 3 0:15 0.00% [intr{swi1: netisr 12}]
12 root -72 - 0K 1744K WAIT 9 0:05 0.00% [intr{swi1: netisr 3}]
12 root -92 - 0K 1744K WAIT 7 0:01 0.00% [intr{irq314: ix1:q7}]
73853 root 20 0 12904K 8152K select 9 0:00 0.00% sshd: admin@pts/0 (sshd)
12 root -92 - 0K 1744K WAIT 2 0:03 0.00% [intr{irq309: ix1:q2}]
12 root -72 - 0K 1744K WAIT 9 0:17 0.00% [intr{swi1: netisr 7}]
39700 root 20 0 12396K 12500K select 11 0:03 0.00% /usr/local/sbin/ntpd -g -c /
21342 root 20 0 6900K 2444K nanslp 11 0:03 0.00% [dpinger{dpinger}]
12 root -92 - 0K 1744K WAIT 7 0:07 0.00% [intr{irq332: ix3:q7}]
12 root -92 - 0K 1744K WAIT 3 0:21 0.00% [intr{irq310: ix1:q3}]
12 root -72 - 0K 1744K WAIT 14 0:10 0.00% [intr{swi1: netisr 10}]
21239 root 20 0 6900K 2444K nanslp 8 0:04 0.00% [dpinger{dpinger}]
12 root -92 - 0K 1744K WAIT 3 0:16 0.00% [intr{irq328: ix3:q3}]
12 root -92 - 0K 1744K WAIT 3 0:01 0.00% [intr{irq301: ix0:q3}]
12 root -72 - 0K 1744K WAIT 8 1:21 0.00% [intr{swi1: netisr 11}]
12 root -92 - 0K 1744K WAIT 1 0:07 0.00% [intr{irq308: ix1:q1}]irq264: nvme0 38 0
irq265: nvme0 1756 0
irq266: nvme0 1786 0
irq267: nvme0 1319 0
irq268: nvme0 1292 0
irq269: nvme0 1701 0
irq270: nvme0 1624 0
irq271: nvme0 1310 0
irq272: nvme0 1954 0
irq273: nvme0 2337 0
irq274: nvme0 2399 0
irq275: nvme0 2893 0
irq276: nvme0 2858 0
irq277: nvme0 2953 0
irq278: nvme0 2904 0
irq279: nvme0 2328 0
irq280: nvme0 2348 0
irq297: xhci0 410913 5
irq298: ix0:q0 3060010 37
irq299: ix0:q1 534209 7
irq300: ix0:q2 235971 3
irq301: ix0:q3 367643 4
irq302: ix0:q4 474321 6
irq303: ix0:q5 254219 3
irq304: ix0:q6 261486 3
irq305: ix0:q7 393224 5
irq306: ix0:link 1 0
irq307: ix1:q0 1116938 14
irq308: ix1:q1 1366999 17
irq309: ix1:q2 705991 9
irq310: ix1:q3 1236071 15
irq311: ix1:q4 1710850 21
irq312: ix1:q5 1402452 17
irq313: ix1:q6 10513709 128
irq314: ix1:q7 284515 3
irq315: ix1:link 3 0
irq325: ix3:q0 2238196 27
irq326: ix3:q1 1483548 18
irq327: ix3:q2 1307672 16
irq328: ix3:q3 2655931 32
irq329: ix3:q4 2160437 26
irq330: ix3:q5 1488095 18
irq331: ix3:q6 8686297 106
irq332: ix3:q7 1970487 24
irq333: ix3:link 8 0
Total 57117188 696I saw speeds just over 9 Gits/sec
So now the question is how can I use PFSense (PF) without causing it to throttle my connections? If I'm reading the above stats correctly it still looks like most of my cores are not being used.
Cheers!