High Memory Usage
-
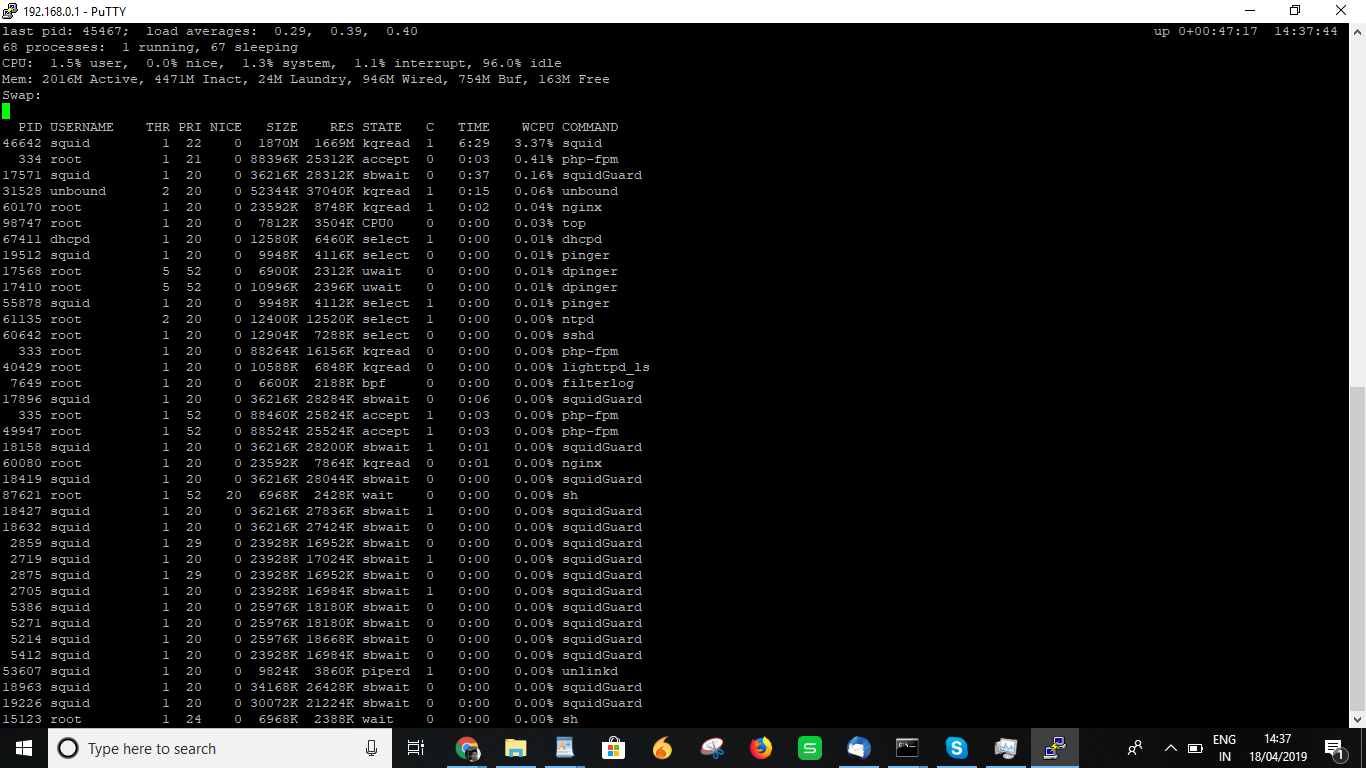
Hi , I Have 8Gb ram in my pfsense and its basically just for squid proxy . but squid memory usage is very high upto 100% and because of high memory usage my pfsense is stuck.
Here i mention pfsense system acitivty monitor logs and find attachment of top :-last pid: 6278; load averages: 0.33, 0.48, 0.43 up 0+00:44:31 14:34:58
159 processes: 3 running, 139 sleeping, 17 waitingMem: 2014M Active, 4466M Inact, 24M Laundry, 946M Wired, 754M Buf, 170M Free
Swap:PID USERNAME PRI NICE SIZE RES STATE C TIME WCPU COMMAND
11 root 155 ki31 0K 32K CPU1 1 35:41 95.75% [idle{idle: cpu1}]
11 root 155 ki31 0K 32K RUN 0 36:56 95.65% [idle{idle: cpu0}]
46642 squid 24 0 1870M 1667M kqread 1 6:10 6.49% (squid-1) -f /usr/local/etc/squid/squid.
17571 squid 20 0 36216K 28312K sbwait 0 0:35 0.29% (squidGuard) -c /usr/local/etc/squidGuar
0 root -16 - 0K 272K swapin 0 0:24 0.00% [kernel{swapper}]
12 root -92 - 0K 272K WAIT 1 0:21 0.00% [intr{irq267: re2}]
12 root -92 - 0K 272K WAIT 1 0:17 0.00% [intr{irq266: re1}]
31528 unbound 20 0 50296K 36792K kqread 0 0:07 0.00% /usr/local/sbin/unbound -c /var/unbound/
31528 unbound 20 0 50296K 36792K kqread 0 0:07 0.00% /usr/local/sbin/unbound -c /var/unbound/
12 root -88 - 0K 272K WAIT 0 0:06 0.00% [intr{irq19: atapci0+}]
17896 squid 20 0 36216K 28284K sbwait 0 0:06 0.00% (squidGuard) -c /usr/local/etc/squidGuar
5 root -16 - 0K 32K - 1 0:04 0.00% [cam{scanner}]
335 root 20 0 88460K 25824K piperd 0 0:03 0.00% php-fpm: pool nginx (php-fpm)
12 root -60 - 0K 272K WAIT 1 0:03 0.00% [intr{swi4: clock (0)}]
49947 root 52 0 88524K 25524K accept 0 0:03 0.00% php-fpm: pool nginx (php-fpm)
334 root 52 0 88396K 25312K accept 0 0:03 0.00% php-fpm: pool nginx (php-fpm)
5 root -16 - 0K 32K - 1 0:03 0.00% [cam{doneq0}]
60170 root 20 0 23592K 8748K kqread 1 0:02 0.00% nginx: worker process (nginx)top logs:-

-
How big is your disk cache?
The larger your disk cache the more RAM will be used:
https://wiki.squid-cache.org/SquidFaq/SquidMemory
-
Hi @chrismacmahon ,
Thanks for reply . Here i attach a file of my local cache configuration you can check . In this Hard Disk cache size is 2000 MB & Squid memory cache size is 128 MB. Please check once my attachment and Please provide me solution for this. I would be very thankful to you.

-
Without being an expert on FreeBSD, here's what I see:
You have 4.5GB of your RAM available. (Actually more as you can also count Buffer RAM usage) Inactive memory is memory that has been used but hasn't been freed. It will be freed when it is needed but BSD leaves it in there in case you need it called again. In Windows it's called Cached instead of Inact. You could essentially add your Inactive and Free Memory to find out how much memory is not in use. Squid only looks like it's using 1.7GB so I think that's accuracte. Try pressing "o" to sort and using the argument of "res" to sort by RAM usage. Once you sort you'll see the same PID duplicated but the RES only counts once. I think that has to do with spawned threads.
What's actually happening?
-
Yes, I'm not actually seeing an issue there besides the high RAM usage from Squid. It's not exhausting the RAM certainly.
Are you seeing errors in the system log or Squid log?
Steve