DNS Resolver not caching correct?
-
Hi!
I'm using pfSense 2.4.4-p3 and unbound for DNS resolver. It's all pretty standard config and works fine. But the caching seems not to work properly. If I dig twitter.com it shows:
; <<>> DiG 9.12.2-P1 <<>> twitter.com ;; global options: +cmd ;; Got answer: ;; ->>HEADER<<- opcode: QUERY, status: NOERROR, id: 17274 ;; flags: qr rd ra; QUERY: 1, ANSWER: 1, AUTHORITY: 0, ADDITIONAL: 1 ;; OPT PSEUDOSECTION: ; EDNS: version: 0, flags:; udp: 4096 ;; QUESTION SECTION: ;twitter.com. IN A ;; ANSWER SECTION: twitter.com. 30 IN A 104.244.42.1 ;; Query time: 118 msec ;; SERVER: 127.0.0.1#53(127.0.0.1) ;; WHEN: Wed Aug 28 21:26:38 CEST 2019 ;; MSG SIZE rcvd: 56
A second dig will show 0 ms:
; <<>> DiG 9.12.2-P1 <<>> twitter.com ;; global options: +cmd ;; Got answer: ;; ->>HEADER<<- opcode: QUERY, status: NOERROR, id: 9091 ;; flags: qr rd ra; QUERY: 1, ANSWER: 2, AUTHORITY: 0, ADDITIONAL: 1 ;; OPT PSEUDOSECTION: ; EDNS: version: 0, flags:; udp: 4096 ;; QUESTION SECTION: ;twitter.com. IN A ;; ANSWER SECTION: twitter.com. 1797 IN A 104.244.42.193 twitter.com. 1797 IN A 104.244.42.129 ;; Query time: 0 msec ;; SERVER: 127.0.0.1#53(127.0.0.1) ;; WHEN: Wed Aug 28 21:34:15 CEST 2019 ;; MSG SIZE rcvd: 72
Now if I wait only a few seconds or maybe a minute and dig again, it takes more than 0ms and forwards to root servers. Why?
-
The TTL for twitter.com is 1 minute.
-
How did you get that and? In the DNS resolver options the caching time is set to 15 mins.
-
The TTL for a DNS record is set by the authoritative server, not you.
-
So no way to cache longer? With that unbound is slower than forwarding. To cloudflare or google I get 8 ms to the root servers up to 150 ms.
-
@mrsunfire said in DNS Resolver not caching correct?:
So no way to cache longer? With that unbound is slower than forwarding. To cloudflare or google I get 8 ms to the root servers up to 150 ms.
Millions are hitting the same DNS when you use forwarding to a data-collector like Cloudfare.
That's their big advantage.
But even when you forward to Cloudfare, it will resolve for you - some one will take the xx msec, and then the IP will stay in their cache for the duration of the TTL.Btw : @KOM as shown above, twitter.com last for about 1800 sec == 30 minutes. At least, for me - and @mrsunfire.
180 msec isn't very fast. My query time is more like 45 msec when hitting the root server road.
-
You can set the min TTL time in unbound.
Please be aware of this - it could cause you issues.. I have never seen any, but it could keep you talking to an outdated IP for an hour longer then you should be, etc. Say if the site owner was switching to new IP, etc. But I have yet to see any issue.. I wouldn't set it too high, but not a fan of the very short TTLs like 5 minutes and shit.
To help you can also setup prefetch.
I would really suggest you understand what these are doing before enabling them.. They should not cause you any issues either.. In a nutshell, what they do is renew a cache for an item, if someone asks unbound for it, and the TTL is close to expiring.
And the serve 0, will answer a query for something that has actually expired, and then go update it. This could cause you problems if your setting the min ttl to somethiing other than what the owner has set on their records.. But again I have not seen any issues with doing it.
Again - suggest you research what they actually do, and understand that they could cause you issues, so if you run into any issues you understand that you have made these changes so you can look into if that is the problem your experiencing at some point.
edit: BTW the TTL for twitter.com is 1800 seconds or 30 minutes.. You can find that by just doing a query direct to an authoritative NS for that domain.. Say the SOA for example
;; QUESTION SECTION: ;twitter.com. IN A ;; ANSWER SECTION: twitter.com. 1800 IN A 104.244.42.129 twitter.com. 1800 IN A 104.244.42.193 ;; AUTHORITY SECTION: twitter.com. 13999 IN NS d.r06.twtrdns.net. twitter.com. 13999 IN NS d01-01.ns.twtrdns.net. twitter.com. 13999 IN NS ns3.p34.dynect.net. twitter.com. 13999 IN NS b.r06.twtrdns.net. twitter.com. 13999 IN NS d01-02.ns.twtrdns.net. twitter.com. 13999 IN NS ns1.p34.dynect.net. twitter.com. 13999 IN NS a.r06.twtrdns.net. twitter.com. 13999 IN NS ns2.p34.dynect.net. twitter.com. 13999 IN NS c.r06.twtrdns.net. twitter.com. 13999 IN NS ns4.p34.dynect.net. ;; Query time: 32 msec ;; SERVER: 208.78.70.26#53(208.78.70.26) ;; WHEN: Thu Aug 29 05:23:29 Central Daylight Time 2019 ;; MSG SIZE rcvd: 279
-
@Gertjan said in DNS Resolver not caching correct?:
@mrsunfire said in DNS Resolver not caching correct?:
So no way to cache longer? With that unbound is slower than forwarding. To cloudflare or google I get 8 ms to the root servers up to 150 ms.
Millions are hitting the same DNS when you use forwarding to a data-collector like Cloudfare.
That's their big advantage.
But even when you forward to Cloudfare, it will resolve for you - some one will take the xx msec, and then the IP will stay in their cache for the duration of the TTL.Btw : @KOM as shown above, twitter.com last for about 1800 sec == 30 minutes. At least, for me - and @mrsunfire.
180 msec isn't very fast. My query time is more like 45 msec when hitting the root server road.
Bur why is unbound showing not 0 ms after 10-20 seconds agsin? It seems the TTK is much shorter for me?
I habe prefetch support enabled.
-
if you query something, back to back you can see the ttl count down..
;; ANSWER SECTION:
twitter.com. 3600 IN A 104.244.42.65
twitter.com. 3600 IN A 104.244.42.193;; ANSWER SECTION:
twitter.com. 3598 IN A 104.244.42.193
twitter.com. 3598 IN A 104.244.42.65;; ANSWER SECTION:
twitter.com. 3596 IN A 104.244.42.65
twitter.com. 3596 IN A 104.244.42.193then a a bit later
;; ANSWER SECTION:
twitter.com. 3472 IN A 104.244.42.193
twitter.com. 3472 IN A 104.244.42.65edit: If your seeing it have to go query for it again, before the ttl has expired - maybe you restarted unbound!! Say if you have it registering dhcp, every time new dhcp lease it will restart unbound and you will lose your cache.
A restart of unbound will clear the cache.
You can look at status to see how long its been up
[2.4.4-RELEASE][admin@sg4860.local.lan]/: unbound-control -c /var/unbound/unbound.conf status
version: 1.9.1
verbosity: 1
threads: 4
modules: 2 [ validator iterator ]
uptime: 41538 seconds
options: control(ssl)
unbound (pid 43528) is running... -
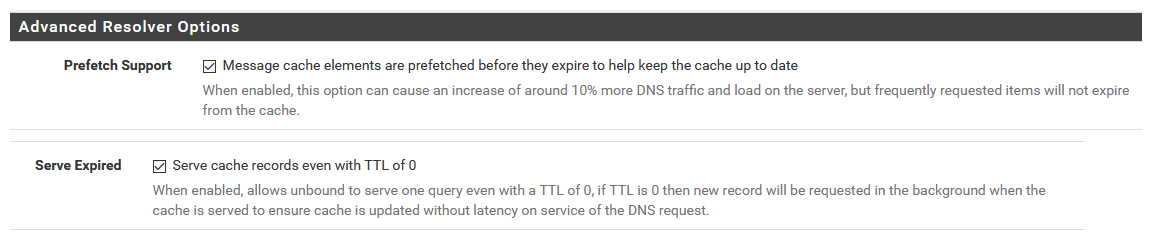
What about the option „Serve Expired“? This should cache even with TTL 0.
-
Not if the cache has been wiped because unbound has restarted.
Users that have issues with unbound, is normally related to it being restarted all the time - register dhcp reservations, and they have lots of them happening all the time. Or say pfblocker restarting it, etc.
Every time unbound restarts the cache is flushed.
-
And there your have it :
@johnpoz said in DNS Resolver not caching correct?:maybe you restarted unbound!! Say if you have it registering dhcp, every time new dhcp lease it will restart unbound and you will lose your cache.
A restart of unbound will clear the cache.Not a real issue, but very few people are aware of this.
Running pfSense with default settings, depending on the number of clients on LAN, will increase DHCP requests.
When registering a new lease, the DHCP daemon will kick (restart) the DNS cache = unbound. Which implies : cache lost.Solution : do nothing with your devices.
Declare static DHCP entries as much as possible on your LAN(s) using their MAC address.
When done, remove this check :edit : true, other processes can also restart unbound. pfBlocker might be one of them.
The DNS logs will tell you how often it restarts. -
do this command
unbound-control -c /var/unbound/unbound.conf stats_noreset | grep rrset.cacheWhat do you show for records in your cache... Then restart unbound and do it again
before restart
rrset.cache.count=8549Then restarted and looked a few moments later
[2.4.4-RELEASE][admin@sg4860.local.lan]/: unbound-control -c /var/unbound/unbound.conf stats_noreset | grep rrset.cache
rrset.cache.count=736It has already started buiding up cache because things on network are always doing queries - but on a restart of unbound the cache is flushed.
You can also look at the infra cache value
infra.cache.count=5194That was before, and then after restart
infra.cache.count=621So yes if unbound is restarting often, you loose the cache.. And then stuff has to be resolved again.
-
@johnpoz Thanks, John. I didn't know that unbound could override the default TTL from an authoritative server.
-
I wouldn't suggest normal people do it ;) But if your fully aware of how dns actually works - and your sick of seeing queries for shit because they have a ridiculous low ttl.. 60 freaking seconds - give me a gawd damn break! ;) And I wouldn't suggest you set it too high.. An hour to me seems like a good min ttl for those that are under.. 60 seconds, 5 minutes, etc. Those are just too freaking low unless your about to switch to different IP, etc.
I think the amazon dns defaults to that on purpose to be honest, because they want more queries because they charge you per query ;) hehehe
I get it cdn stuff can move around - but put the shit behind some load balancers for freak sake vs such low ttls..
Altering the min ttl, can lead to issues - so you should be well aware of what your doing before you change it.. And know how to troubleshoot if that is what might be causing you some issue you run into.
Not going to help if your cache keeps getting cleared ;) which I would guess is the OP problem
edit: The other thing that ticks me a off is the lack of local cache for most of these iot devices.. Since they have no local cache every time they want to look up something, which can be every freaking minute - they have to do a query for it, so for local queries doesn't matter how high the ttl is. They normally only looking for a couple of things, so the local cache doesn't have to be large - shit cache say 10 records or something, running a min local cache can be done with almost zero resources.. etc.
Synology nas is like this, so I installed the dns package - just so I could point it to itself for dns (127.0.0.1) so its not doing a query every time it needs to look up something. It now has its own local cache. And only forwards to pfsense when something is not in its local cache.
Same thing goes for the usg from unifi.. It runs no local cache.. stupid ass shit!
-
@johnpoz said in DNS Resolver not caching correct?:
unbound-control -c /var/unbound/unbound.conf stats_noreset | grep rrset.cache
I don't have the DHCP registration option set because I use static DHCP entries. My unbound doesn't restart. Well today it does because I changed something in the settings.
unbound-control -c /var/unbound/unbound.conf stats_noreset | grep rrset.cache
shows me
rrset.cache.count=3875
If I use a client to connect to twitter.com and shortly after do a dig twitter.com it also shows me 15 ms or more. Shouldn't be there 0ms because the client already asked for that query? Before that I cleared my DNS cache on that client.
I think I can enable the option "Server Expired" or is this a problem?
How can I see all entries that are cached?
-
And maybe its 15ms because that is how long it took to query it from cache.. That seems like a really fast response all the way from roots.. Once unbound has looked up say host.domain.tld, and then it looks for otherhost.domaint.tld it will already have the authoritative ns cached, and only has to ask them directly and not walk down from roots.
You need to validate via the run time query I did above to see how long unbound has been running, there are other things that can reload it.. For example pfblocker.
you can lookup specifics, or dump the whole cache if you would.
dump_cache The contents of the cache is printed in a text format to stdout. You can redirect it to a file to store the cache in a file.
Use the lookup command and it will tell you what is cached for that and what it would use to lookup something.
Or you can just grep in the full cache for some specific record.
[2.4.4-RELEASE][admin@sg4860.local.lan]/: unbound-control -c /var/unbound/unbound.conf dump_cache | grep www.google.com www.google.com. 1275 IN A 172.217.1.36 msg www.google.com. IN A 32896 1 1275 3 1 0 0 www.google.com. IN A 0 [2.4.4-RELEASE][admin@sg4860.local.lan]/:
So in there you can see what the TTL is in the cache, and that it has a 0 set so it will respond even if the other cache entry .
unbound will return from cache, unless that entry has been flushed, or the whole cache has been flushed. 15 ms sure seems pretty quick for a full resolve from roots. So either it only talked to the authoritative server it already had cached, or it served it up from cache and it was a bit slow doing that.
Do looking up specific entries per the above command example will show you if the record is in cache, and what is left on the ttl, etc.
-
@johnpoz said in DNS Resolver not caching correct?:
unbound-control -c /var/unbound/unbound.conf dump_cache | grep www.google.com
If it's cached, it's always 0 ms. I think PCI-E SSD and Core i7 should be fast enough :)
I will test around a bit and see if its better now with the Serve expired setting.
www.google.com. 243 IN A 172.217.21.196 www.google.com. 243 IN AAAA 2a00:1450:4001:808::2004 msg www.google.com. IN A 32896 1 243 3 1 0 0 www.google.com. IN A 0 msg www.google.com. IN AAAA 32896 1 243 3 1 0 0 www.google.com. IN AAAA 0
-
I worded that a bit wrong, I meant that I have reply with 0 ttl set, and still shows in the cache, etc. with the ttl counting down. Bad wording on my part.
Example of the ttl counting down
www.cnn.com. 3595 IN CNAME turner-tls.map.fastly.net. msg www.cnn.com. IN A 32896 1 3595 3 2 1 0 www.cnn.com. IN CNAME 0 [2.4.4-RELEASE][admin@sg4860.local.lan]/: unbound-control -c /var/unbound/unbound.conf dump_cache | grep www.cnn.com www.cnn.com. 3496 IN CNAME turner-tls.map.fastly.net. msg www.cnn.com. IN A 32896 1 3496 3 2 1 0 www.cnn.com. IN CNAME 0 [2.4.4-RELEASE][admin@sg4860.local.lan]/:
What I would do is say query for something with a short ttl.. Say 60 seconds or something... Now just keep doing that query every couple seconds.. Do you get fast response? you see the ttl counting down.. You should see responses in 1 or 2 ms..
-
After some hours I came back home and test again some names and now they show me all 0ms. I think the option Serve expering option solved my problem. Even twitter.com now resolves with 0 ms after 3 hours.
-
Maybe I missed something in the dozen+ posts on this topic, but why does it matter? 0ms vs 12ms is barely noticeable and it only applies to lookups.
-
0 vs 12 is not an issues.. But serving up say something via cache in 0ms or 12ms from cache can make make a difference vs say 500ms having to resolve it..
Much of it more of a tech thing vs hey I can notice its slower thing as well ;) Even if going to site xyz took 500ms to resolve its unlikely someone could actually notice the page loading slower if its was .5 seconds slower..
It can be hey I query this from cmd line why does it take 500ms when it should be cache local and be 1ms..
In the big picture I think resolving is the better solution, as long as your cache is working as it should - users are never going to notice anything. And you are now getting the info from the horses mouth so to speak.. And in the long run you can end up doing less queries since your always going to get the full ttl from the authoritative ns vs something that was cached, and you only got a partial ttl and had to do another query later, to only get again a less than full ttl. So while your query might be a few ms shorter, your going to end up doing more queries in the long run..
To actually make a decision you would have to do some real analysis on on your overall types of queries and amount of queries and the ttls you are getting back from if you forward, vs resolving, etc. But normally resolving is going to be the better option. But there are always going to be one offs.. Most users don't understand how it all works, and it comes down to I ask google for host.domain.tld and get an answer in X ms, vs I resolve it and get it Y ms.. where X<Y the gut reaction is forwarding is better.. When in the big picture its prob not.
-
Got it.
-
I could talk about this stuff for hours and hours and hours ;) Its a bit of a hobby/passion with me - my dream job would be just dealing with dns all day.. Vs now only now and then ;) I had a cool project a while back trying to host over 3000 some domains for a major player, etc. Trying to explain to them how its not worth it to try and do such a thing on your own - and how its not cost effective for the bandwidth required and the equipment required and how you can not do it from only 2 locations and provide actually good service - that it needs to be global, etc..
It was a fun project even though it came to nothing in the long run and they hosted it elsewhere - and prob cost my company money.. Not a business we wanted to get it hosting dns, when there are majors with global anycast networks that just better to host with them, etc.
I will say this, I would never go back to forwarding my queries anywhere... I will run a resolver on my own thank you very much.. It gives me the control and the info to do what I want, how I want to do it vs just sending all my queries to X and trusting their responses.. But that could just be me, others are very happy just asking x.x.x.x for host.domain.tld and being happy with what they get back.. That is not what I want - and I would think most people that have taken the step to moving to pfsense vs your off the shelf soho router like that ability as well.
Then can run a resolver, they can forward, they can run a full blown bind with a nice gui if they want, etc. This is one of the best things about pfsense - gives you options!!! And the ability to use such options without having to dive into the nitty gritty of conf files..
Sorry for the rant - but I love this topic, and I am like 6 beers in already.. Stopped for a few after work with a buddy ;)
-
@KOM said in DNS Resolver not caching correct?:
Maybe I missed something in the dozen+ posts on this topic, but why does it matter? 0ms vs 12ms is barely noticeable and it only applies to lookups.
Because more than 0ms shows that its fordwarding too root servers and not resolving from cache. Thats the reason I use unbound.
@johnpoz
I can follow you. I also don‘t want any other resolving my names. I want to make the most I can my self. Thats why I‘m running a home server and pfSense. -
I doubt 12 is from roots, from the authoritative ns ok.. But if your walking all the way down from roots in 12 ms.. Gawd damn that would be freaking quick ;)
Keep in mind that once you have looked up NS for say .com those are cached and do not have to ask "." again.. Just need to ask them for ns of domain.com.
And once the ns are cached for domain.com, I don't have to talk to them again.. just the ns for domain.com asking for host.domain.com
So if the specific record has ttl expired, or has never been looked up before - just have to directly talk to ns for domain.com and ask for host.domain.com
My guess on 12 ms vs 1-2ms response would either be slowing responding cache? Or just had to talk to a close authoritative ns for domain.com.. Maybe unbound was busy is why it took 12 ms vs typical 1 or 2ms? Maybe the ttl on this record is a stupid 60 seconds or something.
-
If its from cache its always 0ms. I sniffed the traffic to check that.
-
If your local to the cache ok, but your not always going to see 0 ms if your client on the network.. Even a local lan introduces some delay ;) Or some small delay with cache answering
;; ANSWER SECTION:
www.google.com. 3346 IN A 172.217.1.36;; Query time: 0 msec
;; SERVER: 192.168.9.253#53(192.168.9.253)
;; WHEN: Fri Aug 30 04:32:20 Central Daylight Time 2019Next query
;; ANSWER SECTION:
www.google.com. 3344 IN A 172.217.1.36;; Query time: 1 msec
;; SERVER: 192.168.9.253#53(192.168.9.253)
;; WHEN: Fri Aug 30 04:32:22 Central Daylight Time 2019My point is it is possible to see a delay in the response time, even from when cache.
It could be possible, even if your local to the cache - to see a delay if machine is busy, or unbound is busy, etc. etc. Just because you see some small amount of delay does not mean it wasn't served from cache.
If you get back anything other than the full ttl - it was served from cache.
If your doing query over wireless - that could also introduce delay.. Or if your path to the dns is routed/firewalled locally, etc. A better indication of served from cache or resolved would be the ttl you get back
When your seeing this 12ms response - what was the ttl returned?
-
I never saw more than 30% cpu usage and never more than 0ms. How can I check that better?
Where do I see the ttl? I will check that again.
-
when you do a dig, you will see the ttl
;; ANSWER SECTION:
www.google.com. 1038 IN A 172.217.1.36See the 1038, that is the TTL returned, clearly that is not the full TTL of that record.. Nobody would set such an ODD ttl ;)
So it was clearly returned from cache. If you see a whole number, 60, 300, 1800, 3600, 86400 for example than that was resolved and you received the full ttl from the authoritative ns. You can always check what the full ttl is by doing a query direct to one of the authoritative NS for that domain.
Mind you, I have a min ttl set of 3600 on my unbound... So if ttl from authoritative ns is less than 3600, unbound will use 3600.. But it will then count down from that, so if I see 3600 returned as the ttl - pretty sure it was resolved, vs from cache.. Unless on the off chance you did the query at exactly when the ttl had counted down to that value ;) So while you might see a whole number - it still could of been from cache - you just got amazing lucky and queried exactly when say the ttl had counted down t 1800 ;)
So if your delay is something other than a couple of ms, and you have a nice whole number ttl - you can be pretty sure it was resolved, and not returned.. Even if you see say 12 ms, but the ttl was like 1432 or something - you would assume that was returned to you from cache - and something else caused the delay.
edit:
Another stat you might be interested in is the cache hit numbers..[2.4.4-RELEASE][admin@sg4860.local.lan]/root: unbound-control -c /var/unbound/unbound.conf stats_noreset | grep total.num total.num.queries=14557 total.num.queries_ip_ratelimited=0 total.num.cachehits=12593 total.num.cachemiss=1964 total.num.prefetch=2263 total.num.zero_ttl=2318 total.num.recursivereplies=1964
So you can see the total numbers of queries that unbound has gotten since its last restart.. And the total number of hits for the cache.. And how many misses, how many prefetches done, etc. how many returns from 0 ttl (since I have that set) etc.. If your not seeing a large % of cache hits.. then yeah your doing more resolving than returning from cache.. I am pretty happy with 86% cache hit ratio.
Means 86% of the time when a client asked for something - it got returned from cache vs having to resolve it.
edit: People seem to miss the whole point of the cache.. To the local client if you record is returned from cache its going to be couple of ms to lookup whatever.domain.tld, so what does it matter if resolving takes 100ms and just asking google takes 30ms.. Once its cache, your client will be seeing 1ms..
In the big picture resolving can be faster and better because while you have to ask googledns all the time for something that is not in cache, and that might be 30ms (if they have it cached).. Your resolve might only take 15ms to ask the authoritative ns for the record.. All depends on where the authoritative ns is in relation to you, etc. And since your always going to get back the full TTL, you could need to do actual less queries than always asking googledns..
The only time forwarding gains you anything is if they already have it cached.. If your asking for something that is not.. Then it has to be resolved, and you just added the query time to googledns, and then waiting for them to resolve it on top of the time of your latency to them, etc. So what you save a handful of ms here and there? Nobody is going to notice the difference between getting an answer in 30ms vs 200 ;) and that only every comes into play if not already cached anyway.. So 1 of your clients might have to wait couple extra ms for something to be resolved, everyone else on your network will get the cached copy. And if your doing prefetch - the common domains will be kept active with nobody ever seeing the few ms delay to actually resolve it.
If you have the ability to run your own resolver - its just always a better option if you ask me.
here.. I resolved this locally in 139 ms
; <<>> DiG 9.14.4 <<>> www.whatever.com ;; global options: +cmd ;; Got answer: ;; ->>HEADER<<- opcode: QUERY, status: NOERROR, id: 15212 ;; flags: qr rd ra; QUERY: 1, ANSWER: 2, AUTHORITY: 0, ADDITIONAL: 1 ;; OPT PSEUDOSECTION: ; EDNS: version: 0, flags:; udp: 4096 ;; QUESTION SECTION: ;www.whatever.com. IN A ;; ANSWER SECTION: www.whatever.com. 14400 IN CNAME whatever.com. whatever.com. 14400 IN A 198.57.151.250 ;; Query time: 139 msec ;; SERVER: 192.168.3.10#53(192.168.3.10) ;; WHEN: Fri Aug 30 05:49:31 Central Daylight Time 2019 ;; MSG SIZE rcvd: 75
I asked googledns for it - and took 99ms
; <<>> DiG 9.14.4 <<>> @8.8.8.8 www.whatever.com ; (1 server found) ;; global options: +cmd ;; Got answer: ;; ->>HEADER<<- opcode: QUERY, status: NOERROR, id: 49654 ;; flags: qr rd ra; QUERY: 1, ANSWER: 2, AUTHORITY: 0, ADDITIONAL: 1 ;; OPT PSEUDOSECTION: ; EDNS: version: 0, flags:; udp: 512 ;; QUESTION SECTION: ;www.whatever.com. IN A ;; ANSWER SECTION: www.whatever.com. 14399 IN CNAME whatever.com. whatever.com. 14399 IN A 198.57.151.250 ;; Query time: 99 msec ;; SERVER: 8.8.8.8#53(8.8.8.8) ;; WHEN: Fri Aug 30 05:50:07 Central Daylight Time 2019 ;; MSG SIZE rcvd: 75
So you think a client could ever notice 40 whole ms?? .04 of second ;)
And that is only the first client to ask for it, after that its just served from cache.
-
Thank you very much for your help! Keep up the good work.
It helped me a lot to understand the ttl. If I get 0ms its not a whole number:
; <<>> DiG 9.12.2-P1 <<>> twitter.com ;; global options: +cmd ;; Got answer: ;; ->>HEADER<<- opcode: QUERY, status: NOERROR, id: 57273 ;; flags: qr rd ra; QUERY: 1, ANSWER: 2, AUTHORITY: 0, ADDITIONAL: 1 ;; OPT PSEUDOSECTION: ; EDNS: version: 0, flags:; udp: 4096 ;; QUESTION SECTION: ;twitter.com. IN A ;; ANSWER SECTION: twitter.com. 1415 IN A 104.244.42.129 twitter.com. 1415 IN A 104.244.42.65 ;; Query time: 0 msec ;; SERVER: 127.0.0.1#53(127.0.0.1) ;; WHEN: Fri Aug 30 16:25:20 CEST 2019 ;; MSG SIZE rcvd: 72
It now works better with my setting yesterday.
These are my hits:
Shell Output - unbound-control -c /var/unbound/unbound.conf stats_noreset | grep total.num total.num.queries=22053 total.num.queries_ip_ratelimited=0 total.num.cachehits=16235 total.num.cachemiss=5818 total.num.prefetch=8910 total.num.zero_ttl=9416 total.num.recursivereplies=5818
I also tested you example and wow, this domain took long:
; <<>> DiG 9.12.2-P1 <<>> www.whatever.com ;; global options: +cmd ;; Got answer: ;; ->>HEADER<<- opcode: QUERY, status: NOERROR, id: 55651 ;; flags: qr rd ra; QUERY: 1, ANSWER: 2, AUTHORITY: 0, ADDITIONAL: 1 ;; OPT PSEUDOSECTION: ; EDNS: version: 0, flags:; udp: 4096 ;; QUESTION SECTION: ;www.whatever.com. IN A ;; ANSWER SECTION: www.whatever.com. 14400 IN CNAME whatever.com. whatever.com. 14400 IN A 198.57.151.250 ;; Query time: 1192 msec ;; SERVER: 127.0.0.1#53(127.0.0.1) ;; WHEN: Fri Aug 30 16:33:41 CEST 2019 ;; MSG SIZE rcvd: 75
Cloudflare was quiet fast:
; <<>> DiG 9.12.2-P1 <<>> @1.1.1.1 www.whatever.com ; (1 server found) ;; global options: +cmd ;; Got answer: ;; ->>HEADER<<- opcode: QUERY, status: NOERROR, id: 12365 ;; flags: qr rd ra; QUERY: 1, ANSWER: 2, AUTHORITY: 0, ADDITIONAL: 1 ;; OPT PSEUDOSECTION: ; EDNS: version: 0, flags:; udp: 1452 ;; QUESTION SECTION: ;www.whatever.com. IN A ;; ANSWER SECTION: www.whatever.com. 14400 IN CNAME whatever.com. whatever.com. 10732 IN A 198.57.151.250 ;; Query time: 175 msec ;; SERVER: 1.1.1.1#53(1.1.1.1) ;; WHEN: Fri Aug 30 16:34:49 CEST 2019 ;; MSG SIZE rcvd: 75
-
@mrsunfire said in DNS Resolver not caching correct?:
;; Query time: 1192 msec
Depends where your at in the world to where the authoritative ns and other root servers are, the latency of your connection, etc. etc.
Keep in mind that example so this had to be resolved to even then resolve that.. So yeah those can be longer.. You can see from your 175ms response - looks like 1 had to be resolved, but the other was cached since you got back 10732 so half of the thing you looked for was cached..
you understand that 1000 ms is 1 second - so not sure I would call that LONG ;) in the big picture.. So your website would of take a whole second longer to load then if the dns had been cached. Which still might be 30 seconds - depending on what the site was, etc. and how fast it is, and your connection to it, etc. And now that its looked up for the next 4 hours your cached.. And if you have prefetch on other clients actually ask for that again it could be refreshed in the background and you would never see such a delay again, etc.
-
@johnpoz 1000 is very long. Usualle my sites load instant. I have around 7 ms to google.de (Germany).
-
@mrsunfire said in DNS Resolver not caching correct?:
I have around 7 ms to google.de (Germany).
The amount of time to ping site has ZERO to do with how fast it loads in your browser -- sorry but site pull up in your browser is not freaking loading in .007 seconds..
Keep in mind that once I site is loaded once - much of it could be cached by your browser as well, etc.
1000 ms to RESOLVE something where the authoritative ns for that domain could be on the other side of the planet is not a LONG time ;)
Your in DE? That is a long way from Utah in the US which is where those NS seem to be.. And that is just those.. that is not the others in the chain..
Do you actually understand how something is resolved?
Even if you had .com NS cached, you still had to go ask them... And how far away are they from you for the NS for whatever.com etc. Then you had to go ask the NS for whatever.com for www.whatever.com, which is then a cname for whatever.com so you then had to do another query, etc. Which if your in DE, and the NS are in Utah.. that going to be a tad higher than 7ms away ;)
Do a dig +trace for that whatever.com to see how you get to it, and how fast the authoritative NS can answer you, etc.
-
Yes it gets more clear for me now, thanks.
Heres the traceroute:
1 37.49.100.1 6.696 ms 6.047 ms 6.332 ms 2 172.30.22.97 6.166 ms 6.018 ms 6.383 ms 3 84.116.191.221 8.367 ms 9.098 ms 8.967 ms 4 84.116.130.102 7.959 ms 7.905 ms 7.490 ms 5 129.250.9.29 8.914 ms 8.023 ms 8.070 ms 6 129.250.4.16 8.048 ms 8.483 ms 8.894 ms 7 129.250.4.96 94.929 ms 94.882 ms 96.235 ms 8 129.250.3.189 160.419 ms 160.473 ms 164.702 ms 9 129.250.3.238 160.700 ms 160.501 ms 160.755 ms 10 129.250.2.16 161.365 ms 160.543 ms 160.335 ms 11 129.250.198.182 158.326 ms 158.105 ms 158.365 ms 12 162.144.240.163 182.527 ms 182.299 ms 182.470 ms 13 162.144.240.127 182.288 ms 182.736 ms 183.292 ms 14 198.57.151.250 158.162 ms 159.572 ms 158.137 ms
Some names are resolved with 0ms now on morning, others I used yesterday not. Why? Does unbound cached more used names longer?
Why stopped unbound this night? Has it something to do with pfblockerNG-devel?
Aug 31 00:00:16 unbound 5433:0 info: start of service (unbound 1.9.1). Aug 31 00:00:16 unbound 5433:0 notice: init module 1: iterator Aug 31 00:00:16 unbound 5433:0 notice: init module 0: validator Aug 31 00:00:15 unbound 5433:0 notice: Restart of unbound 1.9.1. Aug 31 00:00:15 unbound 5433:0 info: 0.524288 1.000000 4 Aug 31 00:00:15 unbound 5433:0 info: 0.262144 0.524288 7 Aug 31 00:00:15 unbound 5433:0 info: 0.131072 0.262144 54 Aug 31 00:00:15 unbound 5433:0 info: 0.065536 0.131072 98 Aug 31 00:00:15 unbound 5433:0 info: 0.032768 0.065536 68 Aug 31 00:00:15 unbound 5433:0 info: 0.016384 0.032768 43 Aug 31 00:00:15 unbound 5433:0 info: 0.008192 0.016384 28 Aug 31 00:00:15 unbound 5433:0 info: 0.004096 0.008192 2 Aug 31 00:00:15 unbound 5433:0 info: 0.000000 0.000001 42 Aug 31 00:00:15 unbound 5433:0 info: lower(secs) upper(secs) recursions Aug 31 00:00:15 unbound 5433:0 info: [25%]=0.0219088 median[50%]=0.0607172 [75%]=0.116694 Aug 31 00:00:15 unbound 5433:0 info: histogram of recursion processing times Aug 31 00:00:15 unbound 5433:0 info: average recursion processing time 0.082558 sec Aug 31 00:00:15 unbound 5433:0 info: server stats for thread 3: requestlist max 19 avg 0.542125 exceeded 0 jostled 0 Aug 31 00:00:15 unbound 5433:0 info: server stats for thread 3: 1239 queries, 893 answers from cache, 346 recursions, 473 prefetch, 0 rejected by ip ratelimiting Aug 31 00:00:15 unbound 5433:0 info: 2.000000 4.000000 2 Aug 31 00:00:15 unbound 5433:0 info: 1.000000 2.000000 4 Aug 31 00:00:15 unbound 5433:0 info: 0.524288 1.000000 9 Aug 31 00:00:15 unbound 5433:0 info: 0.262144 0.524288 45 Aug 31 00:00:15 unbound 5433:0 info: 0.131072 0.262144 236 Aug 31 00:00:15 unbound 5433:0 info: 0.065536 0.131072 366 Aug 31 00:00:15 unbound 5433:0 info: 0.032768 0.065536 363 Aug 31 00:00:15 unbound 5433:0 info: 0.016384 0.032768 248 Aug 31 00:00:15 unbound 5433:0 info: 0.008192 0.016384 100 Aug 31 00:00:15 unbound 5433:0 info: 0.004096 0.008192 10 Aug 31 00:00:15 unbound 5433:0 info: 0.002048 0.004096 3 Aug 31 00:00:15 unbound 5433:0 info: 0.001024 0.002048 3 Aug 31 00:00:15 unbound 5433:0 info: 0.000512 0.001024 2 Aug 31 00:00:15 unbound 5433:0 info: 0.000256 0.000512 2 Aug 31 00:00:15 unbound 5433:0 info: 0.000000 0.000001 152 Aug 31 00:00:15 unbound 5433:0 info: lower(secs) upper(secs) recursions Aug 31 00:00:15 unbound 5433:0 info: [25%]=0.0239319 median[50%]=0.0555612 [75%]=0.114912 Aug 31 00:00:15 unbound 5433:0 info: histogram of recursion processing times Aug 31 00:00:15 unbound 5433:0 info: average recursion processing time 0.086276 sec Aug 31 00:00:15 unbound 5433:0 info: server stats for thread 2: requestlist max 28 avg 1.21664 exceeded 0 jostled 0 Aug 31 00:00:15 unbound 5433:0 info: server stats for thread 2: 4486 queries, 2941 answers from cache, 1545 recursions, 1580 prefetch, 0 rejected by ip ratelimiting Aug 31 00:00:15 unbound 5433:0 info: 1.000000 2.000000 1 Aug 31 00:00:15 unbound 5433:0 info: 0.524288 1.000000 12 Aug 31 00:00:15 unbound 5433:0 info: 0.262144 0.524288 27 Aug 31 00:00:15 unbound 5433:0 info: 0.131072 0.262144 75 Aug 31 00:00:15 unbound 5433:0 info: 0.065536 0.131072 213 Aug 31 00:00:15 unbound 5433:0 info: 0.032768 0.065536 180 Aug 31 00:00:15 unbound 5433:0 info: 0.016384 0.032768 124 Aug 31 00:00:15 unbound 5433:0 info: 0.008192 0.016384 60 Aug 31 00:00:15 unbound 5433:0 info: 0.004096 0.008192 3 Aug 31 00:00:15 unbound 5433:0 info: 0.002048 0.004096 1 Aug 31 00:00:15 unbound 5433:0 info: 0.000512 0.001024 1 Aug 31 00:00:15 unbound 5433:0 info: 0.000000 0.000001 71 Aug 31 00:00:15 unbound 5433:0 info: lower(secs) upper(secs) recursions Aug 31 00:00:15 unbound 5433:0 info: [25%]=0.0237832 median[50%]=0.0553415 [75%]=0.107381 Aug 31 00:00:15 unbound 5433:0 info: histogram of recursion processing times Aug 31 00:00:15 unbound 5433:0 info: average recursion processing time 0.082412 sec Aug 31 00:00:15 unbound 5433:0 info: server stats for thread 1: requestlist max 23 avg 0.68534 exceeded 0 jostled 0 Aug 31 00:00:15 unbound 5433:0 info: server stats for thread 1: 2418 queries, 1650 answers from cache, 768 recursions, 910 prefetch, 0 rejected by ip ratelimiting Aug 31 00:00:15 unbound 5433:0 info: 2.000000 4.000000 2 Aug 31 00:00:15 unbound 5433:0 info: 1.000000 2.000000 5 Aug 31 00:00:15 unbound 5433:0 info: 0.524288 1.000000 11 Aug 31 00:00:15 unbound 5433:0 info: 0.262144 0.524288 37 Aug 31 00:00:15 unbound 5433:0 info: 0.131072 0.262144 288 Aug 31 00:00:15 unbound 5433:0 info: 0.065536 0.131072 409 Aug 31 00:00:15 unbound 5433:0 info: 0.032768 0.065536 398 Aug 31 00:00:15 unbound 5433:0 info: 0.016384 0.032768 258 Aug 31 00:00:15 unbound 5433:0 info: 0.008192 0.016384 133 Aug 31 00:00:15 unbound 5433:0 info: 0.004096 0.008192 9 Aug 31 00:00:15 unbound 5433:0 info: 0.002048 0.004096 7 Aug 31 00:00:15 unbound 5433:0 info: 0.001024 0.002048 2 Aug 31 00:00:15 unbound 5433:0 info: 0.000512 0.001024 3 Aug 31 00:00:15 unbound 5433:0 info: 0.000256 0.000512 3 Aug 31 00:00:15 unbound 5433:0 info: 0.000128 0.000256 1 Aug 31 00:00:15 unbound 5433:0 info: 0.000000 0.000001 199 Aug 31 00:00:15 unbound 5433:0 info: lower(secs) upper(secs) recursions Aug 31 00:00:15 unbound 5433:0 info: [25%]=0.0217342 median[50%]=0.0547917 [75%]=0.115329 Aug 31 00:00:15 unbound 5433:0 info: histogram of recursion processing times Aug 31 00:00:15 unbound 5433:0 info: average recursion processing time 0.084765 sec Aug 31 00:00:15 unbound 5433:0 info: server stats for thread 0: requestlist max 23 avg 1.41447 exceeded 0 jostled 0 Aug 31 00:00:15 unbound 5433:0 info: server stats for thread 0: 5246 queries, 3481 answers from cache, 1765 recursions, 1842 prefetch, 0 rejected by ip ratelimiting Aug 31 00:00:15 unbound 5433:0 info: service stopped (unbound 1.9.1).
-
not a traceroute a dig +trace
$ dig www.whatever.com +trace ; <<>> DiG 9.14.4 <<>> www.whatever.com +trace ;; global options: +cmd . 27190 IN NS h.root-servers.net. . 27190 IN NS k.root-servers.net. . 27190 IN NS d.root-servers.net. . 27190 IN NS l.root-servers.net. . 27190 IN NS c.root-servers.net. . 27190 IN NS a.root-servers.net. . 27190 IN NS m.root-servers.net. . 27190 IN NS f.root-servers.net. . 27190 IN NS e.root-servers.net. . 27190 IN NS j.root-servers.net. . 27190 IN NS i.root-servers.net. . 27190 IN NS g.root-servers.net. . 27190 IN NS b.root-servers.net. . 27190 IN RRSIG NS 8 0 518400 20190912170000 20190830160000 59944 . DtQjgY6hTjQoBx95E2qR9YHr/VIiwFqkjYjvBuX21XlBEYjlH3Rq0+sF 0XkyzUwp6xq2SXW3ZPgK0SHf2/hv+3fx0sricuQ5mAhvlw9yVVIwQTq5 dr2B0hfs6tfZNiX+CDNMK6DzjEAlX34gnVZmtSuv5KG87PG9ztBoygPd AxobqaiBksHS8DsCNpVwRunZCZ0Wd59LlWl72etkTft779F8YxvIa9B4 MOf497UcW+Wk38utZ4LRtJL0nTk5BeP0jf6oPi95Sp80SgkOGlOAkwvM c10ZiG5NrH0CtBJYQtOpAG4SamwxhxzK1TElq2SZY7lLOTtrFCQYNK53 0Y5yVA== ;; Received 525 bytes from 192.168.3.10#53(192.168.3.10) in 3 ms com. 172800 IN NS m.gtld-servers.net. com. 172800 IN NS c.gtld-servers.net. com. 172800 IN NS e.gtld-servers.net. com. 172800 IN NS a.gtld-servers.net. com. 172800 IN NS d.gtld-servers.net. com. 172800 IN NS b.gtld-servers.net. com. 172800 IN NS g.gtld-servers.net. com. 172800 IN NS f.gtld-servers.net. com. 172800 IN NS k.gtld-servers.net. com. 172800 IN NS j.gtld-servers.net. com. 172800 IN NS l.gtld-servers.net. com. 172800 IN NS i.gtld-servers.net. com. 172800 IN NS h.gtld-servers.net. com. 86400 IN DS 30909 8 2 E2D3C916F6DEEAC73294E8268FB5885044A833FC5459588F4A9184CF C41A5766 com. 86400 IN RRSIG DS 8 1 86400 20190913050000 20190831040000 59944 . ZmaE6S3yTVnYVXNywBnPO1hD4iHQ/DaBiMDi2+mRC88NXTH1Qrsnflnm fIInk6AnQAtl9uS3LM+qXinwCUMrpVGupSi9FQ3QneZgnilRzhyuloxM xJi/22+WulaBE7UzDZJrpA572P3dWBHl296vw3oCoF8OENW/D2Z16gWw xOBJD57Jocnhghm9ONXoE60WPWSOQD9xytzc5vl1oZIRYpmcYsNe1wsq NYm+WUSuM1+AaG0tyjdbwxR23nkRowRxTJyARkc4wcaIEQaNXyEm7Iad ToAyiKVxpCGs2B7JKHuVL9sXsNYo/+awj5yGXuWz1tLBk3teXKgMI0Yu qjSSig== ;; Received 1204 bytes from 192.33.4.12#53(c.root-servers.net) in 12 ms whatever.com. 172800 IN NS ns6217.hostgator.com. whatever.com. 172800 IN NS ns6218.hostgator.com. CK0POJMG874LJREF7EFN8430QVIT8BSM.com. 86400 IN NSEC3 1 1 0 - CK0Q1GIN43N1ARRC9OSM6QPQR81H5M9A NS SOA RRSIG DNSKEY NSEC3PARAM CK0POJMG874LJREF7EFN8430QVIT8BSM.com. 86400 IN RRSIG NSEC3 8 2 86400 20190904044529 20190828033529 17708 com. vtK0SnwKj0v250DLs1saXgDLxjCfNIdwgX/HHiCRQtvwxI3gMdZbEkM2 iOCv2Sdzo0dnz4RxN6BqXXbB8ZwWqG632PgCwFZluYzSi+stiZY2RX31 FlFzE2VgSf9xB/cElOJp94o2sYEW/n4Gqp73bPbE/HFcVeklYm0MI0bA JvU= RNHABBI0G00MKABON3HNN10VBLL72I2F.com. 86400 IN NSEC3 1 1 0 - RNHCNLOM2HJP5G1RNIDHEF5664U20CFO NS DS RRSIG RNHABBI0G00MKABON3HNN10VBLL72I2F.com. 86400 IN RRSIG NSEC3 8 2 86400 20190905043336 20190829032336 17708 com. pHdhtwlMfX9QPxdOk6xuO4D+naVZOSfIqGqYB1B/QWlCzxRQa97pfUrn sffyo2mChJWntL6XHutDZHB+YGlvBLg4VqvdwUmoeoaZpVqwlSMtAB4x B1cyW+jf0byLvNjJELetC8JFhmH1LpJIRyuvsFhps3f+Nd6RoVUNLWpz FHM= ;; Received 614 bytes from 192.5.6.30#53(a.gtld-servers.net) in 39 ms www.whatever.com. 14400 IN CNAME whatever.com. whatever.com. 14400 IN A 198.57.151.250 whatever.com. 86400 IN NS ns6218.hostgator.com. whatever.com. 86400 IN NS ns6217.hostgator.com. ;; Received 159 bytes from 50.87.144.144#53(ns6217.hostgator.com) in 44 ms
that is what happens when you have to resolve from roots.
So sure if the authoritative NS or any of those others in the path are on the other side of the planet it might take a second... Doesnt matter in the big picture - its only once and after that its direct to the authoritative ns for the domain vs going all the way down from the root .
-
; <<>> DiG 9.12.2-P1 <<>> www.whatever.com +trace ;; global options: +cmd . 6497 IN NS i.root-servers.net. . 6497 IN NS h.root-servers.net. . 6497 IN NS d.root-servers.net. . 6497 IN NS j.root-servers.net. . 6497 IN NS g.root-servers.net. . 6497 IN NS b.root-servers.net. . 6497 IN NS k.root-servers.net. . 6497 IN NS m.root-servers.net. . 6497 IN NS a.root-servers.net. . 6497 IN NS e.root-servers.net. . 6497 IN NS f.root-servers.net. . 6497 IN NS c.root-servers.net. . 6497 IN NS l.root-servers.net. . 6497 IN RRSIG NS 8 0 518400 20190912050000 20190830040000 59944 . a18HBLRxbDklfb/5azG80cAJFAwNd4luRiFgFM6QUhVNkCcYfHEPN86t H2TiEwxxwQE+gfKdMFc6F+2GT5MqMgJocYS4hxyai54iMtzN9/HzUxFQ IVeOWU2g2piycqavfFqMp4pfmbESjGj3zBs3BemvD8nS9JVc7PtDnYEN HJ6iYLCSZlLp3HPTOGqd2Kh9uBmujnsVqbUoVWT7H5vT3yblT2J3MdhV XcUYAwl8CneBJGql1VT1ZS5lvGriOnrRuX9evjgHlGZuRk5tiR8oc4aH ndEc28HdihJH4fmj6P0Zq2DnP3KOMV/voHCsF29hEyT3YhpCDng5U99E 994KgA== ;; Received 525 bytes from 127.0.0.1#53(127.0.0.1) in 0 ms com. 172800 IN NS f.gtld-servers.net. com. 172800 IN NS e.gtld-servers.net. com. 172800 IN NS g.gtld-servers.net. com. 172800 IN NS c.gtld-servers.net. com. 172800 IN NS d.gtld-servers.net. com. 172800 IN NS m.gtld-servers.net. com. 172800 IN NS h.gtld-servers.net. com. 172800 IN NS i.gtld-servers.net. com. 172800 IN NS k.gtld-servers.net. com. 172800 IN NS l.gtld-servers.net. com. 172800 IN NS b.gtld-servers.net. com. 172800 IN NS j.gtld-servers.net. com. 172800 IN NS a.gtld-servers.net. com. 86400 IN DS 30909 8 2 E2D3C916F6DEEAC73294E8268FB5885044A833FC5459588F4A9184CF C41A5766 com. 86400 IN RRSIG DS 8 1 86400 20190913050000 20190831040000 59944 . ZmaE6S3yTVnYVXNywBnPO1hD4iHQ/DaBiMDi2+mRC88NXTH1Qrsnflnm fIInk6AnQAtl9uS3LM+qXinwCUMrpVGupSi9FQ3QneZgnilRzhyuloxM xJi/22+WulaBE7UzDZJrpA572P3dWBHl296vw3oCoF8OENW/D2Z16gWw xOBJD57Jocnhghm9ONXoE60WPWSOQD9xytzc5vl1oZIRYpmcYsNe1wsq NYm+WUSuM1+AaG0tyjdbwxR23nkRowRxTJyARkc4wcaIEQaNXyEm7Iad ToAyiKVxpCGs2B7JKHuVL9sXsNYo/+awj5yGXuWz1tLBk3teXKgMI0Yu qjSSig== ;; Received 1176 bytes from 2001:7fe::53#53(i.root-servers.net) in 18 ms whatever.com. 172800 IN NS ns6217.hostgator.com. whatever.com. 172800 IN NS ns6218.hostgator.com. CK0POJMG874LJREF7EFN8430QVIT8BSM.com. 86400 IN NSEC3 1 1 0 - CK0Q1GIN43N1ARRC9OSM6QPQR81H5M9A NS SOA RRSIG DNSKEY NSEC3PARAM CK0POJMG874LJREF7EFN8430QVIT8BSM.com. 86400 IN RRSIG NSEC3 8 2 86400 20190904044529 20190828033529 17708 com. vtK0SnwKj0v250DLs1saXgDLxjCfNIdwgX/HHiCRQtvwxI3gMdZbEkM2 iOCv2Sdzo0dnz4RxN6BqXXbB8ZwWqG632PgCwFZluYzSi+stiZY2RX31 FlFzE2VgSf9xB/cElOJp94o2sYEW/n4Gqp73bPbE/HFcVeklYm0MI0bA JvU= RNHABBI0G00MKABON3HNN10VBLL72I2F.com. 86400 IN NSEC3 1 1 0 - RNHCNLOM2HJP5G1RNIDHEF5664U20CFO NS DS RRSIG RNHABBI0G00MKABON3HNN10VBLL72I2F.com. 86400 IN RRSIG NSEC3 8 2 86400 20190905043336 20190829032336 17708 com. pHdhtwlMfX9QPxdOk6xuO4D+naVZOSfIqGqYB1B/QWlCzxRQa97pfUrn sffyo2mChJWntL6XHutDZHB+YGlvBLg4VqvdwUmoeoaZpVqwlSMtAB4x B1cyW+jf0byLvNjJELetC8JFhmH1LpJIRyuvsFhps3f+Nd6RoVUNLWpz FHM= ;; Received 614 bytes from 192.41.162.30#53(l.gtld-servers.net) in 15 ms www.whatever.com. 14400 IN CNAME whatever.com. whatever.com. 14400 IN A 198.57.151.250 whatever.com. 86400 IN NS ns6217.hostgator.com. whatever.com. 86400 IN NS ns6218.hostgator.com. ;; Received 159 bytes from 198.57.151.238#53(ns6218.hostgator.com) in 184 ms
-
@mrsunfire said in DNS Resolver not caching correct?:
(ns6218.hostgator.com) in 184 ms
So you see the authoritative ns are that far away from you - lot farther than 7ms ;)
At any given time you might of talked to something in the path that took longer than normal, maybe something in path was congested, maybe the ns took longer to answer, etc.
But that is how something is resolved - when none of it is cached.. now the once the ns for .com are cached no reason to ask roots for those, once the ns for whatever.com is cached no reason to talk to the gtld-servers.net ns - so you can just go ask the authoritative NS directly - but since its a lot farther than 7ms away from you - there can be delays... But in the big picture makes no matter. Since its only going to be once, and then its cached for the length of the TTL, and if you have prefetch setup and or zero answer - you will get an answer from unbound instantly and it will go refresh its stuff in the background..
So what does it matter if took 1000ms - that is not even going to be really noticed since I doubt a site couple hundred ms away from you is going to load instantly anyway.. Worse case you added a whole second to the page load time (ONCE)
There is little need of concerning your self if a site resolves in 30ms or 300ms, or even 1000ms.. Since once its cached - none of that matters any more. And in the big picture a fraction of a second in addition to the overall first load time of the page is meaningless.
-
Hi johnpoz,
could you post your DNS Resolver, General Settings and Advanced Settings please.
It would be very handy for us all!
Thanks, Perlen
-
Sure here you go
Notice that I have disabled automatic ACLs so you will have to create your own to allow queries.
I have also changed from transparent to static for my zone.. Make sure you actually understand what settings do before changing them.. Any questions on what anything specifically does, just ask. Don't think this is some sort of guide to how you should set yours up.. These are my settings for my network and use case.. Most of them are just default.. Only a couple of changes really from out of the box settings. Which may or may not be good for your actual needs.
Generally speaking - out of the box should be fine for pretty much everyone.
As to the general settings - there are no dns set other than local... Here