Trying to Understand Traffic Graphs
-
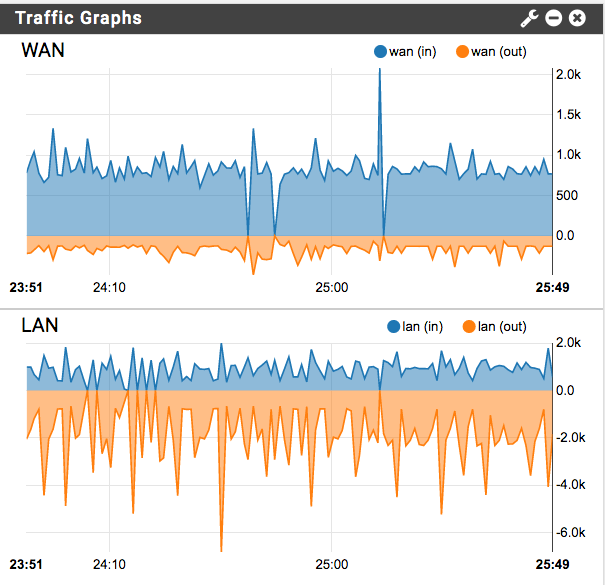
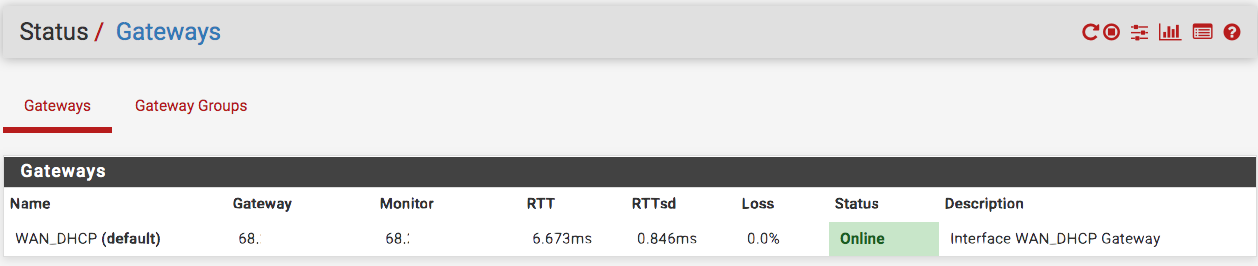
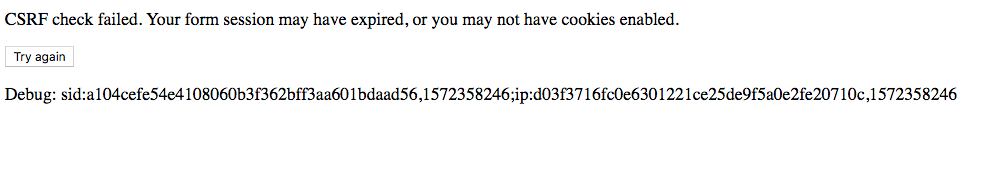
Monday night at close to midnight, I could not access the Internet; however, the traffic graph shows or indicates constant traffic flow. I realize that some of my feeds might have been trying to complete task. Then, Dashboard would seem to lock up...meaning when I shift to look at Status > Gateways; it would take two to three minutes to go there. Then, it would take the same time or longer to go back to the Dashboard. Then, I would close the browser and relaunched it...it would take about the same time to login. During this time, if I press enter again, I would get a CSRF check failed. Gateways shows status online but I could not go anywhere. I do not trust my ISP...so I am trying to understand what's happening...it seems that I was placed in a holding pattern while making it look as if constant traffic is traversing my pfSense machine.
What's troubling though is the pfSense web interface becomes unusual and unresponsive as if consumed in background processing.
-
Well, I did an experiment disconnecting the WAN to see what the graphs would show...it was still active...so, it appears that it doesn't measure throughput as I earlier thought.
-
@NollipfSense About the CSRF make sure the time is correct on pfsense, and client your are trying to access on.
Vendor: HP
Version: P01 Ver. 02.50
Release Date: Wed Jul 17 2024
Boot Method: UEFI
24.11-RELEASE (amd64)
FreeBSD 15.0-CURRENT
CPU Type: Intel(R) Core(TM) i5-7500 CPU @ 3.40GHz
Current: 3606 MHz, Max: 3400 MHz
4 CPUs : 1 package(s) x 4 core(s) -
The CSRF check is almost always because there was a browser tab opened and logged in that was closed without logging out and the session has expired. Simple refreshing the page should get a new session without the error.
So if you are seeing that whilst trying to connect the pfSense webgui has probably closed the session. Was the traffic graph actually still updating or had it stalled when the session closed perhaps?
Steve
-
@manjotsc said in Trying to Understand Traffic Graphs:
@NollipfSense About the CSRF make sure the time is correct on pfsense, and client your are trying to access on.
.
I think it had the correct time but will check next time it happens@stephenw10 said in Trying to Understand Traffic Graphs:
The CSRF check is almost always because there was a browser tab opened and logged in that was closed without logging out and the session has expired. Simple refreshing the page should get a new session without the error.
So if you are seeing that whilst trying to connect the pfSense webgui has probably closed the session. Was the traffic graph actually still updating or had it stalled when the session closed perhaps?
Steve
I had logged in however, the interface was taking awhile so I pressed enter again thinking I might had hit the wrong key.
-
@stephenw10 Hello Steve, I also wanted to understand why the web interface became unresponsive...I am trying to figure out whether my ISP had anything to do with the unresponsiveness.
It seems that I should always have access to pfSense from LAN despite whether I have a public IP or not, as well as whether I have the Internet up or down. I also believe my ISP might have placed me in a holding pattern...I have connection but cannot go anywhere.
-
The GUI will become laggy when it has no upstream connectivity. That can be significantly worse on the dashboard where you may have several widgets that try to resolve DNS and check external sources. The update check, support status check, package update check, dyndns entries for example all have to time-out.
However it should not take 3 minutes. That seems more likely all the cpu cycles were being used for some process that could not complete.Steve
-
@stephenw10 said in Trying to Understand Traffic Graphs:
The GUI will become laggy when it has no upstream connectivity. That can be significantly worse on the dashboard where you may have several widgets that try to resolve DNS and check external sources. The update check, support status check, package update check, dyndns entries for example all have to time-out.
However it should not take 3 minutes. That seems more likely all the cpu cycles were being used for some process that could not complete.Steve
Thank you for explaining the lagging experience Steve! My 3 minutes was a guess estimate...I thought it checked for update when first launching Dashboard though. Dashboard was already opened.