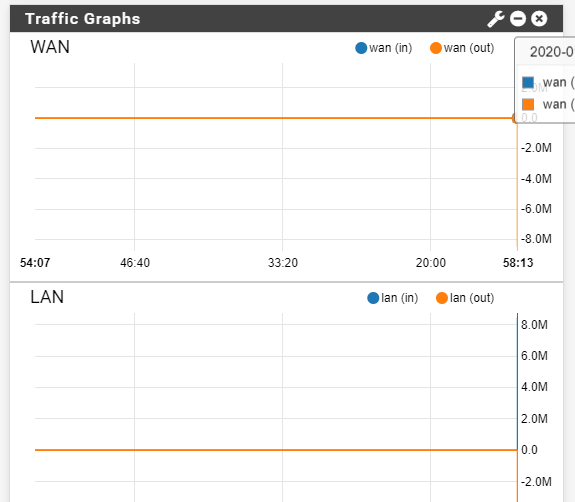
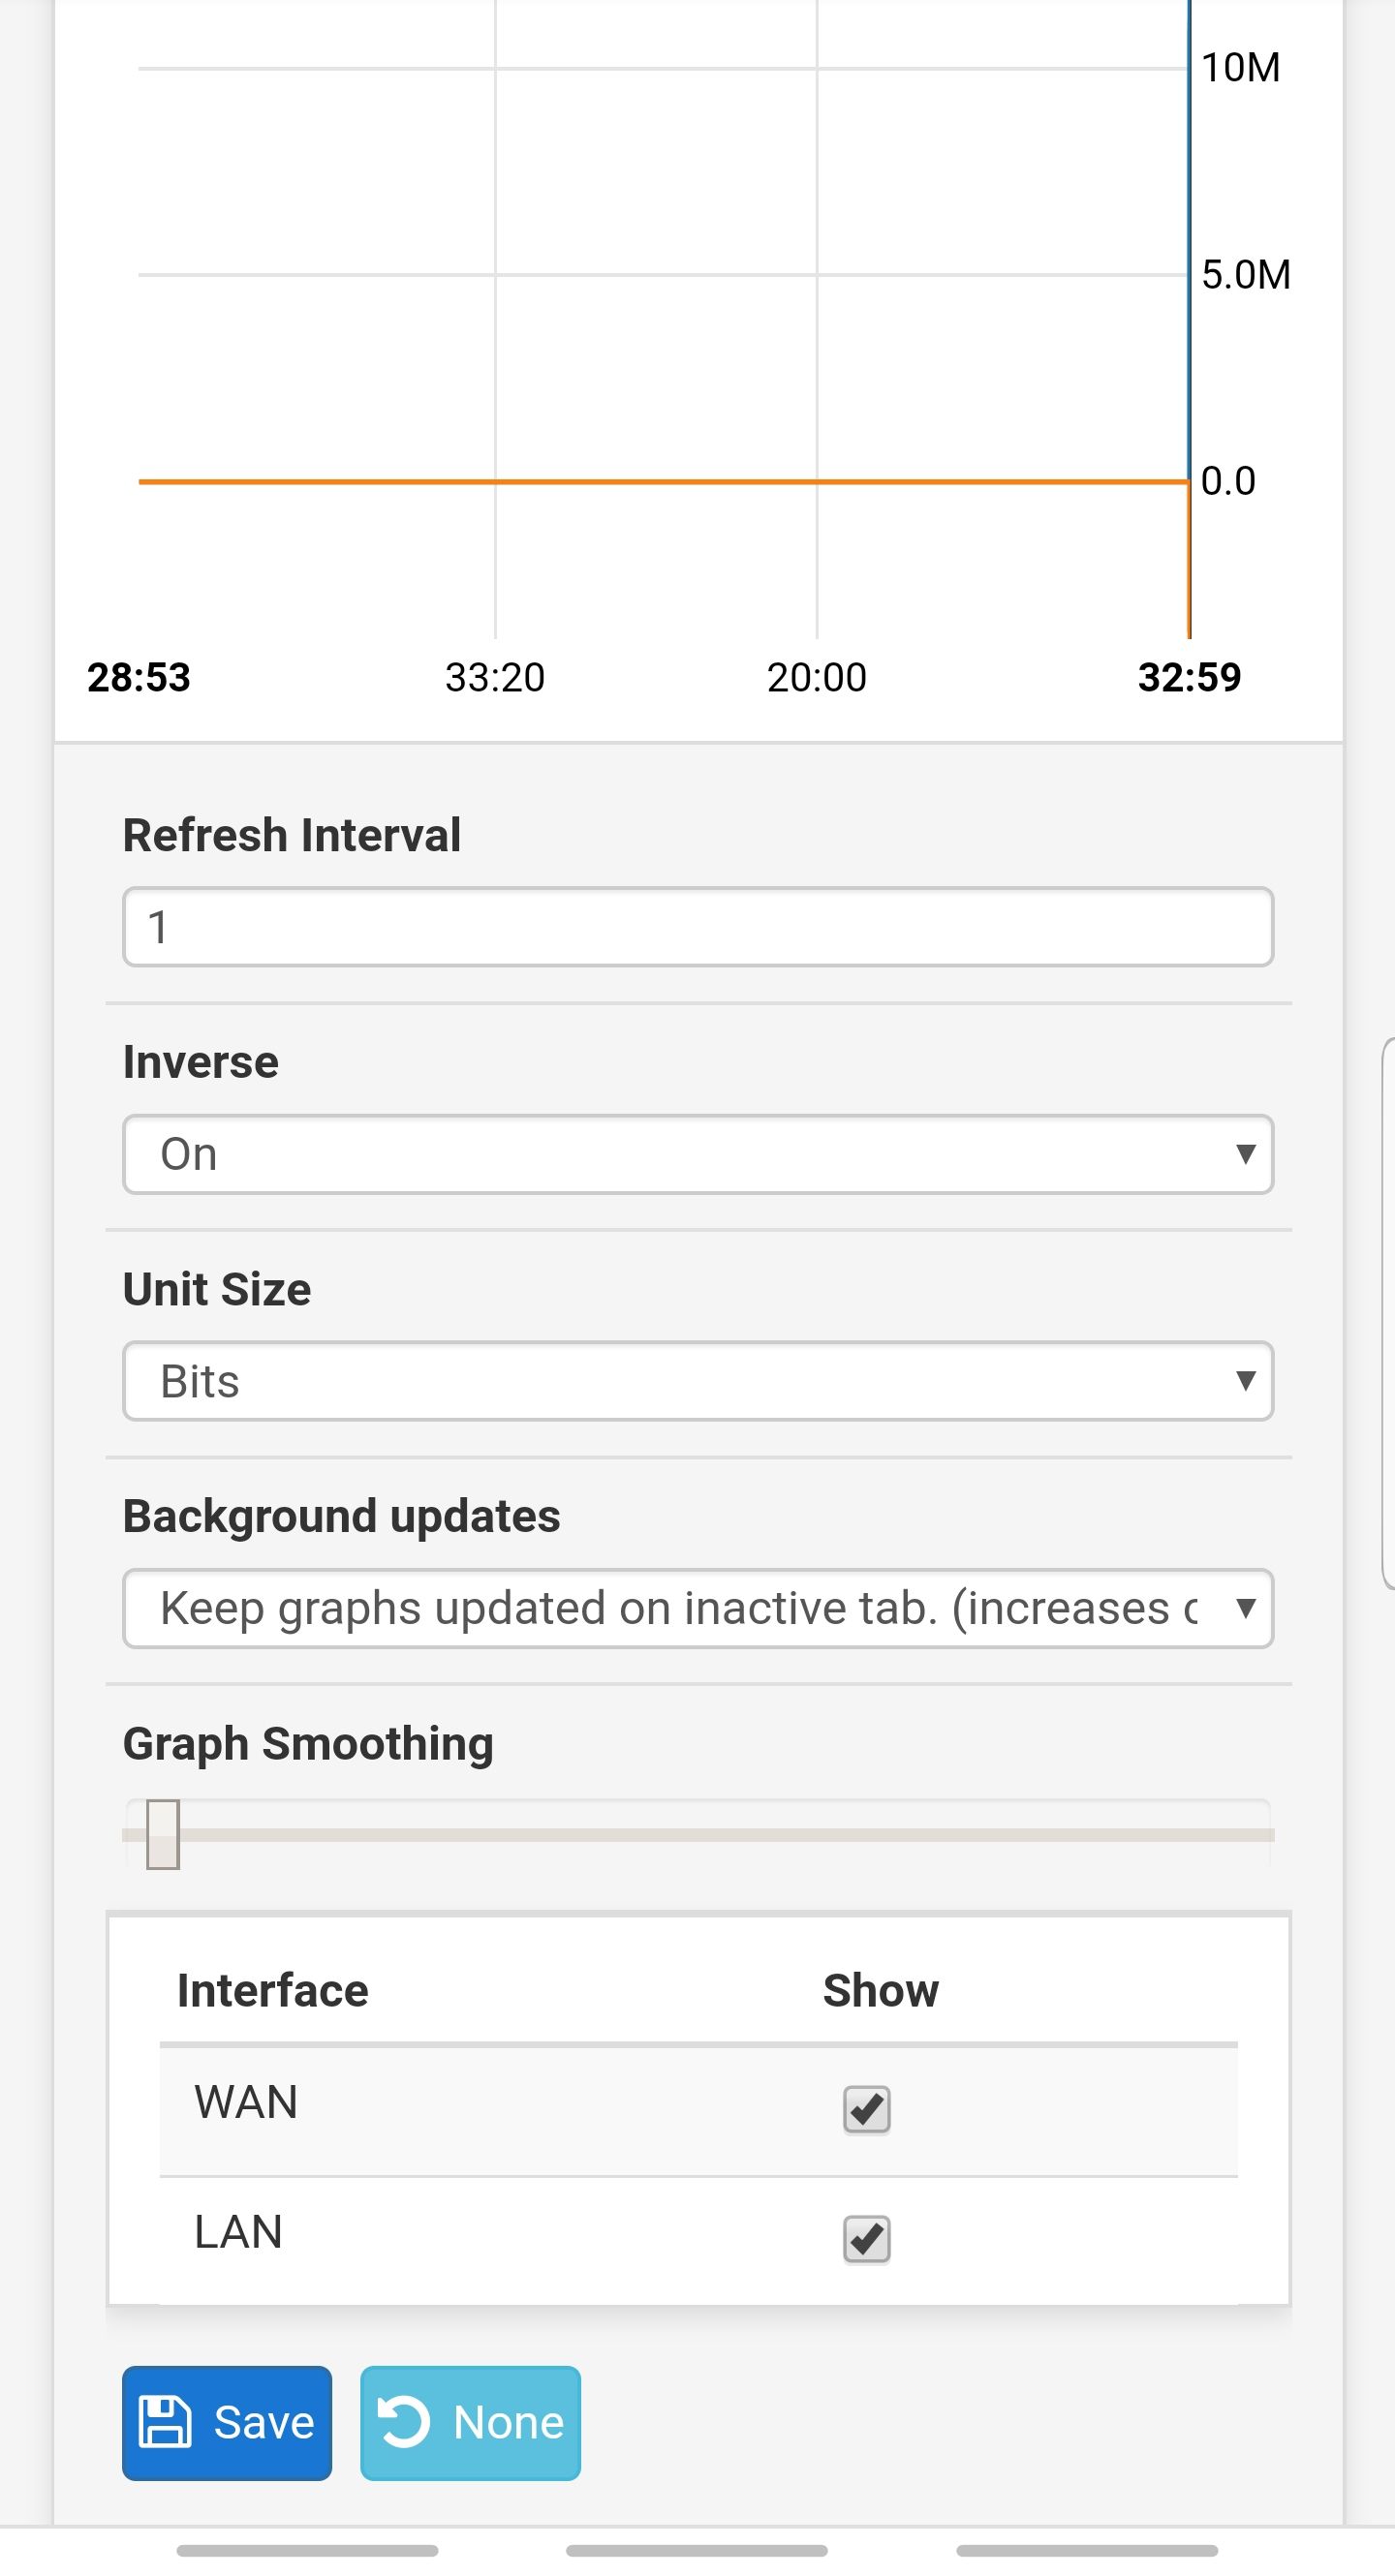
The graph does not display immediately
-
I can not duplicate this... Have you tried a different browser? What browser are you using - I am using FF 72.0.2
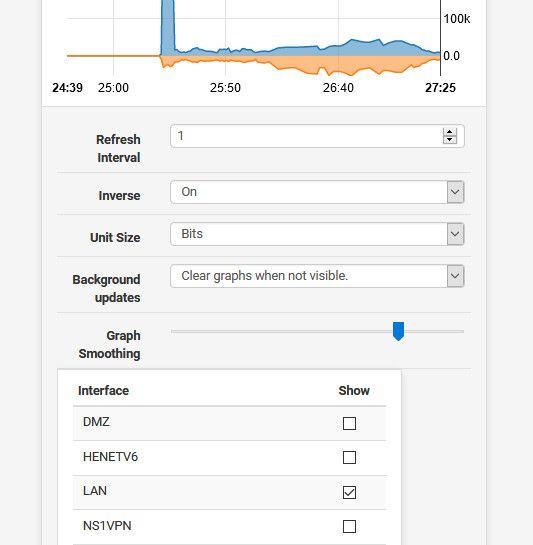
What are the settings of the widget, refresh, clear etc..
-
@johnpoz I am using Chrome and Internet explorer.
-
Try a different browser, I would try setting clear graphs when not visible as well.
-
@johnpoz
I chose the option you mentioned, tried reinstalling Pfsense, and tried Firefox.
It doesn't work. -
I assume you're running pfSense 2.4.4p3?
Do you see the same behaviour in Status > Traffic Graph?
Steve
-
@stephenw10 Status-Traffic Graph also comes after about three minutes.
That version is correct
-
Hmm, I've never seen that in countless 2.4.4p3 pfSense installs I've connected to. It seems very likely to be something in your environment. Can you try a completely different client?
Steve
-
Pfsense Server computer?
I think it's a server computer problem.Devices to connect?
I tried it on various devices but it's the same(I am Korean and I am not good at English so I use a translator to communicate.)
-
Your translator is good.

If you have reinstalled pfSense then it can only be a configuration issue, if you imported the old config file. Though there is no setting I'm aware if that would do that.
Do you still see this behaviour with a default config in pfSense?
Steve
-
@stephenw10
Yes.The same is true if you do a fresh install of Pfsense and immediately check it.
-
Hmm, there must be something different about how you are viewing this then. That just doesn't happen on any system I have access to test against in any browser I have tested.
Any sort of browser plugin you might be running? (unlikely across multiple browsers but...)
Steve
-
The browser I've used?
Chrome, FireFox, internet explorer, SmartPhone Default internet ...
-
What image are you using exactly? What are you installing it on?
I still can't reproduce this.
Steve
-
pfSense-CE-memstick-2.4.4-RELEASE-p3-amd64.img
I installed this file via USB.
Maybe my USB problem or server computer (Pfsense Computer) isn't it a problem?
-
This post is deleted! -
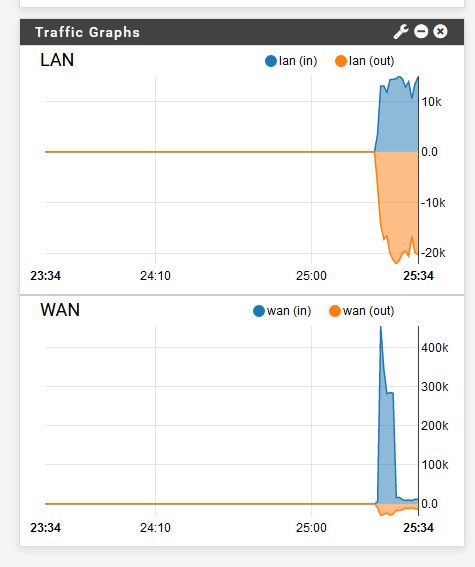
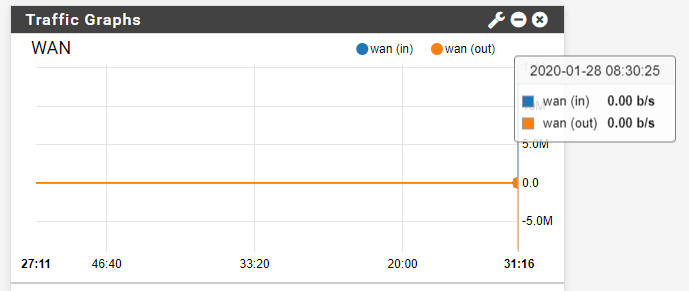
https://www.youtube.com/watch?v=NgMl8h4OWPE
This is a 2 minute 13 second video
The graph appears about 1 minute 57 seconds
-
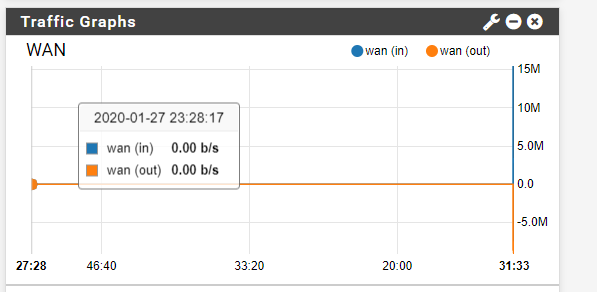
Ah, so it is updating just fine it's just scaled incorrectly. It shows ~2mins when it's drawn correctly. It appears to be showing ~4mins when it's drawn incorrectly except the time values in between in the time axis appear wildly incorrect.
Can you mouse-over the graph to see what those time values actually are?
I have no idea what might cause that though. Current time on the firewall wrong?
Steve
-
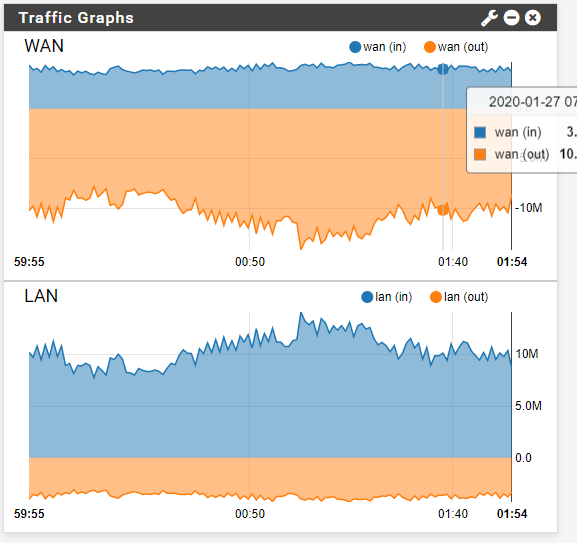
Firewall is currently current date / time
Mon Jan 27 23:28:17 UTC 2020
Thank you for your continued help.
-
What about your client - is it time in sync with pfsense time?
-
Can I sync Pfsense time separately? Will the service break if I do that?