Tough time with Unbound
-
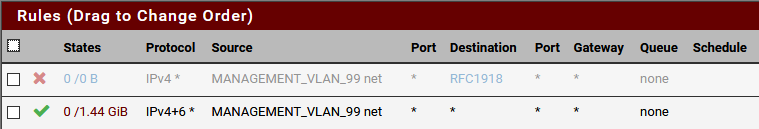
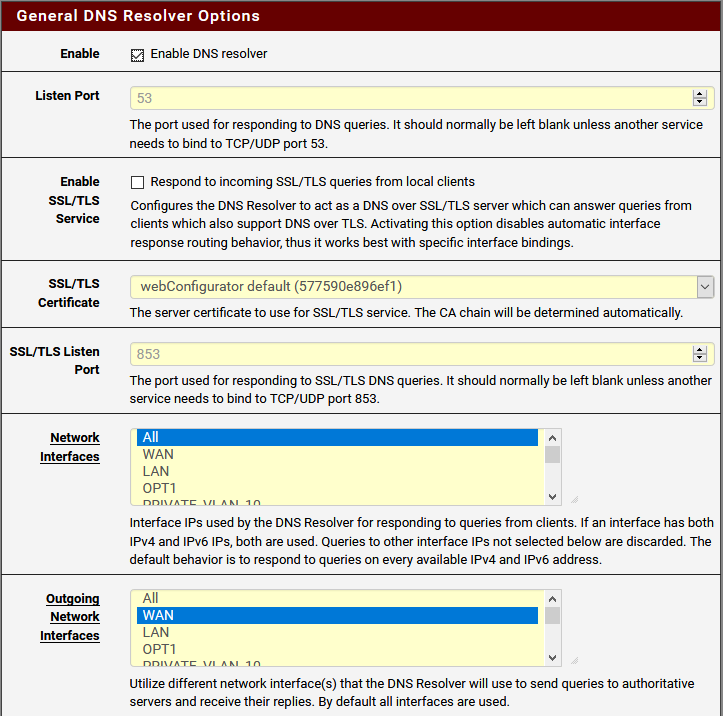
I'm setting up a new firewall and am having a tough time with getting DNS to flow properly. The network has 6 VLANs (10, 20, 30, 40, 50, and 99), each needing to resolve DNS from the pfSense firewall. I can get IP traffic to flow properly via testing with Ping so I think my firewall rules are right. Today I was testing on 2 separate VLANs, 10 and 99. VLAN 10 worked properly. VLAN 99 would get no resolution at all. They have essentially the same firewall rules and since pinging works it leads me to believe it's the Unbound configuration. I'm not sure why, though. In the DNS Resolver General Settings, the Network Interfaces is set to All and the Outgoing Network Interface is set to WAN. Why would it work on one VLAN and not the other? With the rules as I'm posting them, I can log into the pfSense interface from both VLANs. Any ideas?

-
And what version of pfsense is that? That theme looks odd..But can't be too old has tls in the gui..
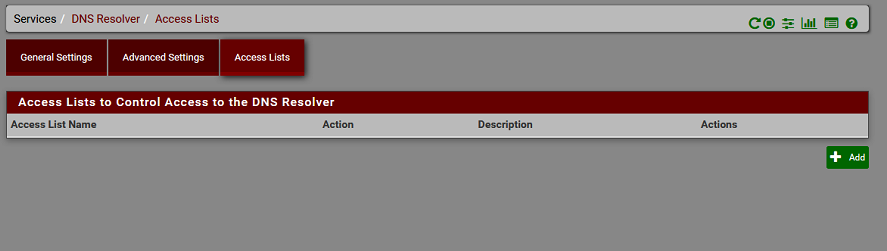
If all your interface rules are any any like the one you show its not an issue with the rules. Could be an issue with your Access lists in unbound.. Did you disable automatic?
-
It's a custom theme. Everything is fully up to date.
2.4.4-RELEASE-p3 (amd64)
built on Wed May 15 18:53:44 EDT 2019
FreeBSD 11.2-RELEASE-p10There are no access lists in Unbound.
-
Because you have auto? set, try creating them..
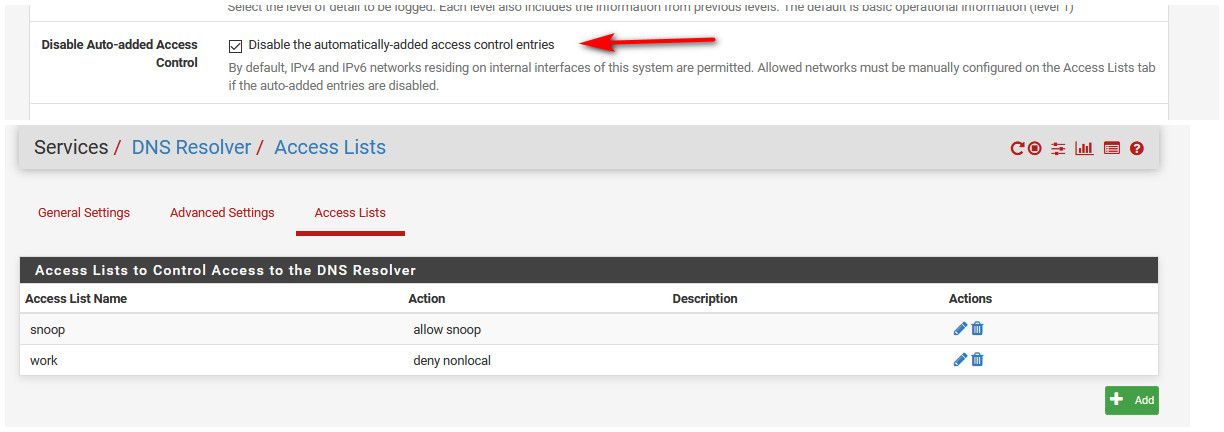
I disable the auto generated lists, because I use custom lists..
If you have downstream networks, then yeah you would have to create some access lists to allow those... What do you get back when you do a directed query - just times out, or do you get back servfail or refused?
You didn't set gateways on your interfaces did you - this would make pfsense think they are external, and would not create accesslists for them, etc.
-
@johnpoz No, the interfaces don't have Gateways. When I query against it I just get timeouts. If I do a generic nslookup query directly from the firewall the requests forward and work fine but that isn't using the resolver. If I query from the CLI against the local IP of an interface it just times out. Is there even a way to test directly from the firewall?
Can you explain why would I need to manually set things? Wouldn't auto just create the ACLs to allow guests on those networks to have access? TBH, I've wondered what the best way to secure the resolver would be. I don't like have the Network Interface set to All but it's the only way I can get OpenVPN connected clients to resolve. Is there a good place that explains a Best Practice setup?
-
@Stewart said in Tough time with Unbound:
Is there even a way to test directly from the firewall?
dig @127.0.0.1 google.com Arun it from the CLI (console).
Usedig @127.0.0.1 google.com A +traceUse
sockstat -l | grep 'unbound'to check if unbound is listening to all interfaces.
You do not have any floating firewall rules ?
-
@Stewart said in Tough time with Unbound:
Can you explain why would I need to manually set things?
You shouldn't unless you want to do things a bit different than what the default automatic acls are.. Which I do, or you have downstream networks, or tunnel networks via vpn and you want your vpn clients to be able to query..
The auto acls only create acls for the local interfaces.
As stated by @Gertjan above validate unbound is actually listening on the interfaces you want to serve dns on.. And again what do you actually get when you try and query from a client? timeout, refused, servfail, nx for what your looking for?
If your wanting your vpn clients to query unbound, I don't think the auto acls allow for that.. And you don't have to listen on all just point them say to the lan IP, not the vpn interface, etc.
What exactly is in your access_lists.conf in /var/unbound
-
I'll try to hit everything in this post:
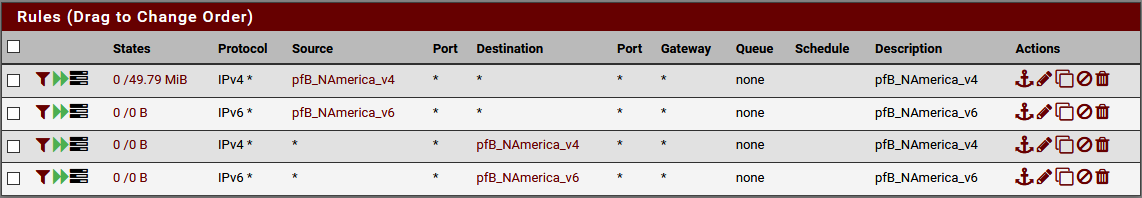
The only floating firewall rules are pfBlocker.
/root: dig @127.0.0.1 google.com a

; <<>> DiG 9.12.2-P1 <<>> @127.0.0.1 google.com a
; (1 server found)
;; global options: +cmd
;; Got answer:
;; ->>HEADER<<- opcode: QUERY, status: NOERROR, id: 3202
;; flags: qr rd ra; QUERY: 1, ANSWER: 1, AUTHORITY: 0, ADDITIONAL: 1

;; OPT PSEUDOSECTION:
; EDNS: version: 0, flags:; udp: 4096
;; QUESTION SECTION:
;google.com.                    IN      A

;; ANSWER SECTION:
google.com.             300     IN      A       172.217.3.238

;; Query time: 111 msec
;; SERVER: 127.0.0.1#53(127.0.0.1)
;; WHEN: Mon Feb 17 08:45:48 EST 2020
;; MSG SIZE  rcvd: 55
Running dig against each of the private IPs of the VLANs also returns the same responses.
dig @127.0.0.1 google.com a +trace

; <<>> DiG 9.12.2-P1 <<>> @127.0.0.1 google.com a +trace
; (1 server found)
;; global options: +cmd
.                       77533   IN      NS      a.root-servers.net.
.                       77533   IN      NS      b.root-servers.net.
.                       77533   IN      NS      c.root-servers.net.
.                       77533   IN      NS      d.root-servers.net.
.                       77533   IN      NS      e.root-servers.net.
.                       77533   IN      NS      f.root-servers.net.
.                       77533   IN      NS      g.root-servers.net.
.                       77533   IN      NS      h.root-servers.net.
.                       77533   IN      NS      i.root-servers.net.
.                       77533   IN      NS      j.root-servers.net.
.                       77533   IN      NS      k.root-servers.net.
.                       77533   IN      NS      l.root-servers.net.
.                       77533   IN      NS      m.root-servers.net.
.                       77533   IN      RRSIG   NS 8 0 518400 20200301050000 20200217040000 33853 . GYYDn4G0sITC7KcnluWxbJT4mom1TFDbnREsGBwBFFTtvo21LgztwnAy VBe8zyTZHpwMvc3y9JkhW8y5j408lhsYQW1iAay2X7HqQZOepdims0JO 2tKzwWZa/81iWRVCOIxGgXn2fvr4PH0OOhVdO0L2w08pKC6Cv/sgJSBX /M8V2+5ioAfK0zTjIouljuXiSSRGHVdtvLxG7aycxYgo9ZbHDRBcCpIG 4RBunW9gfV+Buarm5vPVZQkhRhj/76xswgdX9pW0Gqjim324Ab55dVah TVMxA0FMvrznsuhy7EOvbtxwRiv3L9D4cBJWAW+Ksx3iWuX8pFEgmDhD Mioz/w==
;; Received 525 bytes from 127.0.0.1#53(127.0.0.1) in 1 ms

com.                    172800  IN      NS      a.gtld-servers.net.
com.                    172800  IN      NS      b.gtld-servers.net.
com.                    172800  IN      NS      c.gtld-servers.net.
com.                    172800  IN      NS      d.gtld-servers.net.
com.                    172800  IN      NS      e.gtld-servers.net.
com.                    172800  IN      NS      f.gtld-servers.net.
com.                    172800  IN      NS      g.gtld-servers.net.
com.                    172800  IN      NS      h.gtld-servers.net.
com.                    172800  IN      NS      i.gtld-servers.net.
com.                    172800  IN      NS      j.gtld-servers.net.
com.                    172800  IN      NS      k.gtld-servers.net.
com.                    172800  IN      NS      l.gtld-servers.net.
com.                    172800  IN      NS      m.gtld-servers.net.
com.                    86400   IN      DS      30909 8 2 E2D3C916F6DEEAC73294E8268FB5885044A833FC5459588F4A9184CF C41A5766
com.                    86400   IN      RRSIG   DS 8 1 86400 20200301050000 20200217040000 33853 . 3UuwCI1zgGKt/j88yw3VYHLcqMD92iG3Ld5Cfxory7JK5NSobA1GTtPL GO6JPjnsqQuNo6IoZRl6lxZr0dTFhL3MaUjQFBvHbLuTnq6gccxTfC71 ljfgJq0SxaN3OA4jtzZkL/B8tiZoRWbuzLFtL7hT+Q/MTWT4VLnJOmX8 ug14qx7ORLJseFT70jNgsXnTUm/2MdSFnQ6r4CmzjXg35X5E5SieR8ws 8TT3oLgn32pFtGHu8rSe5Gtq+UkjTSfvyWCy8jKI9dlnY8s+1FjLt02W IzsILDLHy8IulJQ+vochFTnPb2Nd5ne7FjnAC1LoFoB5rAaU8cSv1TXR +LPghA==
;; Received 1170 bytes from 199.7.83.42#53(l.root-servers.net) in 38 ms

google.com.             172800  IN      NS      ns2.google.com.
google.com.             172800  IN      NS      ns1.google.com.
google.com.             172800  IN      NS      ns3.google.com.
google.com.             172800  IN      NS      ns4.google.com.
CK0POJMG874LJREF7EFN8430QVIT8BSM.com. 86400 IN NSEC3 1 1 0 - CK0Q1GIN43N1ARRC9OSM6QPQR81H5M9A NS SOA RRSIG DNSKEY NSEC3PARAM
CK0POJMG874LJREF7EFN8430QVIT8BSM.com. 86400 IN RRSIG NSEC3 8 2 86400 20200223054910 20200216043910 56311 com. eUQKMnns0yYh9r2lA/4SveJZd2bo9A3pCRacfBZk+uDkurEtLtvN6xKA OcOz7kdaZsnT50rLRVUgheT+yGSsowSr1hdoYZ9zv70y3BkwTuG5IETD jqBDFRu8ngQ6MFGREnhICFWjtCN9LU7K8DWMLCxHaC5thQDElHPoNxAj LbJLdXOUBGbqCLt9xyEFlt7+rVzqnqkv/b5dXE3j+ZcY2A==
S84BDVKNH5AGDSI7F5J0O3NPRHU0G7JQ.com. 86400 IN NSEC3 1 1 0 - S84EDELLAUPA96DT12TJKJN32334NGL3 NS DS RRSIG
S84BDVKNH5AGDSI7F5J0O3NPRHU0G7JQ.com. 86400 IN RRSIG NSEC3 8 2 86400 20200224055158 20200217044158 56311 com. HsR2JMhGNVL1L4x4RRGVsJEGEQWUpW6BidxXmtcCrAB/VL6tOxv2GiZh kW5stDmLHm3VJTuNO0Fxf4jcxZX7Bi7N6BPvcCbQXlUEmsnOUJUAr/nD 3xnvpkIVaJZYsou4lWOIDzHXc+y2/zF16R98VLpJ+tRbC2S/VXTYJToQ akC+tQlPUrn9ghoP2LI+Z4qlOpP2cgRv/RvZ2yTB5js13A==
;; Received 836 bytes from 192.26.92.30#53(c.gtld-servers.net) in 26 ms

google.com.             300     IN      A       74.125.196.101
google.com.             300     IN      A       74.125.196.139
google.com.             300     IN      A       74.125.196.102
google.com.             300     IN      A       74.125.196.138
google.com.             300     IN      A       74.125.196.100
google.com.             300     IN      A       74.125.196.113
;; Received 135 bytes from 216.239.36.10#53(ns3.google.com) in 22 ms
sockstat -l | grep 'unbound' root unbound-co 60771 12 stream /var/run/php-fpm.socket root unbound-co 60771 13 stream /var/run/php-fpm.socket unbound unbound 86974 3 udp6 *:53 *:* unbound unbound 86974 4 tcp6 *:53 *:* unbound unbound 86974 5 udp4 *:53 *:* unbound unbound 86974 6 tcp4 *:53 *:* unbound unbound 86974 7 tcp4 127.0.0.1:953 *:* unbound unbound 86974 12 stream /var/run/php-fpm.socket unbound unbound 86974 13 stream /var/run/php-fpm.socket unbound unbound 86974 23 udp4 ext.ip.addr.x:11297 *:* unbound unbound 86974 25 udp4 ext.ip.addr.x:43951 *:*@johnpoz
If I query from a PC connected to the VLAN it just times out with no response from the DNS server.access-control: 127.0.0.1/32 allow_snoop access-control: ::1 allow_snoop access-control: 10.10.10.1/32 allow access-control: 127.0.0.0/8 allow access-control: ::1/128 allow access-control: 192.168.1.0/24 allow access-control: 192.168.192.0/24 allow access-control: 192.168.10.0/24 allow access-control: 192.168.20.0/24 allow access-control: 192.168.30.0/24 allow access-control: 192.168.40.0/24 allow access-control: 192.168.50.0/24 allow access-control: 192.168.99.0/24 allowAll of the VLAN networks are in there. I don't see any rejections in the firewall log.
-
@Stewart said in Tough time with Unbound:
If I query from a PC connected to the VLAN it just times out with no response from the DNS server.
Well sniff, does pfsense see the query?
With timeout either unbound not listening on the IP your sending the query too, or your traffic not getting to unbound..Firewall rule on the client or the server...
You seem to be listening on all IPs.. So sniff - does pfsense actually see the query when you send it.. And your sending it to the vlan IP of pfsense?
-
@Stewart said in Tough time with Unbound:
I don't see any rejections in the firewall log.
If it's unbound that doesn't accept the queries, and refuses the query because of an "acces-controm" rule, it's normal that the firewall doesn't log.
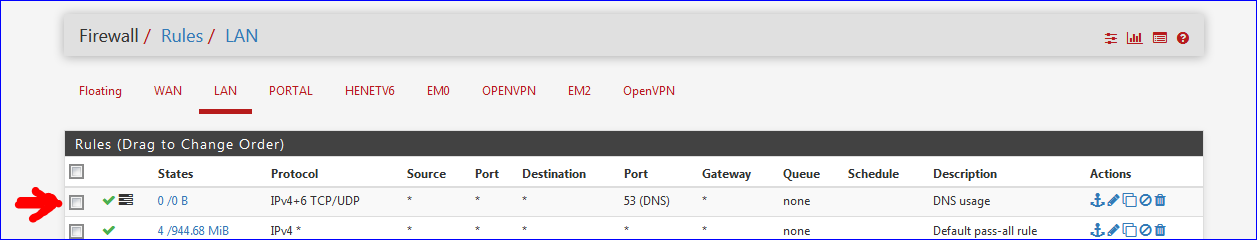
It would be unbound that discards the request. which you could see happening if you crank up the verbosity of the logging of unbound Services > DNS Resolver > Advanced Settings > Log level.It's easy to see if the firewall is doing anything with the DNS traffic. Decalre a pass rule for UDP and TCP, destination port 53. Put the rule at the top on any interface and you'll see the "usage" counter starting to increment.
Like this :
Or de activate the acces-control all together.
edit :
After several seconds in place, see the counter :
-
@Gertjan You know, I've never thought to add those rules just to log if there is traffic. That's a good idea.
I'll need to get back out to the site and do some more testing. I think recall seeing traffic coming into the firewall on port 53 and nothing going out but I ran a lot of captures so I'm not positive. It's a new install. All that's there are 2 Cisco SG250 switches with the VLANs set up on them. IPs are assigned via DHCP from the pfSense box. I can ping the box and log into the interface from the various VLANs. Anything else I should put on my list to check before going out?
-
@Stewart said in Tough time with Unbound:
Anything else I should put on my list to check before going out?
Probably this :
@Stewart said in Tough time with Unbound:
All that's there are 2 Cisco SG250 switches with the VLANs set up on them.
put dumb switches in place, and hard tag your devices so it's using a VLAN ID. This will bypass all setup issues related to these switches.
Btw : never used VLAN's myself, I prefer adding 'just another NIC'. -
@Gertjan Since I can successfully ping and navigate to the IP then the VLANs are set up properly. In the firewall it just shows up as another interface. On the switches you just untag the access VLAN and TAG the rest on the trunks. There really isn't much to it at this level.
-
So I came out onsite and ran some tests. Now NONE of the dig commands work! Crazy!
top -aSH
last pid: 16121;  load averages:  3.07,  3.91,  3.87                                                                                                                                                                 up 3+01:27:52  14:38:09
201 processes: 7 running, 157 sleeping, 37 waiting
CPU: 26.3% user,  0.0% nice, 30.6% system,  5.1% interrupt, 38.0% idle
Mem: 96M Active, 103M Inact, 12K Laundry, 672M Wired, 317M Buf, 3035M Free
Swap: 4096M Total, 513M Used, 3583M Free, 12% Inuse

  PID USERNAME      PRI NICE   SIZE    RES STATE   C   TIME    WCPU COMMAND
23941 root          102    0  6392K  2140K CPU2    2  27:51  98.63% /usr/sbin/syslogd -s -c -c -l /var/dhcpd/var/run/log -P /var/run/syslog.pid -f /etc/syslog.conf
   11 root          155 ki31     0K    64K RUN     0  57.3H  50.41% [idle{idle: cpu0}]
   11 root          155 ki31     0K    64K CPU3    3  55.8H  37.81% [idle{idle: cpu3}]
   11 root          155 ki31     0K    64K RUN     1  53.7H  35.18% [idle{idle: cpu1}]
39062 unbound        44    0   100M 81476K CPU1    1   0:14  33.34% /usr/local/sbin/unbound -c /var/unbound/unbound.conf{unbound}
39062 unbound        46    0   100M 81476K umtxn   3   0:14  33.27% /usr/local/sbin/unbound -c /var/unbound/unbound.conf{unbound}
39062 unbound        45    0   100M 81476K umtxn   3   0:14  33.24% /usr/local/sbin/unbound -c /var/unbound/unbound.conf{unbound}
39062 unbound        42    0   100M 81476K umtxn   1   5:35  32.93% /usr/local/sbin/unbound -c /var/unbound/unbound.conf{unbound}
Logs are empty in the GUI. Enabled advanced logging in the GUI which caused the service to restart I suppose. Now resolution works, but only on the second try. If I try to go to, say, arstechnica.com, it won't load the first time. Wireshark shows me:
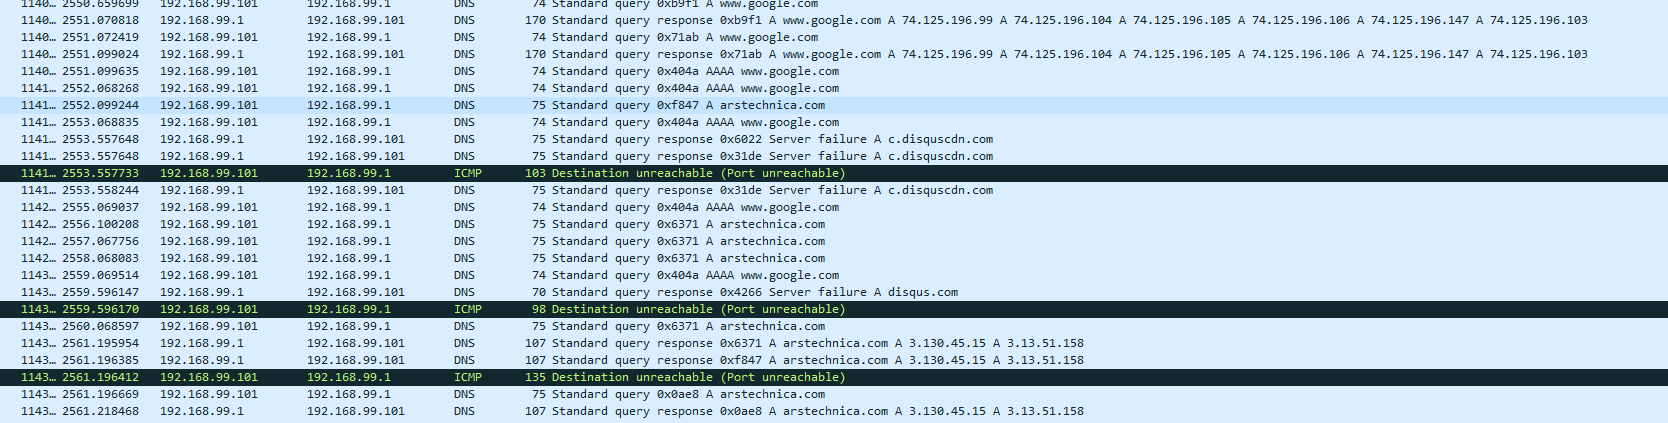 If I reload the page it'll come up, but slowly, sometimes.
At the moment unbound is taking up most of the CPU:
last pid: 26202;  load averages:  4.30,  3.64,  3.12                                                                                                                                                                 up 3+01:57:31  15:07:48
237 processes: 7 running, 193 sleeping, 37 waiting
CPU: 39.6% user,  0.0% nice, 29.7% system,  6.5% interrupt, 24.2% idle
Mem: 1437M Active, 209M Inact, 12K Laundry, 745M Wired, 370M Buf, 1516M Free
Swap: 4096M Total, 511M Used, 3585M Free, 12% Inuse

  PID USERNAME      PRI NICE   SIZE    RES STATE   C   TIME    WCPU COMMAND
23941 root           99    0  6392K  2140K CPU0    0  46:36  89.78% /usr/sbin/syslogd -s -c -c -l /var/dhcpd/var/run/log -P /var/run/syslog.pid -f /etc/syslog.conf
13662 unbound        81    0 63396K 51684K CPU2    2   1:31  31.61% /usr/local/sbin/unbound -c /var/unbound/unbound.conf{unbound}
13662 unbound        52    0 63396K 51684K umtxn   3   1:32  30.94% /usr/local/sbin/unbound -c /var/unbound/unbound.conf{unbound}
13662 unbound        52    0 63396K 51684K umtxn   2   4:55  30.82% /usr/local/sbin/unbound -c /var/unbound/unbound.conf{unbound}
13662 unbound        52    0 63396K 51684K umtxn   2   1:31  29.71% /usr/local/sbin/unbound -c /var/unbound/unbound.conf{unbound}
running clog tells me some more:
Feb 17 15:08:41 GateKeeper unbound: [13662:0] info: 63vRDCDd mod1  ns5-65.akam.net. AAAA IN
Feb 17 15:08:41 GateKeeper unbound: [13662:3] info: mesh_run: end 153 recursion states (17 with reply, 84 detached),                                                                                                                         51 waiting replies, 28 recursion replies sent, 0 replies dropped, 0 states jostled out
Feb 17 15:08:41 GateKeeper unbound: [13662:2] debug: EDNS lookup known=0 vs=0
Feb 17 15:08:41 GateKeeper unbound: [13662:3] info: average recursion processing time 45.800638 sec
Feb 17 15:08:41 GateKeeper unbound: [13662:2] debug: serviced query UDP timeout=376 msec
Feb 17 15:08:41 GateKeeper unbound: [13662:3] info: histogram of recursion processing times
Feb 17 15:08:41 GateKeeper unbound: [13662:2] debug: inserted new pending reply id=89af
Feb 17 15:08:41 GateKeeper unbound: [13662:3] info: [25%]=1e-06 median[50%]=44.8 [75%]=72
Feb 17 15:08:41 GateKeeper unbound: [13662:2] debug: Need to send query but have no outgoing interfaces of that famil                                                                                                                        y
Feb 17 15:08:41 GateKeeper unbound: [13662:2] info: error sending query to auth server ip6 2620:0:34::53 port 53 (len                                                                                                                         28)
Feb 17 15:08:41 GateKeeper unbound: [13662:3] info:    1.000000    2.000000 1
Feb 17 15:08:41 GateKeeper unbound: [13662:1] debug: servselect ip4 192.31.80.30 port 53 (len 16)
Feb 17 15:08:41 GateKeeper unbound: [13662:2] info: processQueryTargets: ns1.msft.net. A IN
Feb 17 15:08:41 GateKeeper unbound: [13662:0] info: 70vRDCD mod1  ns-1471.awsdns-55.org. AAAA IN
Feb 17 15:08:41 GateKeeper unbound: [13662:3] info:   16.000000   32.000000 2
Feb 17 15:08:41 GateKeeper unbound: [13662:1] debug:    rtt=68675
Feb 17 15:08:41 GateKeeper unbound: [13662:2] debug: processQueryTargets: targetqueries 0, currentqueries 0 sentcount                                                                                                                         16
Feb 17 15:08:41 GateKeeper unbound: [13662:3] info:   32.000000   64.000000 10
Feb 17 15:08:41 GateKeeper unbound: [13662:2] info: DelegationPoint<msft.net.>: 4 names (0 missing), 8 addrs (4 resul                                                                                                                       t, 0 avail) cacheNS
Feb 17 15:08:41 GateKeeper unbound: [13662:3] info:   64.000000  128.000000 8
Feb 17 15:08:41 GateKeeper unbound: [13662:1] debug:    rtt=54538
Feb 17 15:08:41 GateKeeper unbound: [13662:2] info:   ns4.msft.net. * A AAAA
Feb 17 15:08:41 GateKeeper unbound: [13662:0] info: 73vRDCD mod1  ns-1627.awsdns-11.co.uk. AAAA IN
Feb 17 15:08:41 GateKeeper unbound: [13662:3] info: 0vRDCD mod1  ns.bahnhof.net. A IN
Feb 17 15:08:41 GateKeeper unbound: [13662:1] debug: servselect ip4 192.33.14.30 port 53 (len 16)
Feb 17 15:08:41 GateKeeper unbound: [13662:2] info:   ns2.msft.net. * A AAAA
Feb 17 15:08:41 GateKeeper unbound: [13662:0] info: 74vRDCD mod1  ns-1655.awsdns-14.co.uk. AAAA IN
Feb 17 15:08:41 GateKeeper unbound: [13662:3] info: 1vRDCD mod1  ns1.azprdmig.msft.net. A IN
Feb 17 15:08:41 GateKeeper unbound: [13662:1] debug:    rtt=43107
Feb 17 15:08:41 GateKeeper unbound: [13662:2] info:   ns1.msft.net. * A AAAA
Feb 17 15:08:41 GateKeeper unbound: [13662:0] info: 75vRDCDd mod1  ns-1870.awsdns-41.co.uk. AAAA IN
Feb 17 15:08:41 GateKeeper unbound: [13662:3] info: 2vRDCD mod1  ns2.bahnhof.net. A IN
Feb 17 15:08:41 GateKeeper unbound: [13662:1] debug: servselect ip4 192.5.6.30 port 53 (len 16)
Feb 17 15:08:41 GateKeeper unbound: [13662:2] info:   ns3.msft.net. * A AAAA
Feb 17 15:08:41 GateKeeper unbound: [13662:0] info: 76vRDCD mod1  ns1-201.azure-dns.com. AAAA IN
Feb 17 15:08:41 GateKeeper unbound: [13662:3] info: 3vRDCD mod1  ns2.azprdmig.msft.net. A IN
Feb 17 15:08:41 GateKeeper unbound: [13662:1] debug:    rtt=47876
Feb 17 15:08:41 GateKeeper unbound: [13662:2] debug:    ip6 2620:0:34::53 port 53 (len 28)
Feb 17 15:08:41 GateKeeper unbound: [13662:0] info: 77vRDCD mod1  ns1prod.6893.azuredns-prd.org. AAAA IN
The "Need to send query but have no outgoing interfaces of that family" concerns me.
Along with "error sending query to auth server" -
Why would unbound be using that much cpu... That is nuts..
As to your auth error, that is ns3.msft.net, yeah its an authoritative ns.. for msft.net
looks like you have some issue for sure.. Why don't you stop unbound.. And then restart it... you should not be using anywhere close to that amount of cpu.. All 4 threads?
-
@johnpoz I've restarted the whole firewall with no help. My laptop is currently the only thing on the network besides the 2 switches and the firewall. I don't even know where to look to troubleshoot. There's nothing in the logs. I'm currently disabling everything. Suricata and pfblockerNG are now both off.
I do have a theory, though. Running sockstat -l | grep unbound showed 386 responses. This is a new laptop and I had uTorrent running in the background from when I was re-downloading all my updated ISOs. Once I closed it it dropped down to 15 responses and things are working normally, at least for now. Am I running out of resources?
Edit: If that's the case then I'm concerned 1 laptop can take down the whole shebang. I've had clients with old ASAs and RV units that buckle under someone running a torrent. This is the first time I've seen it affect pfSense, if that's the case.
-
You had your utorrent client looking up every single IP in the swarm it was talking too - hehehe!! While yeah that can be a lot of queries... Shouldn't be too many to be honest..
Unless your having issues with resolving - but then again PTRs for these IPs that most likely do not resolve will force time outs and retries, etc..
Yeah trying to resolve the PTR for the hundreds if not 1000's of IPs you might talk to in p2p swarm - yeah that could be problematic...
edit: its not the torrents.. its the DNS queries that don't resolve and then waiting for timeouts, and then retrying, etc. Not like you get back NX or something... Freaking p2p swarm is going to have a ton of shit ips everyone using vpns, etc. that don't have any ptrs set, etc. etc..
Yeah doing 1000's of shit dns queries can be problematic ;)
-
@johnpoz If that's what it is, how do I combat it? We can't have 1 rogue laptop take down the network. I'm looking at the options in the Advanced tab and shifting them all higher, but which will actually help?
-
No you just need to make sure your dns can handle it... Change the settings, more threads, etc.. Maybe not run dns on pfsense - run it on some other box if your pfsense box is not up to high levels of dns queries..
Look maybe you have some bad setup with ipv6 that your trying to use.. ??? Your average recursion time is was horrible..
Here is mine
Feb 17 07:56:26 unbound 72571:0 info: average recursion processing time 0.274979 sec -
@johnpoz I pushed up Advanced settings to:
Cache Size: 20MB
Outgoing TCP Buffers: 50
Incoming TCP Buffers: 50
Number of Queries per Thread: 2048
I then saved and opened up my uTorrent to see what happens. It's been running for a few minutes now and haven't seen any spikes.clog -f /var/log/resolver.log | grep "average recursion" Feb 17 16:22:37 GateKeeper unbound: [77568:0] info: average recursion processing time 0.133651 sec Feb 17 16:22:37 GateKeeper unbound: [77568:0] info: average recursion processing time 0.140601 sec Feb 17 16:22:37 GateKeeper unbound: [77568:0] info: average recursion processing time 0.163783 sec Feb 17 16:22:37 GateKeeper unbound: [77568:0] info: average recursion processing time 0.149740 secRecursion time is also very quick now.