Increased Memory and CPU Spikes (causing latency/outage) with 2.4.5
-
@t41k2m3
I posted above two commands that you can use to find what is using memory. Report back with what you find. I haven't spent much time with the release of 2.4.5 as things have been hectic. I haven't checked if the version of Unbound has changed from 2.4.3/4. That might be a reason if something has changed in the Resolver code.
In regards to the upcoming Unbound python integration, what you see in the Resolver settings will allow for a future release to integrate with the Resolver. It's just the plumbing and nothing else. There is no Python integration released yet. -
Hi, thanks for the prompt reply.
Currently running version 2.1.4_21 as installed from pfSense's package manager.
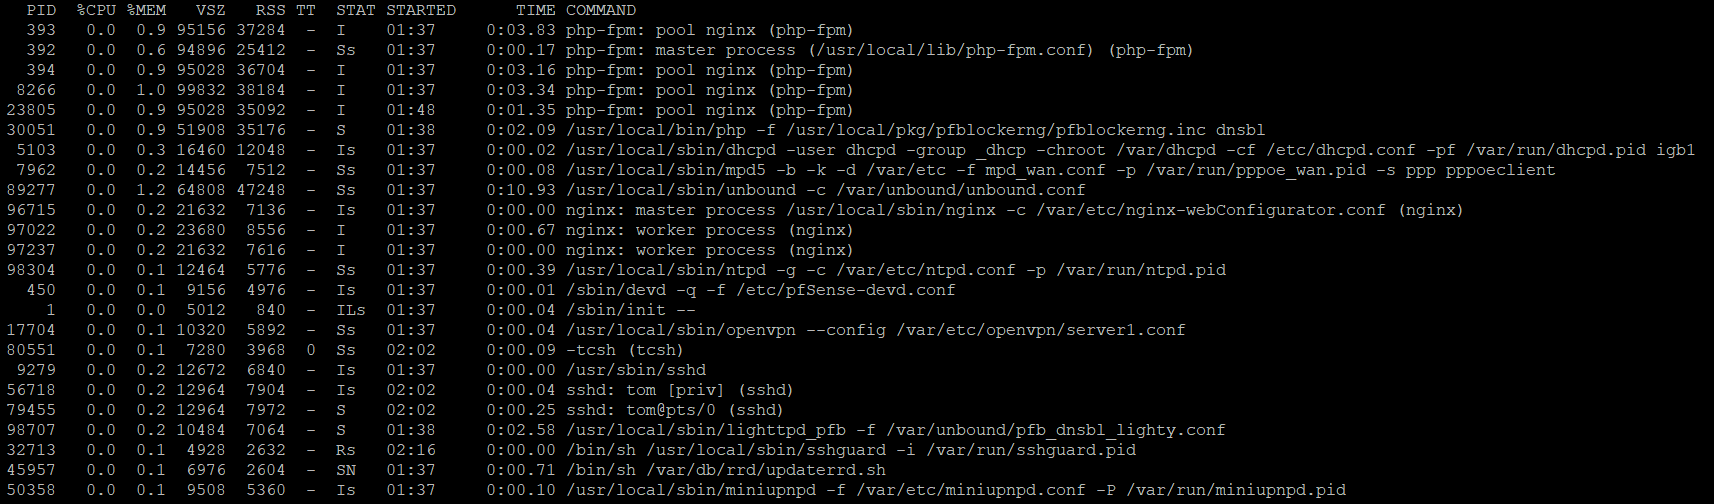
Output of ps auxwww sorted by memory usage:
Output of top -aSH sorted by size
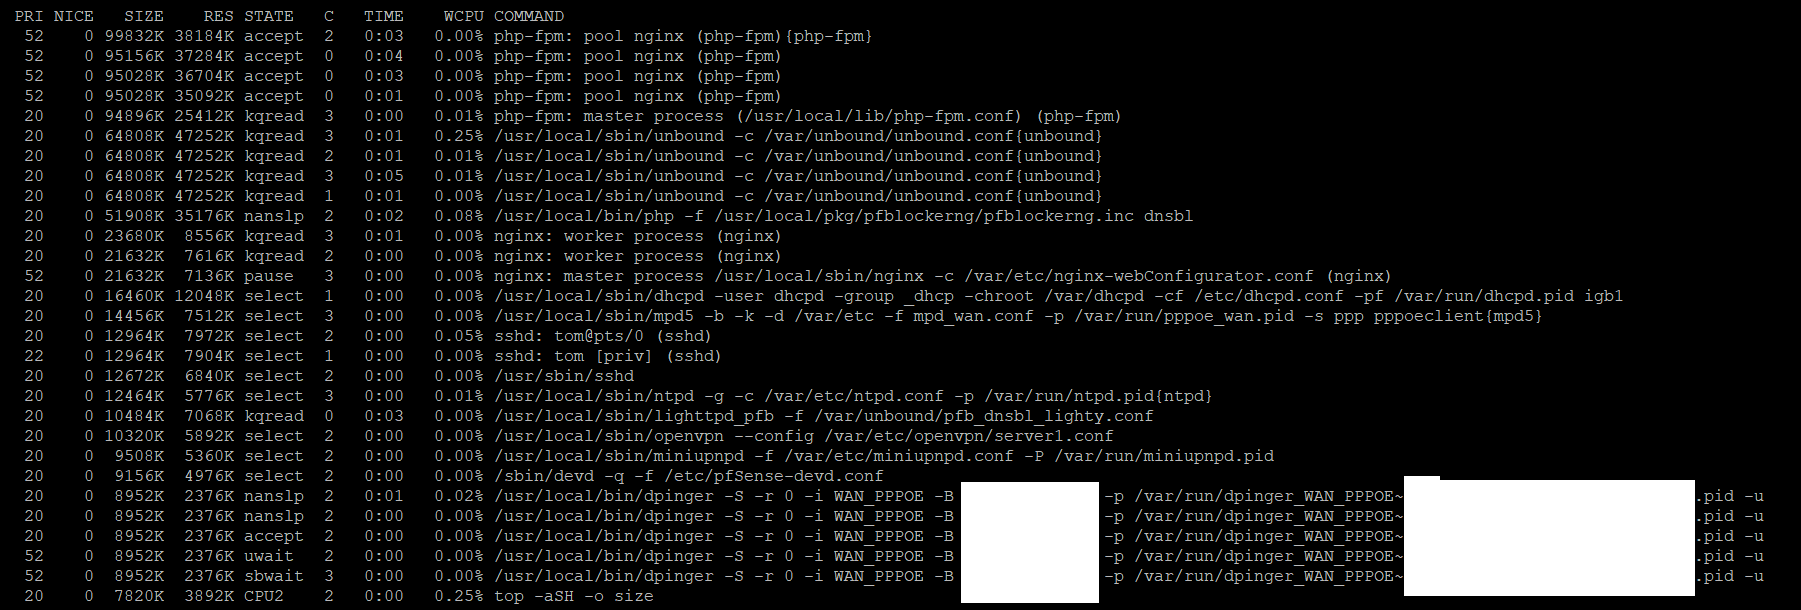
Reboot does not appear to change anything, will just go try the devel version. Hope that helps.
-
@ScottishTom
Would recommend to uninstall pfBlockerNG and install pfBlockerNG-devel. Then see how that goes. Ensure "Keep settings" is enabled. You will need to re-enter the MaxMind key into the IP tab. Also best to reboot to clear Unbound. -
Have done as requested, now running pfBlockerNG-devel 2.2.5_29.
-
uninstalled pfBlockerNG
-
installed pfBlockerNG-devel
-
rebooted
-
force-updated DNSBL as it was complaining about being out of date.
-
rebooted again
Still appear to be at ~64-65% memory usage
FWIW I'm not complaining at all personally, the software is working fine for me and I'm seeing packets being intercepted by the block lists. Just seems strange to have had an almost 10x memory usage increase.
Appreciate the blocker software and your work on it very much, really simplifies things :)
-
-
@ScottishTom
Thanks for reporting back. Will check it out tomorrow. -
I'm getting the same thing with Hyper-V host, 2 deticated NICs all offloading turned off.
Interesting tidbit is that with me if I make any settings change and save it, it hanges for 20-30 seconds then pins the CPU, pings even over the lan to pfSense won't respond. Then it slowly comes back.
I have OpenVPN running but had no issues with 2.4.4. In the OpenVPN logs there is now an endless stream of: AEAD Decrypt error: bad packet ID (may be a replay): that weren't there before. The System time is correct.
AES-NI On or off doesn't make a difference (even after restart)
Internet is PPPoE if that makes a difference.
Download speed is normal. Upload speed is about half of what it should be compared to 2.4.4.
Note traffic shaper is enabled and I have some floating rules for Google Hangouts.
-
One thing to try would be to disable the Spectre/Meltdown mitigation, reboot, and see if that improves things.
I wonder if improvements have been made to it in FreeBSD 11.3 but those improvements maybe don't play well with virtualisation.I'm not in a position to test at the moment, can anyone else give this idea a go?
-
@muppet I just disabled the meltdown mitigation, rebooted. Still have 100% CPU
-
I'm experiencing similar issues with 2.4.5. My CPU usage spikes to 100% anytime I access a website and causes an outage for about 20 seconds.
Specs:
Proxmox 6.1-8
CPU: 8 vCPUs
Memory: 8GBPackages:
acme 0.6.5
Avahi 2.1_1
openvpn-client-export 1.4.20
pfBlockerNG 2.1.4_21
Service_Watchdog 1.8.6
snort 3.2.9.10_2
softflowd 1.2.6
squid 0.4.44_15
Status_Traffic_Totals 2.3.1 -
I finally got my Hyper-V virtualized install back to mostly working by removing all IP alias lists that PFBlocker had created, except one that was critical for me. Once this was done, I only get 100% cpu for a second or two during the times pfctl runs. I can deal with that over the 5 minutes lockups that were occuring before.
-
@BBcan177 said in Increased Memory and CPU Spikes (causing latency/outage) with 2.4.5:
@ScottishTom
Thanks for reporting back. Will check it out tomorrow.@BBcan177 realizing this is going to sound somewhat odd... everything went back to normal on its own over night (typical state prior to the 2.4.5 upgrade - i.e. memory usage around 20%). None of the other issues - e.g. CPU spikes, latency, outage - manifested themselves on this setup. Also implemented your fix for Shalla and UT1 found here: https://forum.netgate.com/topic/151689/shallalist-and-ut1-lists-not-working-on-2-4-5-release-pfblockerng-devel-2-2-5_29
Thanks for your help debugging. -
Hi,
I reverted 3 upgrades already due to performance issues, all 3 uses pfblocker, 2 are virtualized with vmware and one with hyper-v (gen 1 vm).
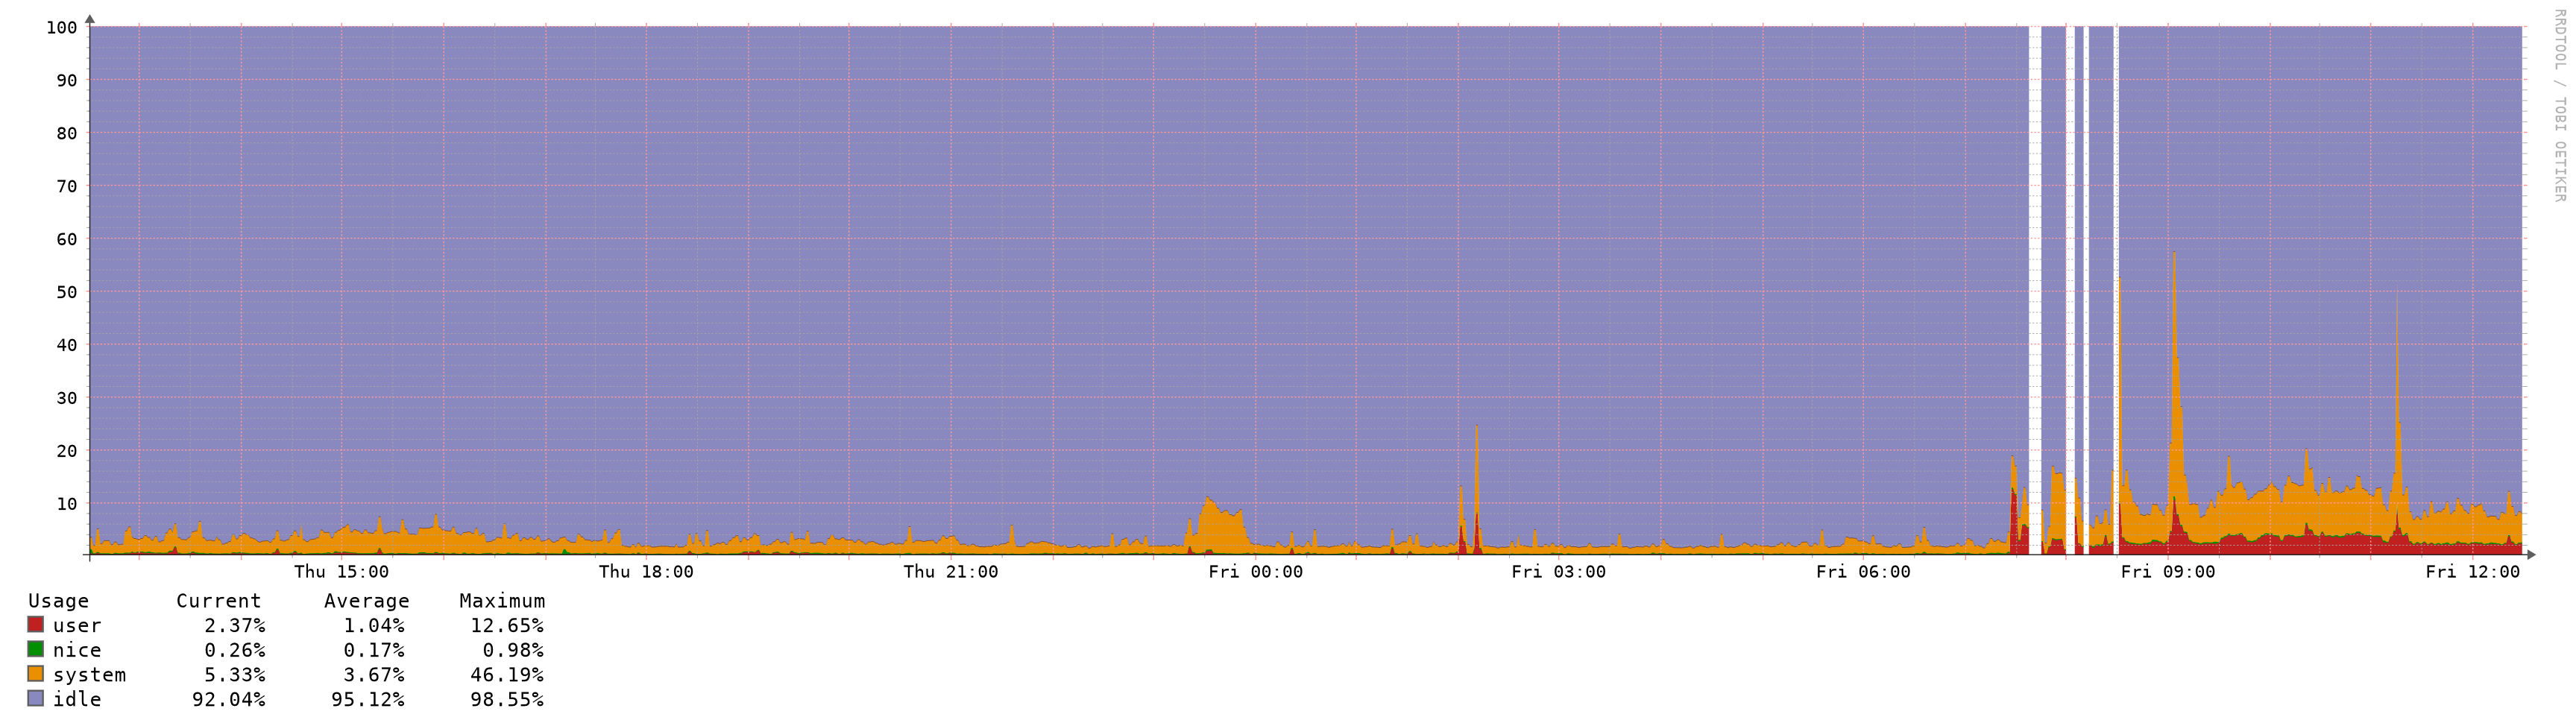
Look at the before/after graphs, impossible to upgrade to be honest:
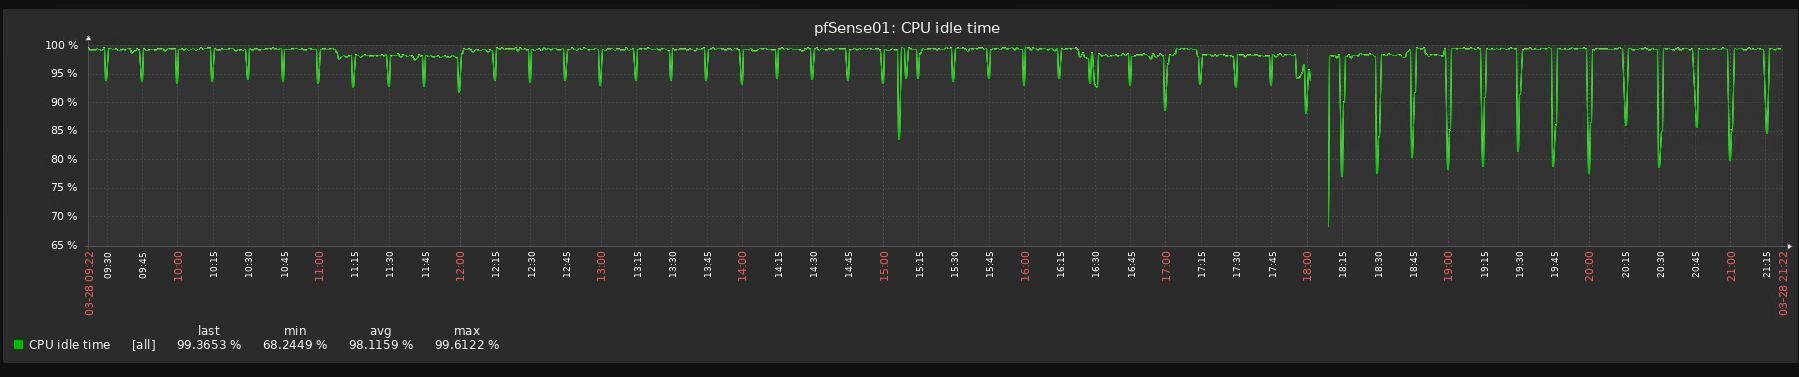
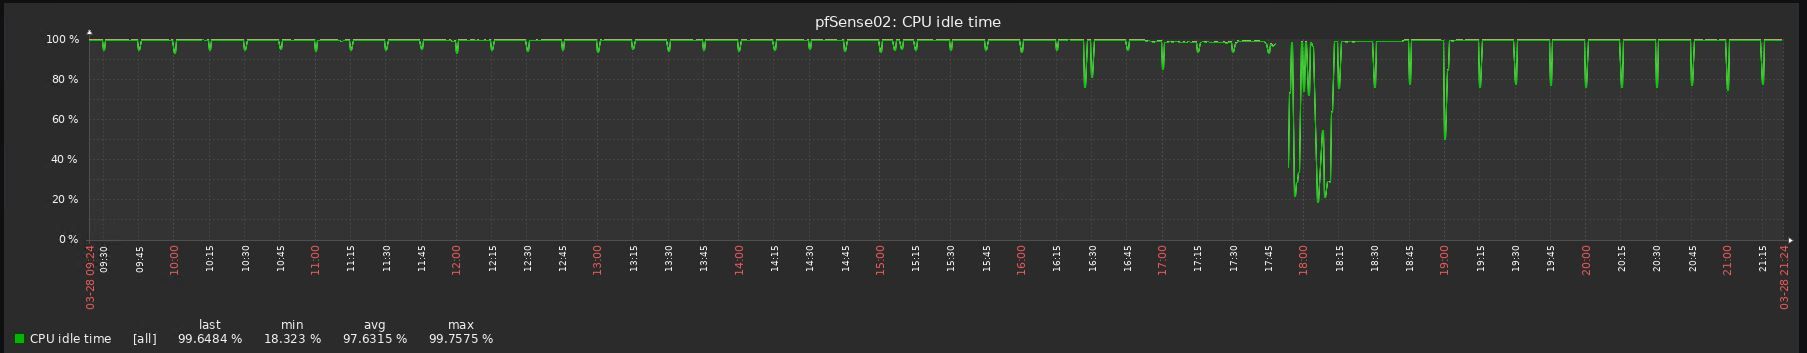
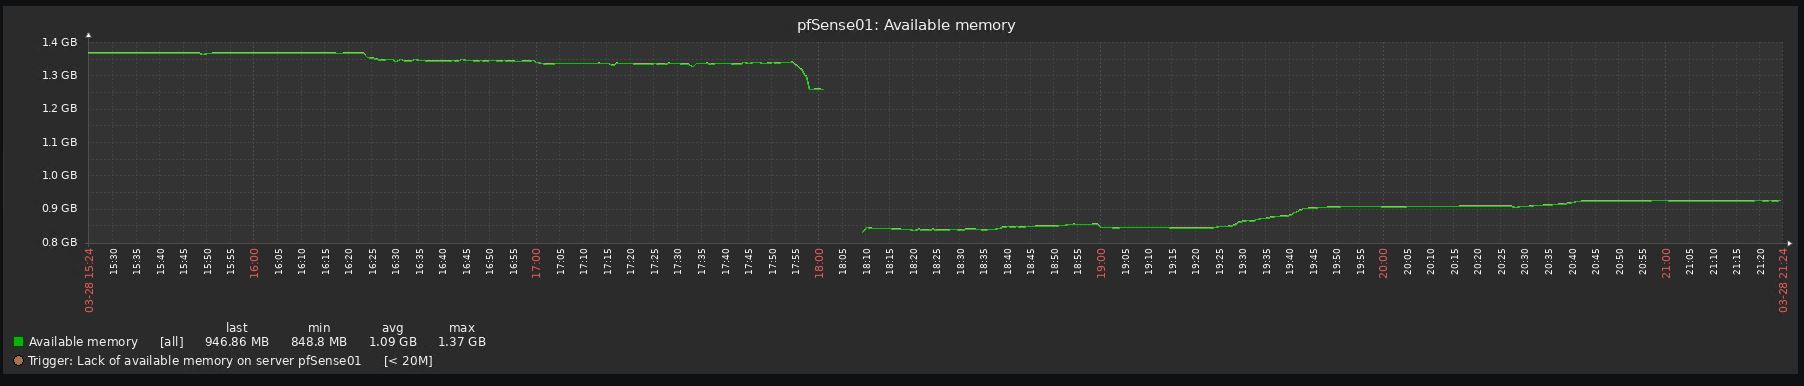
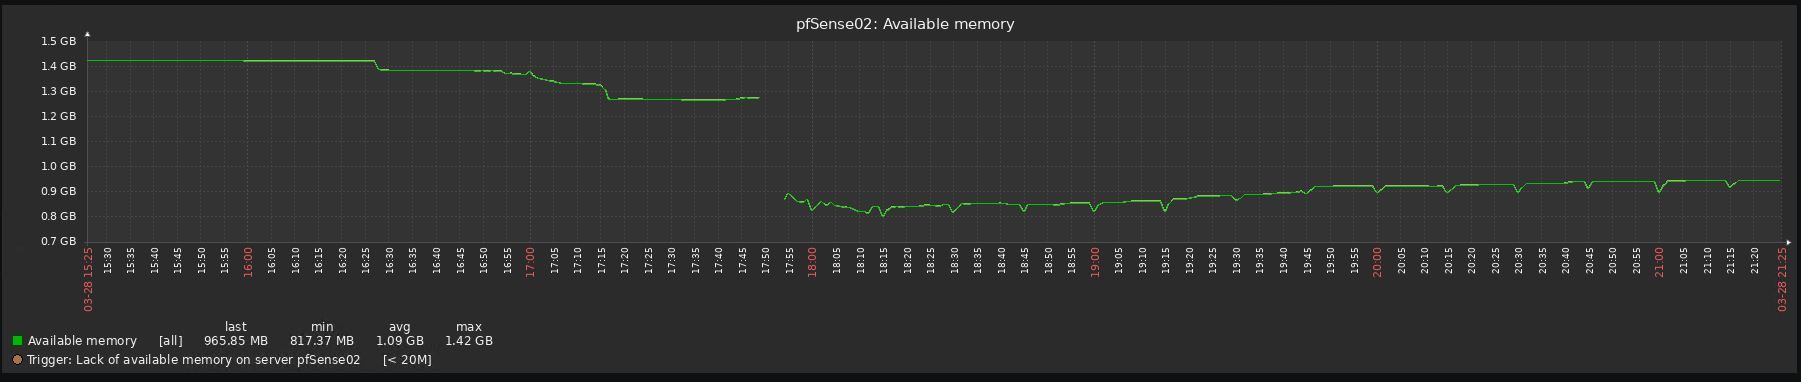
-
The new release is like how the RC was for me 100% CPU usage locks the system up so you can't do anything. I did a fresh install no packages less than 6 firewall rules and basic setup for routing and it started locking up today lasted about 2 days before I had to roll back to 2.4.4; only thing I changed was the subnet.
I'm running proxmox with:
CPU(s)
24 x Intel(R) Xeon(R) CPU X5675 @ 3.07GHz (2 Sockets)
Kernel VersionLinux 5.3.10-1-pve #1 SMP PVE 5.3.10-1 (Thu, 14 Nov 2019 10:43:13 +0100)
PVE Manager Versionpve-manager/6.1-3/37248ce6
-
I also did an upgrade from 2.4.4p3 to 2.4.5 that failed to run smoothly after. I had to roll back immediately.
Running PFBlockerNG and OpenVPN Export packages and running OpenVPN Server and client.
Virtual Machine VM running on Windows Server 2016 with 1GB RAM.
Will delete packages, disable OpenVPN and add another 1GB memory and see if it goes any better. -
Out of curiosity, can the users experiencing Increased memory and CPU spikes in 2.4.5 try to increase this setting?
Start at 2M and go up from there.
pfSense > Advanced > Firewall & NAT > Firewall Maximim Table Entries
A "Filter Reload" should be sufficient, but a reboot may be necessary to enable the change.
-
Just for reference, I've upgraded few hours ago my CARP nodes:
- ESXi 6.7U3, 1 Virtual CPU, 1GB RAM
- Packages => avahi, bandwidthd, cron, FTP_Client_Proxy, mailreport, nmap, Open-VM-Tools, openvpn-client-export, pfBlockerNG-devel, RRD_Summary
- GeoIP not used in pfBlocker, only DNSBL
- Firewall Maximim Table Entries already set at 5M
RAM usage (from inside pfSense) it's more or less the same at around 80%, CPU usage looks even a little bit better (from ESXi):
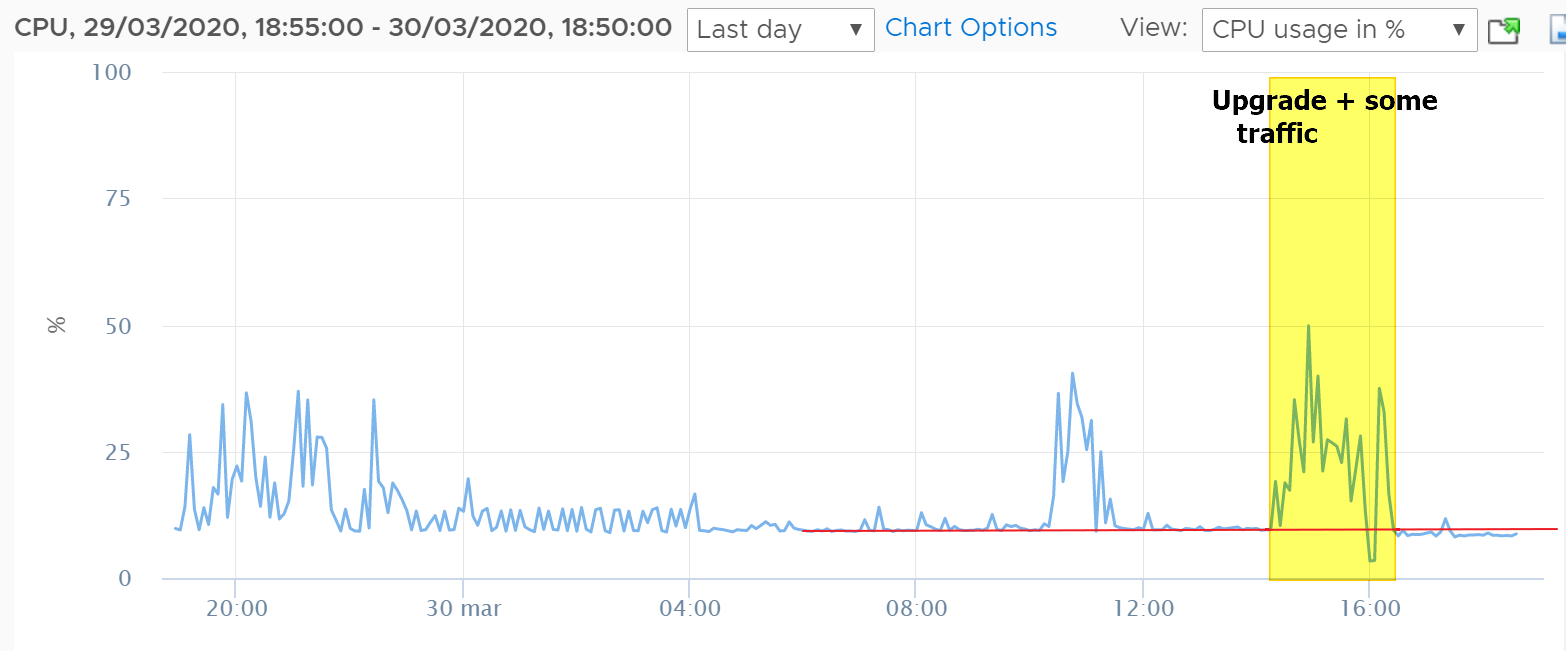
No other issues with latency/filter reload etc..
-
@BBcan177 said in Increased Memory and CPU Spikes (causing latency/outage) with 2.4.5:
Out of curiosity, can the users experiencing Increased memory and CPU spikes in 2.4.5 try to increase this setting?
Start at 2M and go up from there.
pfSense > Advanced > Firewall & NAT > Firewall Maximim Table Entries
A "Filter Reload" should be sufficient, but a reboot may be necessary to enable the change.
@BBcan177 spoke too soon as mem spikes problems are back... updated to devel 2.2.5_30 and increased max table entries as you suggested to 2.5 and 3.0 M.
Neither made a significant dent in that mem usage stays at or around 80%. One piece of good news is functionality degradation seems to not happen (other than fitful keystroke lag in ssh, no or limited latency or packet loss).
Looking at ps and top results per your request, found the following (suggesting unbound is the culprit, perhaps together with or partly due to the size of DNSBL entries):
ps -auxwwwm
USER PID %CPU %MEM VSZ RSS TT STAT STARTED TIME COMMAND
unbound 5896 0.0 47.7 7398308 3973492 - Ss 11:59 0:31.38 unbound -c unbound.confNotice high % of MEM (47%, second highest process is at 3%)
top -aSH -o size
PID USERNAME PRI NICE SIZE RES STATE C TIME WCPU COMMAND
5896 unbound 20 0 7225M 3880M kqread 0 0:31 0.00% unbound -c unbound.conf{unbound}
5896 unbound 20 0 7225M 3880M kqread 2 0:00 0.00% unbound -c unbound.conf{unbound}
5896 unbound 20 0 7225M 3880M kqread 2 0:00 0.00% unbound -c unbound.conf{unbound}
5896 unbound 20 0 7225M 3880M kqread 2 0:00 0.00% unbound -c unbound.conf{unbound}Notice high SIZE (second highest process uses about 11% of an unbound thread utilization)
You had also mentioned earlier that you were not sure what had changed in 2.4.5 as far as unbound. From what I am seeing, unbound was upgraded from 1.9.1 to 1.9.6 (w/python support). Please let me know if any of this data may trigger any ideas on what to look for further to debug this thing.
-
@t41k2m3
Do you have TLD enabled in DNSBL? How many domains are enabled in DNSBL? You can post the snipet from the pfblockerng.log when DNSBL updates.To compare memory usage, you need to see how it was in previous pfSense versions? DNSBL will consume memory depending on how its setup in Unbound.
Also the changelog in Unbound is huge:
https://nlnetlabs.nl/projects/unbound/download/ -
@BBcan177 said in Increased Memory and CPU Spikes (causing latency/outage) with 2.4.5:
@t41k2m3
Do you have TLD enabled in DNSBL? How many domains are enabled in DNSBL? You can post the snipet from the pfblockerng.log when DNSBL updates.To compare memory usage, you need to see how it was in previous pfSense versions? DNSBL will consume memory depending on how its setup in Unbound.
Also the changelog in Unbound is huge:
https://nlnetlabs.nl/projects/unbound/download/To asnwer your questions (same settings pre/post upgrade):
DNSBL TLD enabled - yes;
DNSBL Domain/IP Counts: ~1M
Alias table IP Counts: ~330K
pfsense Table Usage Count: ~330K
based on empirical data prior to upgrading and Status - Monitoring of System Memory post upgrade, memory usage was around 20% before and may oscillate between 65-80% after upgrade (except period it went back to normal). -
@BBcan177
Mine was already at 4milion max states and 6million max tables entries and mbuf 1milion, same as it has been for 5+ years. (4x-cpu, 4GB-ram)
I tried fresh VM loads with/without config restore, no added packages, no aliases and it seems worse with more firewall rules and services enabled and that's with no traffic passing through, as you add packages that have rules and restart other services it gets worse x10.
example, just changing unbound settings and saving other config pages causes the same issues, but not as bad, also disabled unbound and tried forwarder, changing other various settings still causes it to do the same.
other example, pfblocker really aggravates it with maxmind code entered and the cron-csv update enabled(unchecked), but it's sure not the root cause, just a nasty symptom and it really lags on reboot/cold start up.
tried a vm with 8GB ram and the states/table entries/mbuf way higher yet, with no change, none ever show above
mostly tested on esxi 6.5 host using vmxnet3 adapters.
also tested an upgrade and fresh load/no config restore with latest vbox on windows 10, with same exact issues cropping up.
I couldn't hit the same issue on old bare hardware upgrade (core 2 Q8400, 4GB ram)
all the issues result in PHP hanging for long periods eating cpu, load averages climb to the moon 10.x and higher, ping latency goes up and wan starts flapping exacerbating the issue further. if you leave it sit long enough it sometimes straightens out or I noticed I started pulling traffic through and it suddenly jumps the latency down and works for a while. I tried disabling gateway monitor actions and it helps because wan doesn't flap, but the issue still remains.
I never thought to try single CPU vm's and after so many lagged aggravating tests, I don't want to play anymore.