Increased Memory and CPU Spikes (causing latency/outage) with 2.4.5
-
Out of curiosity, can the users experiencing Increased memory and CPU spikes in 2.4.5 try to increase this setting?
Start at 2M and go up from there.
pfSense > Advanced > Firewall & NAT > Firewall Maximim Table Entries
A "Filter Reload" should be sufficient, but a reboot may be necessary to enable the change.
-
Just for reference, I've upgraded few hours ago my CARP nodes:
- ESXi 6.7U3, 1 Virtual CPU, 1GB RAM
- Packages => avahi, bandwidthd, cron, FTP_Client_Proxy, mailreport, nmap, Open-VM-Tools, openvpn-client-export, pfBlockerNG-devel, RRD_Summary
- GeoIP not used in pfBlocker, only DNSBL
- Firewall Maximim Table Entries already set at 5M
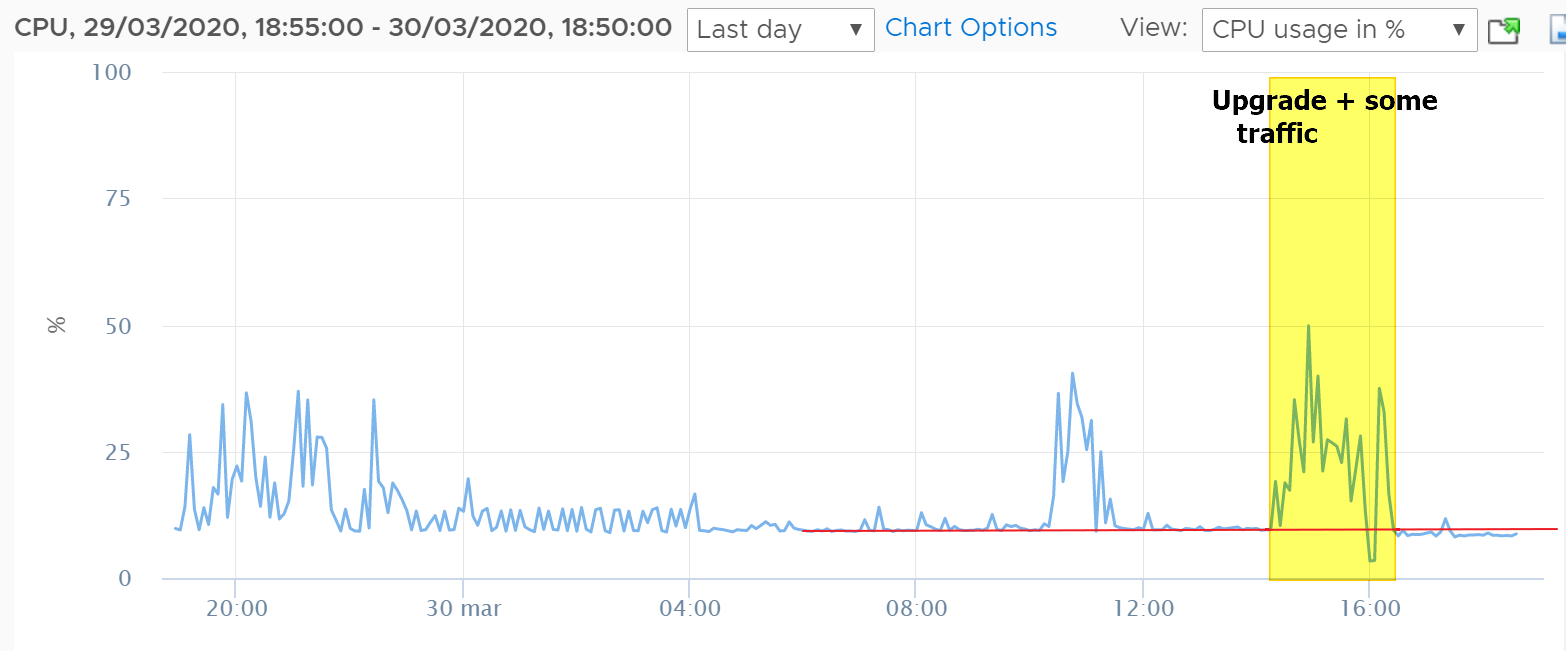
RAM usage (from inside pfSense) it's more or less the same at around 80%, CPU usage looks even a little bit better (from ESXi):

No other issues with latency/filter reload etc..
-
@BBcan177 said in Increased Memory and CPU Spikes (causing latency/outage) with 2.4.5:
Out of curiosity, can the users experiencing Increased memory and CPU spikes in 2.4.5 try to increase this setting?
Start at 2M and go up from there.
pfSense > Advanced > Firewall & NAT > Firewall Maximim Table Entries
A "Filter Reload" should be sufficient, but a reboot may be necessary to enable the change.
@BBcan177 spoke too soon as mem spikes problems are back... updated to devel 2.2.5_30 and increased max table entries as you suggested to 2.5 and 3.0 M.
Neither made a significant dent in that mem usage stays at or around 80%. One piece of good news is functionality degradation seems to not happen (other than fitful keystroke lag in ssh, no or limited latency or packet loss).
Looking at ps and top results per your request, found the following (suggesting unbound is the culprit, perhaps together with or partly due to the size of DNSBL entries):
ps -auxwwwm
USER PID %CPU %MEM VSZ RSS TT STAT STARTED TIME COMMAND
unbound 5896 0.0 47.7 7398308 3973492 - Ss 11:59 0:31.38 unbound -c unbound.confNotice high % of MEM (47%, second highest process is at 3%)
top -aSH -o size
PID USERNAME PRI NICE SIZE RES STATE C TIME WCPU COMMAND
5896 unbound 20 0 7225M 3880M kqread 0 0:31 0.00% unbound -c unbound.conf{unbound}
5896 unbound 20 0 7225M 3880M kqread 2 0:00 0.00% unbound -c unbound.conf{unbound}
5896 unbound 20 0 7225M 3880M kqread 2 0:00 0.00% unbound -c unbound.conf{unbound}
5896 unbound 20 0 7225M 3880M kqread 2 0:00 0.00% unbound -c unbound.conf{unbound}Notice high SIZE (second highest process uses about 11% of an unbound thread utilization)
You had also mentioned earlier that you were not sure what had changed in 2.4.5 as far as unbound. From what I am seeing, unbound was upgraded from 1.9.1 to 1.9.6 (w/python support). Please let me know if any of this data may trigger any ideas on what to look for further to debug this thing.
-
@t41k2m3
Do you have TLD enabled in DNSBL? How many domains are enabled in DNSBL? You can post the snipet from the pfblockerng.log when DNSBL updates.To compare memory usage, you need to see how it was in previous pfSense versions? DNSBL will consume memory depending on how its setup in Unbound.
Also the changelog in Unbound is huge:
https://nlnetlabs.nl/projects/unbound/download/ -
@BBcan177 said in Increased Memory and CPU Spikes (causing latency/outage) with 2.4.5:
@t41k2m3
Do you have TLD enabled in DNSBL? How many domains are enabled in DNSBL? You can post the snipet from the pfblockerng.log when DNSBL updates.To compare memory usage, you need to see how it was in previous pfSense versions? DNSBL will consume memory depending on how its setup in Unbound.
Also the changelog in Unbound is huge:
https://nlnetlabs.nl/projects/unbound/download/To asnwer your questions (same settings pre/post upgrade):
DNSBL TLD enabled - yes;
DNSBL Domain/IP Counts: ~1M
Alias table IP Counts: ~330K
pfsense Table Usage Count: ~330K
based on empirical data prior to upgrading and Status - Monitoring of System Memory post upgrade, memory usage was around 20% before and may oscillate between 65-80% after upgrade (except period it went back to normal). -
@BBcan177
Mine was already at 4milion max states and 6million max tables entries and mbuf 1milion, same as it has been for 5+ years. (4x-cpu, 4GB-ram)
I tried fresh VM loads with/without config restore, no added packages, no aliases and it seems worse with more firewall rules and services enabled and that's with no traffic passing through, as you add packages that have rules and restart other services it gets worse x10.
example, just changing unbound settings and saving other config pages causes the same issues, but not as bad, also disabled unbound and tried forwarder, changing other various settings still causes it to do the same.
other example, pfblocker really aggravates it with maxmind code entered and the cron-csv update enabled(unchecked), but it's sure not the root cause, just a nasty symptom and it really lags on reboot/cold start up.
tried a vm with 8GB ram and the states/table entries/mbuf way higher yet, with no change, none ever show above
mostly tested on esxi 6.5 host using vmxnet3 adapters.
also tested an upgrade and fresh load/no config restore with latest vbox on windows 10, with same exact issues cropping up.
I couldn't hit the same issue on old bare hardware upgrade (core 2 Q8400, 4GB ram)
all the issues result in PHP hanging for long periods eating cpu, load averages climb to the moon 10.x and higher, ping latency goes up and wan starts flapping exacerbating the issue further. if you leave it sit long enough it sometimes straightens out or I noticed I started pulling traffic through and it suddenly jumps the latency down and works for a while. I tried disabling gateway monitor actions and it helps because wan doesn't flap, but the issue still remains.
I never thought to try single CPU vm's and after so many lagged aggravating tests, I don't want to play anymore. -
Hi,
Im also suffering CPU spikes that is causing massive lagg issues for me.
Ive noticed it mainly revolves around the "pfctl" process randomly spiking. occasionally i see unbound also but mostly its pfctl.
-
We are experiencing the same issue. Upgraded from v2.4.4p3 to v2.4.5. CPU is stuck at 70%, up from 2% before.
Memory usage is up as well.


-
@daNutz said in Increased Memory and CPU Spikes (causing latency/outage) with 2.4.5:
Hi,
Im also suffering CPU spikes that is causing massive lagg issues for me.
Ive noticed it mainly revolves around the "pfctl" process randomly spiking. occasionally i see unbound also but mostly its pfctl.
And are you running on baremetal or a virtualisation platform?
-
@muppet baremetal and just upgraded from a very stable v2.4.4.p3 to v2.4.5
-
I have never yet seen or caught pfctl anywhere up on cpu usage in all the testing. all I ever see is PHP at the top screaming.
and no issues on the single older hardware I upgraded, it's a backup router, that rarely gets used, mainly when servicing the esxi host.
now I do know without traffic limiters/shaping enabled bufferbloat on the cable ISP here caused wan flapping which then ran pfctl cpu usage up high. but that's normal since it keeps reloading everything over and over. -
Just our of curiousity, is everyone running on x86_64 architecture? I.e., is anyone running ARM architecture and experiencing high RAM usage?
FYI, I upgraded SG-3100 (ARM) from 2.4.4 to 2.4.5 and memory usage has been basically unchanged (good). Running packages: apcupsd, pfBlockerNG (2.1.4_21), service_watchdog, suricata.
The latest commit to pfBlocker package (Commits on Mar 28, 2020) says something about fixing MaxMind DB updates....
-
I'm sure this will go unread, but the problem is nothing to do with pfBlocker
Let see if I can write that biggerpfBlockerNG isn't the problem!
Yes, it seems that adding in more complex rules and giving pfctl more to work to do, as pfBlockerNG does, certainly exacerbates the problem and makes it more noticeable.
But I've hit this problem on two boxes and neither is running pfBlockerNG.
@msf2000 It certainly seems that x64 is hitting it and you're right, I haven't seen too many mentions of ARM platforms having it.
-
@muppet Yes! You are entirely right. pfblocker is victim not villain.
The question I would like answered is does this problem exist on all 2.4.5 x64 installs or just some. On clean installs or just upgraded ones? The timing of this stinks. I don't expect a lot of movement concerning this for some time.
I really have no one to blame other than myself. I thought that given the extended time between releases and the time 2.4.5 spent in RC status that it would be rock solid out of the gate. I was wrong and I should have known better than to do this upgrade now.
I'll do a clean install and restore my config when I can do that without taking myself or the kids offline for an extended time. Remote work, remote school.

-
@jwj Yes, I feel the same in that I wish I hadn't upgraded. I could have easily rolled back (I took a backup of my VM before I pressed go) but I've been meaning for ages to try out Vyos at home and this was the final push I needed.
I'm sure this will be fixed, I expect it's an underlying FreeBSD issue, probably something to do with workarounds for Spectre/Meltdown or similar.
It was bad timing, but then joke's on us really - who upgrades their key infrastructure during a crisis this the worlds current one (for future readers, COVID19). The release notes even warn us. So we've noone to blame but ourselves.
I also regret not having run a 2.4.5-RC build where I could have helped diagnose this and fix it before production. It's the old thing of "I'm sure someone else has done that". Alas.
Onwards and upwards though, I love pfSense!
-
@muppet said in Increased Memory and CPU Spikes (causing latency/outage) with 2.4.5:
I'm sure this will go unread, but the problem is nothing to do with pfBlocker
Let see if I can write that biggerIrrespective of size or color of font, yours appears to be an absolute claim in the negative, which cannot be proven by definition. To the contrary, there is a base of evidence pointing to cause/effect combinations of pfblocker, unbound, pfctl that others proved out on their respective systems (which appear to be mostly x86_64 based). If you have substantive data to offer that may establish different cause/effect sets, that may be helpful to all in isolating the issue(s) and hopefully fixing it.
-
@t41k2m3 I played around and tested from fresh install, no imported config, no packages and only two nics, wan/lan on ESXI 6.5 and vbox on windows 10(complete different amd/intel machines) and problem exists in playing around through changing settings randomly. pfblocker and other packages do agitate the issue making t very visible.
-
@t41k2m3 I have no packages installed and it's still a problem. Therefore it's easy to prove it's not pfBlockerNG.
As I posted, anything like pfBlockerNG etc seem to exacerbate the problem, but are not the cause of it.
-
Hello all,
I`m here because I ran into the same issue.
On Friday I updated to 2.4.5 on a baremetal system (Netgate D1541 with 32GB RAM).
Additionally I updated pfBlockerNG to the devel version (2.2.5_30).Same issues as decribed above including high system load up to 23, pfctl eating 180% CPU, and similar issues like Nginx gateway timeouts, VPN interrupts, broken internet connections.
Additionally I had a broken GEOM mirror after the update process and reboot (I did not switch it off or similar). The system was not usable after the rebuild, I saw a lot off missing PHP files. Nothing was working, the network was also broken. To get it running again I had to reinstall the system. This is also new for me. The S.M.A.R.T status was and is without any issue. The update process did not show an error.
Does anybody has any hint what could be the root cause for such a behavior?
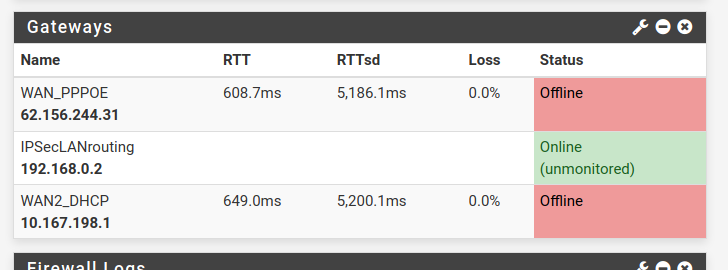
For me it looks like the mirror was broken while the update process was running and after the reboot it copied from the wrong SSD to the other. I have no clue how this can happen.If the system is under load the WAN gateways have a high latency but without packet loss, which I never saw before:

The system is not accessible for minutes if anything changed.
As I added some new VLANs it never came back, I had to go onsite for a reboot which is not so easy at the moment because everybody is working from home.It is not only the pfctl process, I saw ntopng, resolver, php-fpm with high CPU usage.
In the meanwhile I don`t believe that the problem is only pfBlockerNG-devel, it is more likely one or more problems somewhere in the system.What is the best solution for now? Waiting for a fix is not an option with COVID-19.
Has anybody tested a clean install of 2.4.4 P3 and restored the settings of the 2.4.5 version?
Is this working or should I waste my work of the last few days and restore a backup of 2.4.4 P3?Ralf
-
As i write early, now i am on Hyper-V Server 2019, set 2 CPU cores for pfSense 2.4.5, i have made clean install on new VHDX storage file with config restore from old patched system. Set Kernel PTI: Disabled and MDS Mitigation: Inactive, than make clean config on pfBlockerNG and reinstall pfBlockerNG-devel, after it — manually restore all settings in GUI. System uptime is 4 days for now, no lags and abnormal CPU usage, just a little bigger RAM usage (~20%).
p.s.
Once per hour system gets frozen for few seconds, when pfblocker make updates, must to set update once per day.


