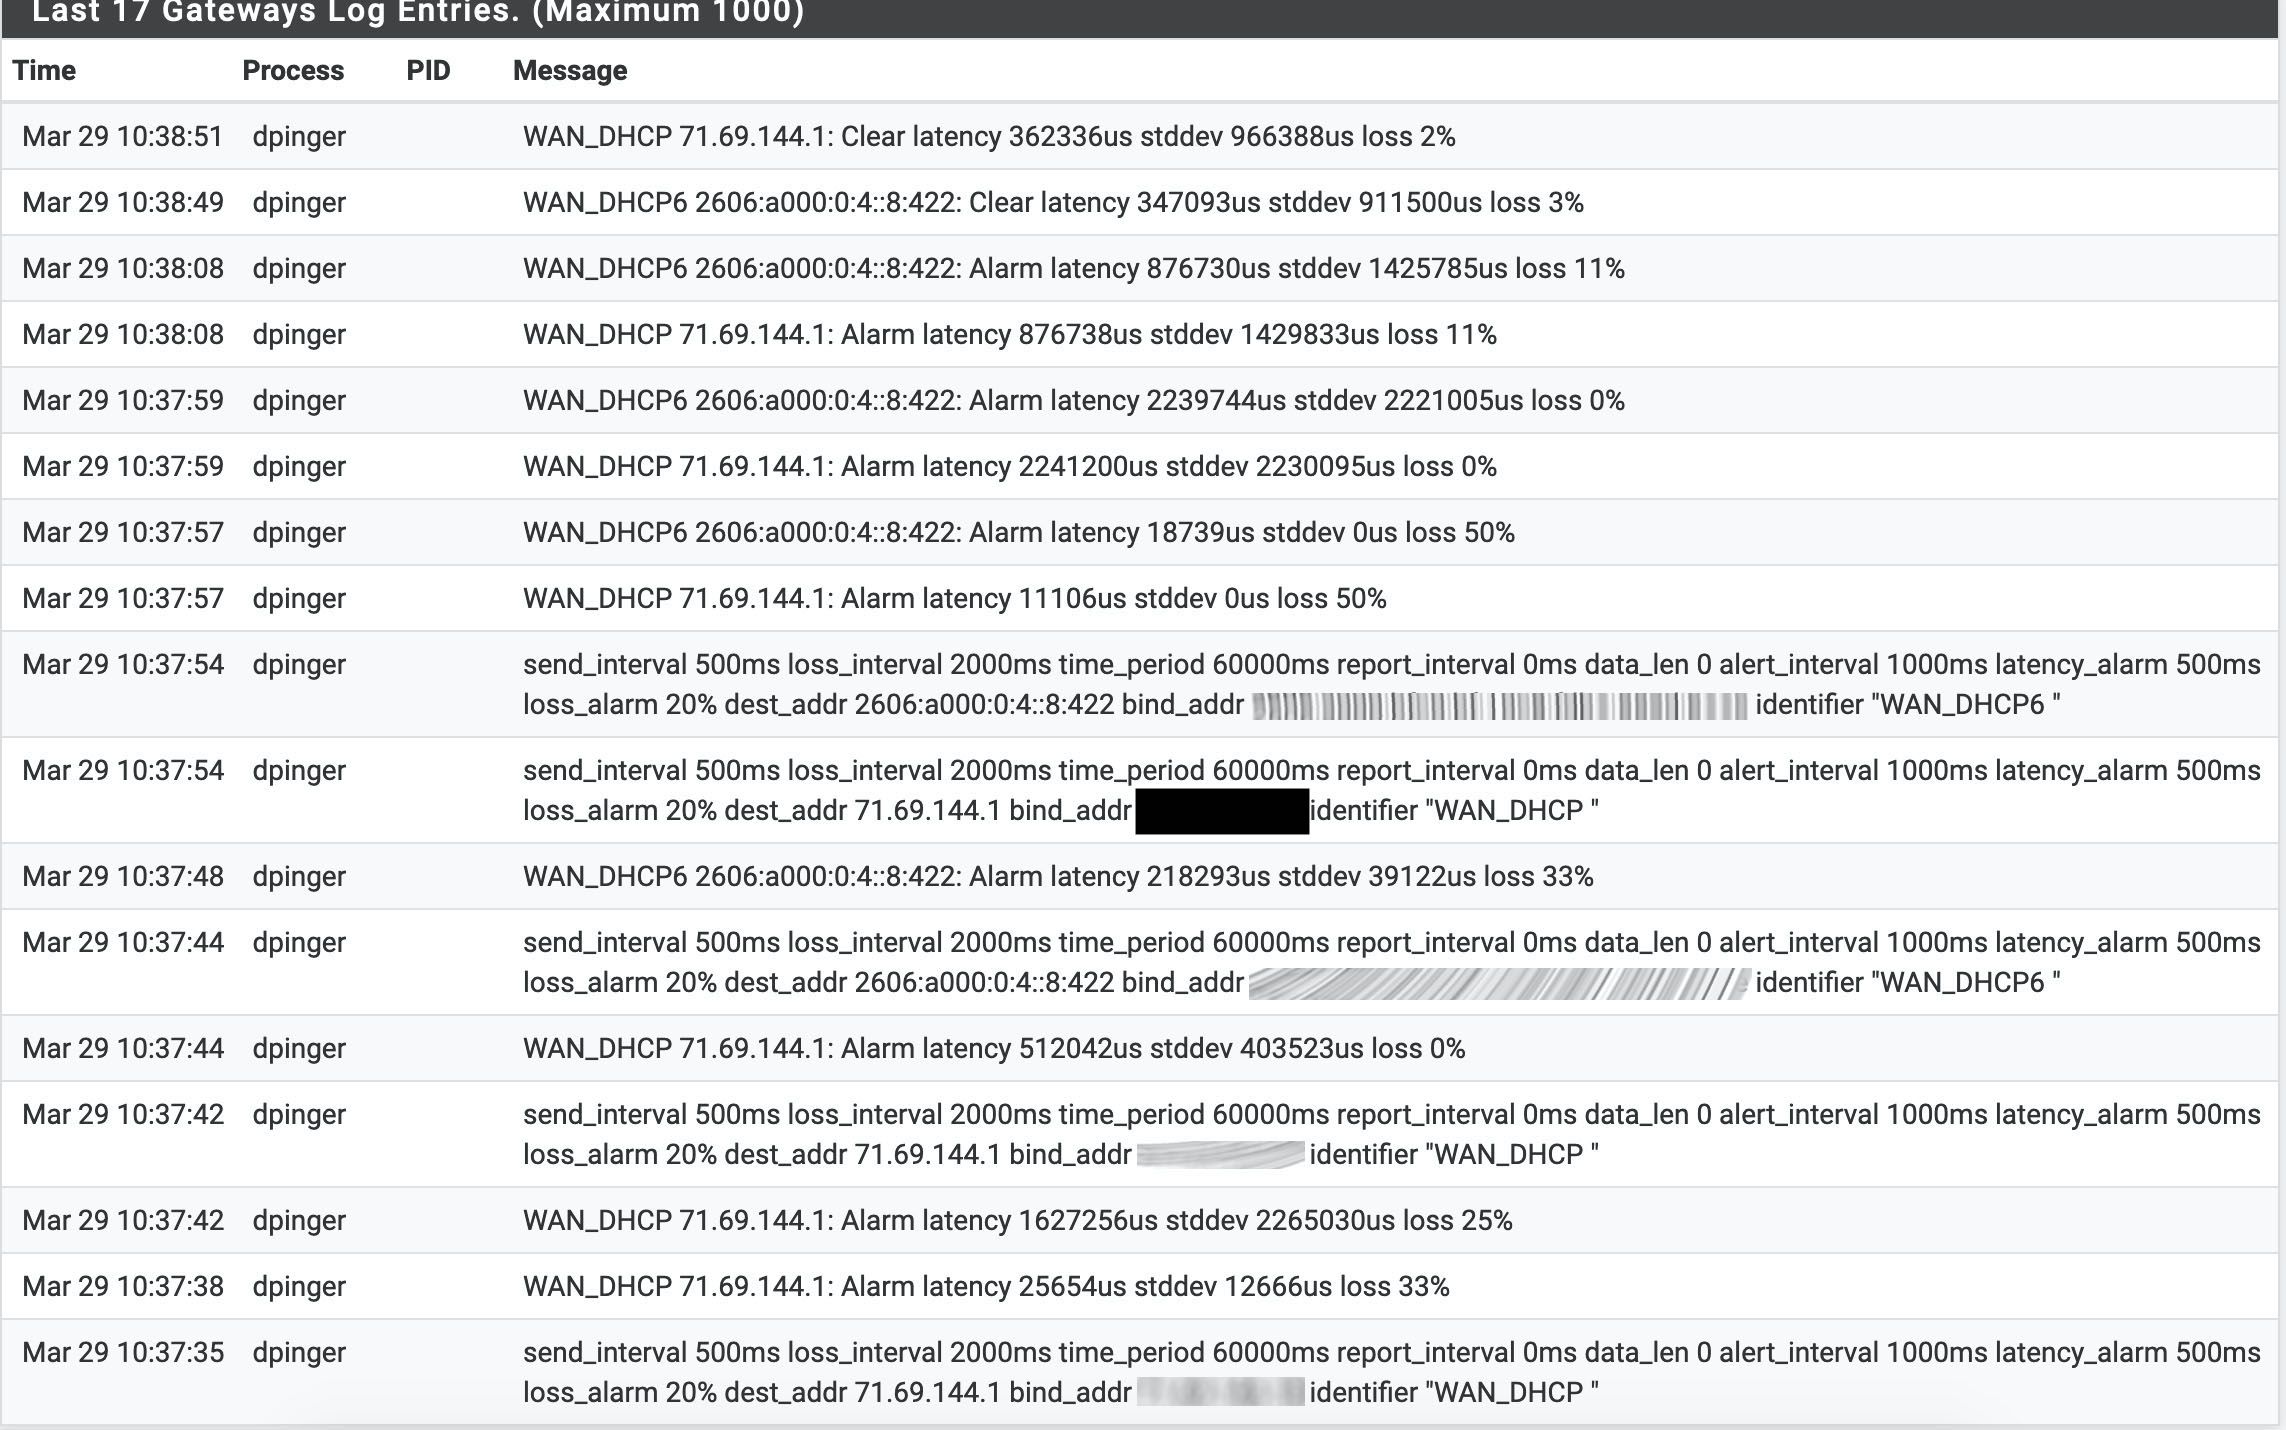
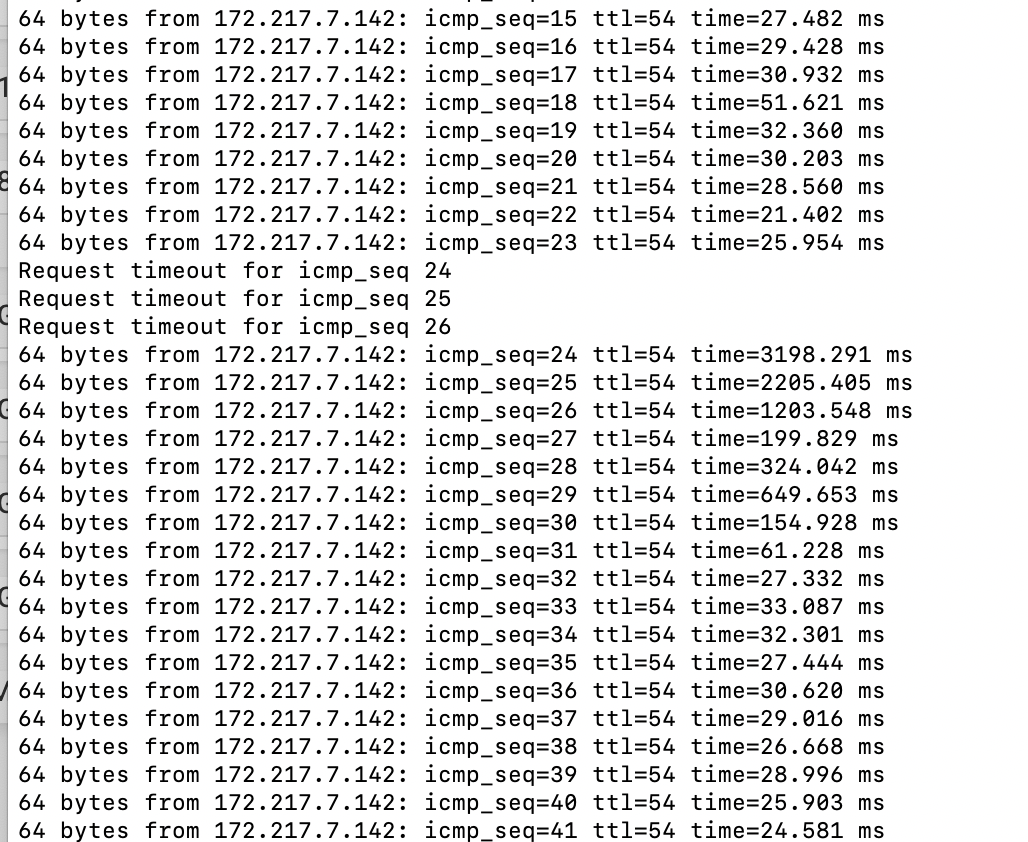
2.4.5 High latency and packet loss, not in a vm
-
Same problem in a physical box.
When I edit a rule and apply the changes, the latency rises to 300 ms. -
A
asan 17 minutes agoI'm also affected.
HW: SG-4860If the process pfctl has a 100% peak, ping latency is also very high.
Reply from 9.9.9.9: bytes=32 time=2ms TTL=55
Reply from 9.9.9.9: bytes=32 time=2ms TTL=55
Reply from 9.9.9.9: bytes=32 time=2ms TTL=55
Reply from 9.9.9.9: bytes=32 time=2ms TTL=55
Reply from 9.9.9.9: bytes=32 time=2ms TTL=55
Reply from 9.9.9.9: bytes=32 time=2ms TTL=55
Reply from 9.9.9.9: bytes=32 time=2ms TTL=55
Reply from 9.9.9.9: bytes=32 time=2ms TTL=55
Reply from 9.9.9.9: bytes=32 time=2ms TTL=55
Reply from 9.9.9.9: bytes=32 time=1125ms TTL=55
Reply from 9.9.9.9: bytes=32 time=2ms TTL=55
Reply from 9.9.9.9: bytes=32 time=2ms TTL=55
Reply from 9.9.9.9: bytes=32 time=2ms TTL=55
Reply from 9.9.9.9: bytes=32 time=2ms TTL=55
Reply from 9.9.9.9: bytes=32 time=2ms TTL=55
Reply from 9.9.9.9: bytes=32 time=2ms TTL=55
Reply from 9.9.9.9: bytes=32 time=1613ms TTL=55
Reply from 9.9.9.9: bytes=32 time=2ms TTL=55
Reply from 9.9.9.9: bytes=32 time=2ms TTL=55
Reply from 9.9.9.9: bytes=32 time=2ms TTL=55
Reply from 9.9.9.9: bytes=32 time=2ms TTL=55
Reply from 9.9.9.9: bytes=32 time=2ms TTL=55
Reply from 9.9.9.9: bytes=32 time=2ms TTL=55
Reply from 9.9.9.9: bytes=32 time=2ms TTL=55
Reply from 9.9.9.9: bytes=32 time=2ms TTL=55
Reply from 9.9.9.9: bytes=32 time=2ms TTL=55
Reply from 9.9.9.9: bytes=32 time=2ms TTL=55
Reply from 9.9.9.9: bytes=32 time=2ms TTL=55
Reply from 9.9.9.9: bytes=32 time=1190ms TTL=55
Reply from 9.9.9.9: bytes=32 time=5ms TTL=55
Reply from 9.9.9.9: bytes=32 time=2ms TTL=55
Reply from 9.9.9.9: bytes=32 time=2ms TTL=55
Reply from 9.9.9.9: bytes=32 time=2ms TTL=55
Reply from 9.9.9.9: bytes=32 time=2ms TTL=55
Reply from 9.9.9.9: bytes=32 time=2ms TTL=55
Reply from 9.9.9.9: bytes=32 time=2ms TTL=55
Reply from 9.9.9.9: bytes=32 time=2ms TTL=55
Reply from 9.9.9.9: bytes=32 time=2ms TTL=55
Reply from 9.9.9.9: bytes=32 time=2ms TTL=55
Reply from 9.9.9.9: bytes=32 time=2ms TTL=55
Reply from 9.9.9.9: bytes=32 time=2ms TTL=55 -
Try running a packet capture on the WAN when you see this. Filter by pings.
Check to see where the latency is happening. Ping requests delayed sending, delayed responses or somehow delayed within pf before it gets back to the ping process.Steve
-
Delayed by pf. Pings between vlans see the latency when tables are reloaded.
From one vlan to another:
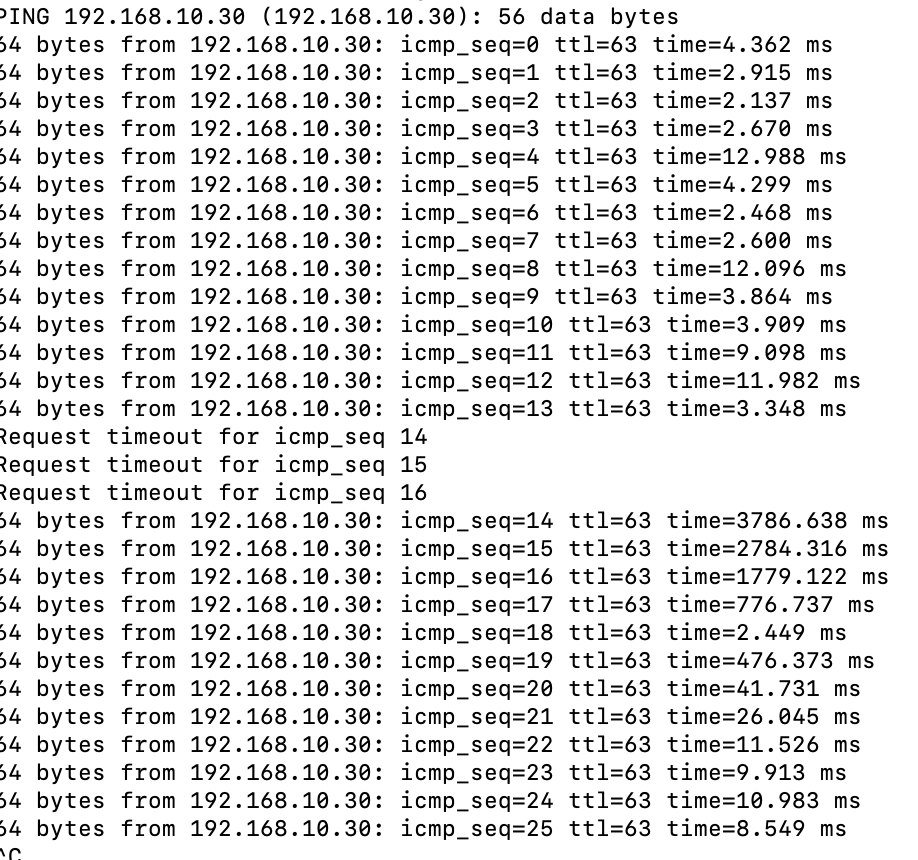
-
That is not a packet capture.
-
I am aware of that. Standby for a packet capture.
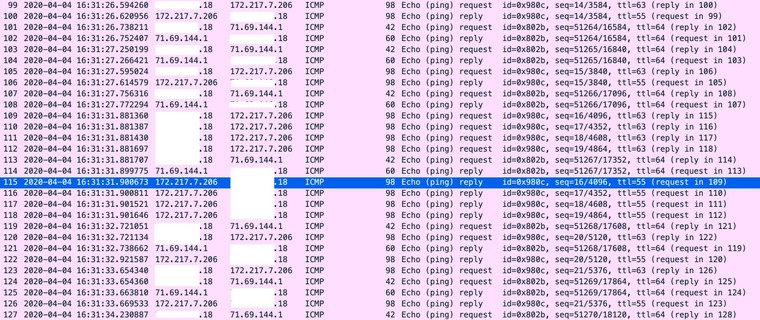

-
If you are not able to test in a way that allows you to post actual pcaps I don't know how much good it is going to do anyone.
It is past the point of trying to convince people this is a problem (in apparently edge cases). Now it's about trying to compile information so it can be identified and corrected.
-
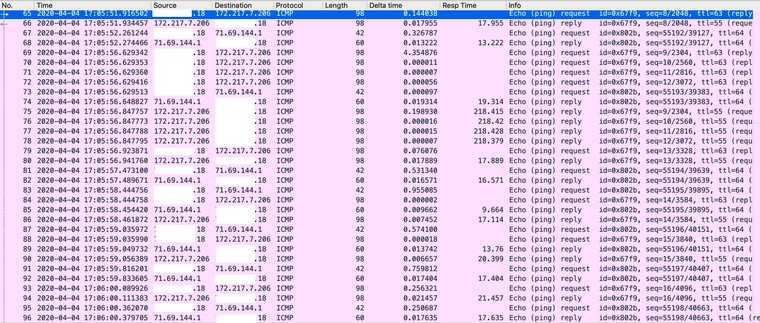
That is a pcap, in wireshark with my public ip blanked out. I would be happy to send you the file if you would like but I'll decline to post it publicly, some knuckle head will just decide to go fishing around at my public ip.
-
I find adding the 'time difference' and 'response time' columns useful here.
That will show if the request is delayed. And what the actual response time on the wire is. Like:

-
I just don't think this data is very helpful at diagnosing exactly what is happening.
-
@stephenw10 said in 2.4.5 High latency and packet loss, not in a vm:
I see delta time but not response time as column choices. Maybe it would be more expedient for me to send the pcap. I have used wireshark exactly once, this time. :)
OK, I see now. Custom column and then icmp.resptime. Does that make any sense if it's not sorted by the icmp seq number?
-
I hope this is more useful. If not I'll try again.
-
I'll add this to the mix. I changed the average time in the gateway settings. That's the time dpinger averages over. When changing the setting, saving and then applying it the interface locked up for an extended time (minutes).
So, I ssh'd in, ran top and did it again:
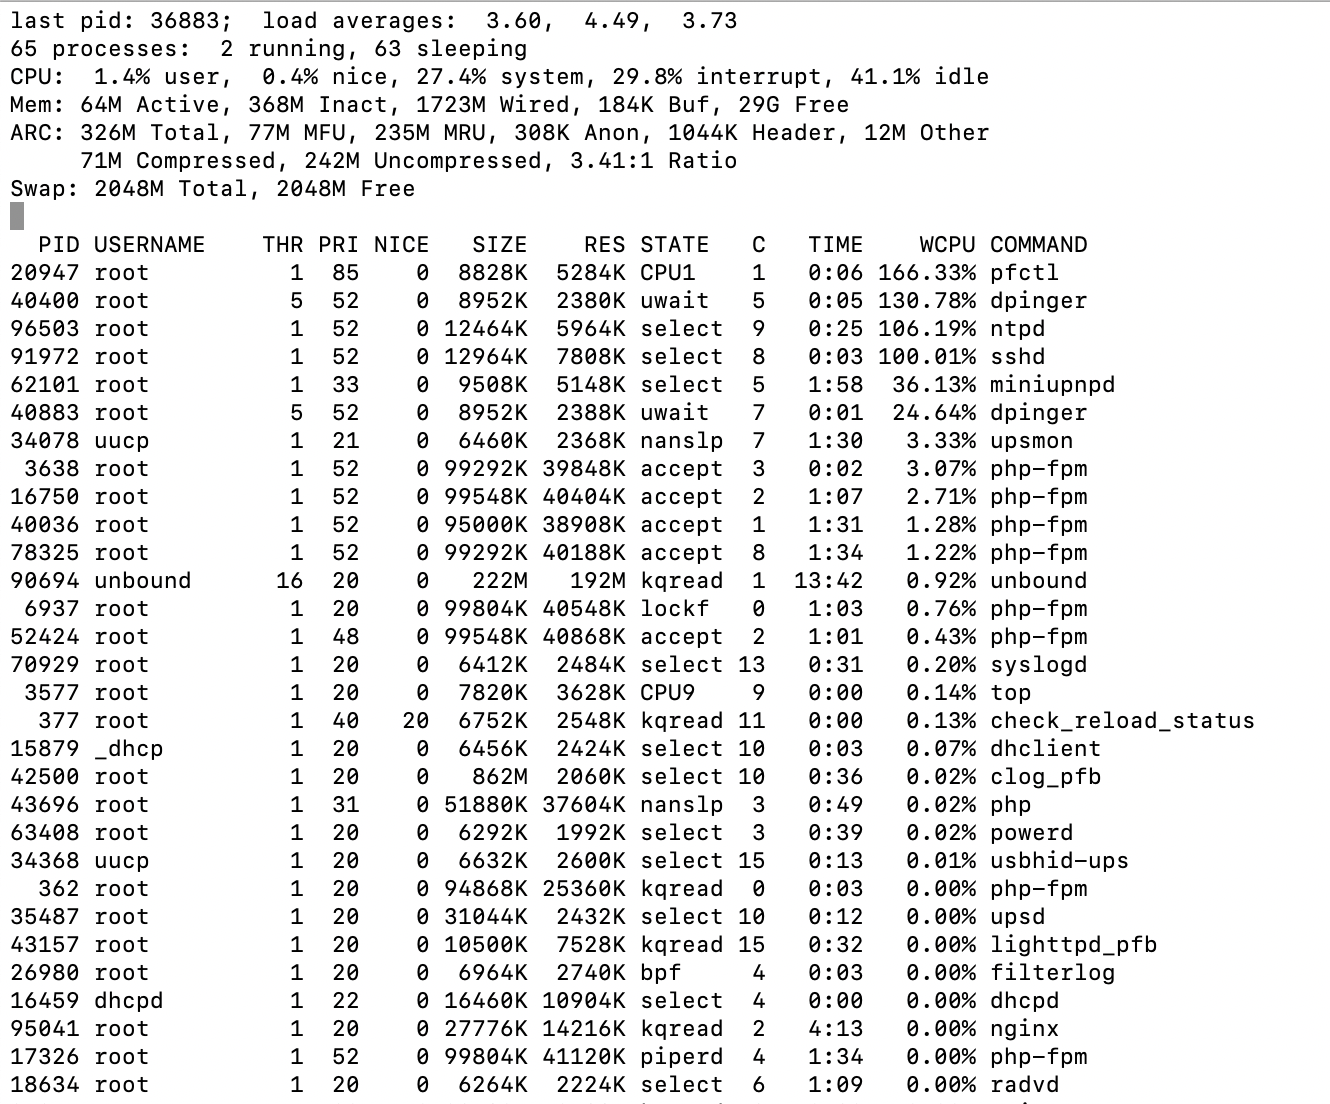
I can see dpinger using some resources, but why pfctl, ntpd and sshd? I'm not sure if that means anything, but it sure appears odd to me.
-
This looks so much like the problem I had, even before PFS 2.45. The symptoms. Latency spikes, then packet loss over and over. I had just created my first VLAN and gave the VLAN interface a static IPV6 in one of the 64s I should have. But no route and this horrible latency and packet drop. I followed the info HERE and created a 'Configuration Override' on the WAN IPV6 and set my VLAN static IPV6 and that was the only way to get darn ATT to route IPV6 from my VLAN. It made it trouble free after I spent almost a week pulling out my hair. So just wondering, can you guys ping (route) from your LAN or from the VLANS in ipv6? I am seeing ipv4 pings but did I miss the ipv6 pings...
I'm on 2.45 with no issues, and am using the latest PFBLOCKERNG. It just looks so familiar... -
I can ping ipv6 without issue. I get a /56 from my isp.
The only thing that has changed in my configuration is the pfsense version.
I have offered to share my config.xml to test on matching hardware. My Supermicro hardware is the same as a box Netgate sells other than not being Netgate branded.
This is an frustrating problem, more so for Netgate than anyone else I'm sure.
-
Can you see what is calling pfctl if you run, say:
ps -auxdww | grep pfctl. -
root 25572 33.5 0.0 8828 4888 - R 09:34 0:04.12 | | `-- /sbin/pfctl -o basic -f /tmp/rules.debug
-
I was able to run ps auxdww >> psoutput a few times before the shell locked up.
Here it is: (removed)
-
Thanks, that could be useful.
Interesting there are things there using far more CPU than I would ever expect.You might want to remove it though if those public IPs are static.
Steve
-
@stephenw10 Dynamic. No open ports, so they can bang away all they want ;)

