No web GUI when internet is down
-
Hi everyone,
I've recently set up pfSense on a refurbished dell optiplex with an Intel 4-port NIC. I've been having issues with the web GUI and the DHCP client on my WAN interface. I think they're two separate issues, but the ALWAYS appear at the same time so there must be a connection.
The first issue is simple: every few days, I lose internet access. When I SSH into the box, I can see that my WAN interface (re0) has no address. If I run dhclient, it spits out a message that it's already running. If I reboot the box, everything is fine. (Today I also realized that running
killall dhclientbeforedhclientwould probably also work, but it wouldn't prevent the original issue). Based on the frequency, and the fact that dhclient is already running, it feels to me like it hangs when it tries to renew my lease. Is that normal, and is there a fix for it that doesn't involve manually killing and restarting the process each time? I'd settle for something hacky like a script that runs if WAN has no IP address for x number of seconds.This brings me to my second issue: whenever my WAN interface has no IP address, I cannot connect to the web GUI of the router. I find this strange because I connect using the LAN IP (v4) from within the LAN network, so the WAN interface shouldn't even be involved. One other side note, is that sometimes the first issue described above affects only my IPv6 lease. When that happens, I still can't access the internet (probably because my devices keep trying to use IPv6 I'd guess) but I can get into the web GUI and renew the lease from there with no issues. I don't think this second issue is as important, but I'd like to satisfy my curiosity if anyone knows why it might happen.
Any idea what's going on in either case?
-
@bdben said in No web GUI when internet is down:
whenever my WAN interface has no IP address, I cannot connect to the web GUI of the router.
I noticed the same occurring. Yesterday I had to reboot my cable modem, which meant pfsense lost WAN IP for the time being, and meanwhile I could not access the WebGUI from a LAN client. Actually, the webGUI was already loaded, but I no longer could navigate it. Firefox produced a "Page cannot be found" while refreshing. After the cable model had rebooted, pfsense became responsive again.
Not sure why but its not the first time this happens... If my internet connection is completely down (lets say there's an outage), I can access the webGUI just fine. Its like if pfsense is trying to find out why it lost its WAN IP or is trying to renew it, its too busy to display the WebGUI but that cant make any sense, especially on the hardware its running here.
Good question for the devs!
-
Glad I'm not the only one at least! I think you might be onto something there - I should test whether or not I can access the GUI with internet down completely vs trying to renew the IP. But that does seem to fit with what I've noticed about dhclient apparently getting stuck. Maybe it's being called from the main thread of the GUI and causing it to freeze? I'd think the process should be forked or called from another thread somehow, since it can take a few seconds to run in the best of times, but then again this is designed to run on minimal hardware and buttery smooth web GUI performance is not the primary goal of any router.
-
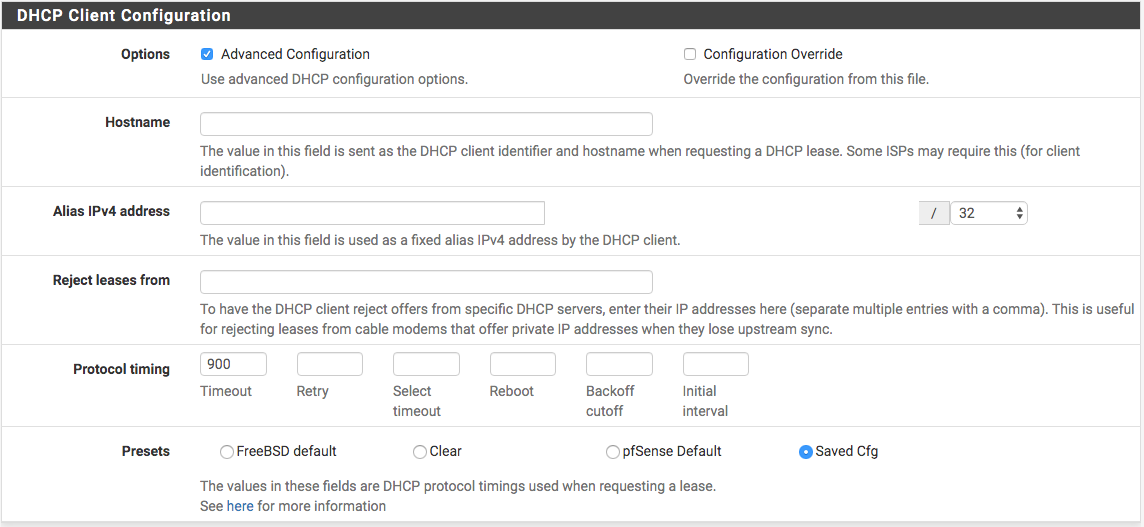
@bdben and @pftdm007 If both of you are experiencing this issue using a cable modem, Click on WAN interface, and scroll down to the image below, then click advance and set 900 seconds in the timeout box which equals 15mins, then reboot ... that will resolve the issue. The WebGUI checks on lots of stuff on the Internet and why it goes weird without WAN.
-
under system > advanced > networking > very last option. do you have that enabled to reset states upon wan change?
that will cause the gui to not respond for several minutes. in fact i've had to force close the browser or try another one if i have that set
its also under misc and gateway monitoring
-
@bcruze Well, if you don't have a cable modem, you could surely try that and reboot.
-
@bdben and @pftdm007 : open a console session, or SSH (Putty or other SSH client) and use option 8
Make the screen as big as possible.
Type this command :topLines 8 and further down show the most used process - real time.
Now, do your 'modem' thing - reboot it, rip out the ISP cable connection.
Try to access theGUI.
And see what with our 'top' screen.
What process are rising at the top == are asking the most processor power ?
Do the keyboard magic (make a text screen copy - no image please) and past here.Like :
last pid: 58192; load averages: 0.26, 0.23, 0.18 up 2+22:05:39 08:28:39 83 processes: 1 running, 82 sleeping CPU: 0.0% user, 0.0% nice, 0.2% system, 0.0% interrupt, 99.8% idle Mem: 75M Active, 734M Inact, 316M Wired, 100M Buf, 815M Free Swap: 4096M Total, 4096M Free PID USERNAME THR PRI NICE SIZE RES STATE C TIME WCPU COMMAND 78388 unbound 2 20 0 821M 459M kqread 1 11:00 0.34% unbound 87913 root 1 20 0 7820K 3672K CPU1 1 0:00 0.09% top 64006 root 1 20 0 4644K 2324K select 0 1:35 0.03% clog_pfb 5762 root 5 52 0 6904K 2344K uwait 0 1:02 0.02% dpinger 63664 uucp 1 20 0 6632K 2632K select 1 0:52 0.02% usbhid-ups 80367 root 1 20 0 12732K 7704K select 0 0:00 0.01% sshd 3859 root 5 52 0 6904K 2332K uwait 0 0:42 0.01% dpinger 427 root 1 20 0 9156K 5480K select 0 0:27 0.01% devd 54961 dhcpd 1 20 0 22732K 16136K select 0 0:28 0.01% dhcpd 53953 dhcpd 1 20 0 16460K 11108K select 1 0:27 0.01% dhcpd 46589 root 1 20 0 12464K 5800K select 1 0:34 0.01% ntpd 70232 root 1 20 0 19256K 14676K select 1 0:17 0.01% perl 64440 root 1 20 0 6468K 2432K select 0 0:18 0.00% upsd 341 root 1 20 0 95264K 24936K kqread 1 0:09 0.00% php-fpm 60879 root 1 20 0 12548K 7928K kqread 1 2:26 0.00% lighttpd_pfb 33289 root 1 20 0 6964K 2712K bpf 1 0:06 0.00% filterlog ..... -
System > Update > Update Settings > Disable the Dashboard auto-update check
-Rico
-
@bcruze I don't have that option checked, but I can see now that would cause this issue.
@NollipfSense I am using a cable modem, so I set the settings as you suggested (thanks for the screenshot, very helpful). When I applied the settings, I lost my internet connection with the same symptoms as usual, so I took the opportunity to do some other suggested troubleshooting before the reboot. Mainly, I tried running dhclient and got the message that it was already running. So I did
killall dhclientand ran it again, and got this output:DHCPREQUEST on re0 to 255.255.255.255 port 67 DHCPREQUEST on re0 to 255.255.255.255 port 67 re0 link state up -> down re0 link state down -> up DHCPREQUEST on re0 to 255.255.255.255 port 67 DHCPREQUEST on re0 to 255.255.255.255 port 67 re0 link state up -> down DHCPDISCOVER on re0 to 255.255.255.255 port 67 interval 7 re0 link state down -> up DHCPREQUEST on re0 to 255.255.255.255 port 67 DHCPREQUEST on re0 to 255.255.255.255 port 67 DHCPDISCOVER on re0 to 255.255.255.255 port 67 interval 6 DHCPREQUEST on re0 to 255.255.255.255 port 67 DHCPDISCOVER on re0 to 255.255.255.255 port 67 interval 7 DHCPDISCOVER on re0 to 255.255.255.255 port 67 interval 7 DHCPDISCOVER on re0 to 255.255.255.255 port 67 interval 6 re0 link state up -> down re0 link state down -> up DHCPREQUEST on re0 to 255.255.255.255 port 67 DHCPDISCOVER on re0 to 255.255.255.255 port 67 interval 7 TerminatedI don't know enough to say whether this is relevant though.
@Gertjan I ran top while this was happening as well. The output is below, but to my eyes the resource usage looks normal:
[2.4.5-RELEASE][admin@pfSense.home]/root: top last pid: 22425; load averages: 0.28, 0.25, 0.10 up 1+23:12:44 13:20:10 57 processes: 1 running, 56 sleeping CPU: 0.1% user, 0.0% nice, 0.3% system, 0.9% interrupt, 98.7% idle Mem: 72M Active, 228M Inact, 449M Wired, 120M Buf, 3100M Free Swap: 4096M Total, 4096M Free PID USERNAME THR PRI NICE SIZE RES STATE C TIME WCPU COMMAND 27368 root 17 20 0 187M 53864K uwait 1 2:14 0.72% telegraf 35787 www 1 20 0 20916K 15128K kqread 1 3:48 0.22% haproxy 19593 root 1 20 0 9508K 5396K select 1 0:15 0.12% miniupnpd 54581 root 1 20 0 6408K 2476K select 2 0:33 0.09% syslogd 17952 root 1 20 0 7820K 3328K CPU3 3 0:00 0.04% top 59366 root 1 20 0 12592K 5884K select 2 0:09 0.03% ntpd 93986 unbound 4 20 0 87336K 63088K kqread 3 0:03 0.03% unbound 41692 root 1 20 0 6964K 2736K bpf 0 0:43 0.03% filterlog 30708 avahi 1 20 0 7512K 3488K select 3 0:35 0.02% avahi-daemon 58150 root 1 20 0 23680K 8668K kqread 3 0:28 0.02% nginx 67981 _dhcp 1 20 0 6456K 2436K select 2 0:00 0.01% dhclient 98132 root 1 20 0 12964K 7824K select 1 0:00 0.01% sshd 36383 root 1 20 0 52216K 35976K nanslp 0 0:12 0.01% php 63429 root 5 52 0 11000K 2412K uwait 3 0:00 0.01% dpinger 360 root 1 40 20 6752K 2596K kqread 0 0:00 0.00% check_reload_status 57863 root 1 20 0 23680K 8680K kqread 1 0:21 0.00% nginx 63202 root 1 20 0 10484K 6920K kqread 1 0:02 0.00% lighttpd_pfb 345 root 1 20 0 95204K 25764K kqread 1 0:02 0.00% php-fpm 46276 root 1 20 0 97384K 36756K wait 2 0:19 0.00% php-fpm 54002 root 1 52 0 99628K 40220K lockf 0 0:16 0.00% php-fpm 63534 root 1 52 0 99756K 39708K lockf 0 0:11 0.00% php-fpm 22725 root 1 52 0 97384K 38448K lockf 3 0:08 0.00% php-fpm 98547 root 1 52 0 97384K 37916K wait 3 0:04 0.00% php-fpm 868 root 1 52 0 95336K 38196K lockf 3 0:04 0.00% php-fpm 88161 root 9 20 0 23956K 3516K uwait 2 0:01 0.00% filterdns 58867 root 1 28 0 6376K 2376K nanslp 0 0:00 0.00% cron 11084 root 2 20 0 54528K 36336K uwait 1 0:00 0.00% php 418 root 1 20 0 9156K 4976K select 3 0:00 0.00% devd 32079 root 1 21 0 97380K 36168K lockf 0 0:00 0.00% php-fpm 41452 root 1 20 0 97380K 36172K lockf 2 0:00 0.00% php-fpm 42413 root 1 20 0 6192K 1912K nanslp 3 0:00 0.00% minicron 8452 root 1 20 0 6196K 2100K kqread 3 0:00 0.00% dhcpleases 45487 root 1 52 20 6976K 2768K wait 0 0:00 0.00% sh 8610 dhcpd 1 20 0 16460K 10908K select 0 0:00 0.00% dhcpd 14266 root 1 30 0 7280K 3464K pause 2 0:00 0.00% tcsh 84475 root 1 52 0 6724K 2732K wait 1 0:00 0.00% login 69251 root 1 20 0 6456K 2308K select 0 0:00 0.00% dhclient 9023 root 1 20 0 12672K 6904K select 0 0:00 0.00% sshd 96842 root 1 52 0 6976K 2848K wait 0 0:00 0.00% sh 11069 root 1 52 0 6976K 2724K wait 1 0:00 0.00% sh 43008 root 1 20 0 6192K 1912K nanslp 1 0:00 0.00% minicron 107 root 1 52 0 6976K 2724K ttyin 3 0:00 0.00% sh@Rico I've disabled the setting as suggested, but I'm just curious what the problem might be with that. Is it because it tries to check for updates when loading the dashboard and that causes it to hang if there is no connection?
-
@bdben said in No web GUI when internet is down:
re0 link state up -> down
re0 link state down -> upWhere are the time stamps ?
And why is this interface going up and down ? That's not normal at all.
These up and down is very close to : disconnect cable, connect cable.
That's always followed by a DHCP sequence, the DHCP clients is paid to do so, that part looks ok.Bad NIC ? (It's a Realtek so who would be surprised ?)
Bad cable ?
Bad NIC on the other side ?
Gateway monitoring takes the interface down logically because WAN connection is bad ? -
@Gertjan said in No web GUI when internet is down:
Where are the time stamps ?
It didn't print out any time stamps, but this took roughly 30 seconds I'd guess. To be clear, this isn't a log file, rather the actual output to stdout from the command.
@Gertjan said in No web GUI when internet is down:
Bad NIC ? (It's a Realtek so who would be surprised ?)
I had wondered this myself - the WAN interface is the builtin NIC on the motherboard, while the others are on a PCIe Intel NIC that I got on ebay. Might be worth switching my LAN interface to one of those then? It's also possible that the cable is bad. I don't have a cable tester unfortunately, but I can try swapping some cables around and see what happens.
I'm also not really sure how to test whether or not @NollipfSense's suggestion is working other than by waiting. I haven't been able to reproduce the error deliberately, it's just something that happens every couple of days.
-
@bdben said in No web GUI when internet is down:
I'm also not really sure how to test whether or not @NollipfSense's suggestion is working other than by waiting.
It's only if you're using a cable modem.
-
@NollipfSense I am using a cable modem, so I guess I'll just wait and see if the issue returns. Hopefully not!