Suricata Eve Json Cutting Off in Remote Logging
-
Version: 2.4.5-RELEASE (amd64)
Suricata Package Version: 5.0.2_2I'm trying to understand what's happening here. I'm trying to configure Suricata to send
eve jsonlogs to the system and enable remote logging. I have this partially working. I see theeve jsonformat alerts in my system logs, but when I look at the packet capture from the remote logging server ... It's cut-off. Any idea what's going on here?The example below shows the full alert in the system log.
{"timestamp": "2020-04-07T03:41:17.194539+0000", "flow_id": 2244755905705963, "in_iface": "em1", "event_type": "alert", "src_ip": "192.168.X.X", "src_port": 63082, "dest_ip": "208.67.222.222", "dest_port": 53, "proto": "UDP", "tx_id": 0, "alert": {"action": "allowed", "gid": 1, "signature_id": 2023472, "rev": 6, "signature": "ET POLICY External IP Lookup Domain (myip.opendns .com in DNS lookup)", "category": "Device Retrieving External IP Address Detected", "severity": 2, "metadata": {"updated_at": ["2019_09_28"], "performance_impact": ["Low"], "created_at": ["2016_11_01"], "signature_severity": ["Informational"], "tag": ["IP_address_lookup_website"], "deployment": ["Perimeter"], "attack_target": ["Client_Endpoint"], "affected_product": ["Windows_XP_Vista_7_8_10_Server_32_64_Bit"], "former_category": ["POLICY"]}}, "dns": {"query": [{"type": "query", "id": 54766, "rrname": "myip.opendns.com", "rrtype": "A", "tx_id": 0}]}, "app_proto": "dns", "flow": {"pkts_toserver": 1, "pkts_toclient": 0, "bytes_toserver": 76, "bytes_toclient": 0, "start": "2020-04-07T03:41:17.194539+0000"}, "payload": "1e4BAAABAAAAAAAABG15aXAHb3BlbmRucwNjb20AAAEAAQ==", "payload_printable": ".............myip.opendns.com.....", "stream": 0, "packet": "--snip--", "packet_info": {"linktype": 1}}However, when I look at the
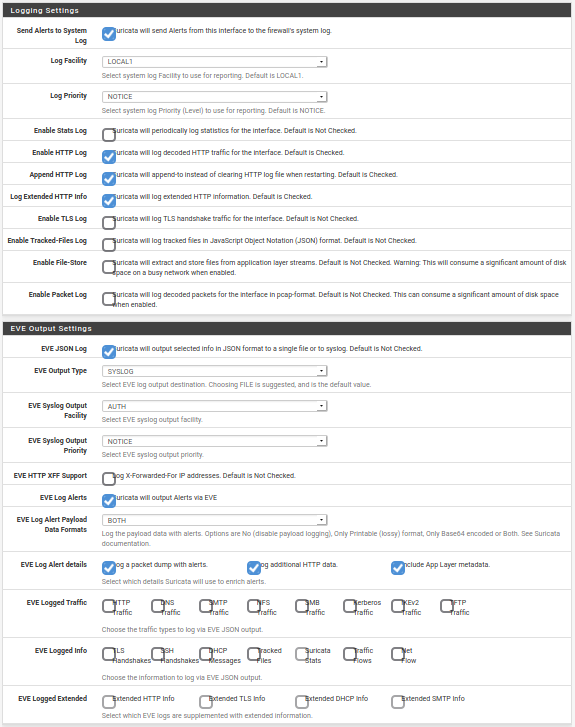
tcpdumpfrom the remote logging server. I see a cut-off similar to the example below.<37>Apr 7 04:06:18 suricata[27731]: {"timestamp": "2020-04-07T04:06:18.338853+0000", "flow_id": 1347743494319013, "in_iface": "em1", "event_type": "alert", "src_ip": "192.168.X.X", "src_port": 60043, "dest_ip": "208.67.222.222", "dest_port": 53, "proto": "UDP", "tx_id": 0, "alert": {"action": "allowed", "gid": 1, "signature_id": 2023472, "rev": 6, "signature": "ET POLICY External IP Lookup Domain (myip.opendns .com in DNS lookup)", "category": "Device Retrieving External IP<174>My configuration of logging within Suricata:
-
That's almost certainly going to be an issue with one or both of the syslog servers (either on the firewall or the remote). It's evident Suricata is doing its part because you are seeing the full log data in the local system's syslog data. However, for some reason either the remote syslog server is truncating the data when receiving it, or the local pfSense system log is truncating it when transmitting it to the remote server.
You need to investigate for any artificial internal limits on transmitted (replicated) system log data to remote servers.
-
Indeed! I think I can rule out the remote server as I can see that the data is cut-off in the packet capture to the remote server from pfsense. I suspect you're right that the pfsense system log is truncating part of the output while transmitting to the remote machine and I've examined the settings and didn't find any options that seemed relevant.
Is there any particular options or settings you'd suggest tinkering with?
Side-note, thank you for all of your Suricata documentation on this site -- I've found it very helpful in the past!
-
@ztroop said in Suricata Eve Json Cutting Off in Remote Logging:
Indeed! I think I can rule out the remote server as I can see that the data is cut-off in the packet capture to the remote server from pfsense. I suspect you're right that the pfsense system log is truncating part of the output while transmitting to the remote machine and I've examined the settings and didn't find any options that seemed relevant.
Is there any particular options or settings you'd suggest tinkering with?
Side-note, thank you for all of your Suricata documentation on this site -- I've found it very helpful in the past!
No, and pfSense actually uses something called
clog, a type of circular syslog variant that overwrites the existing file in a circular fashion. You might find info by searching on theclogterm. I believe a truesyslogdaemon is coming in version 2.5. -
The only thing I found that might've had an effect was Log file size (Bytes) under System Logs > Settings. I increased that to
5MB. I also disabled all of the enriched data and payload from Suricata, but still seeing the same cut-off in the same place in the example I showed earlier.I'll continue to investigate.
-
I had the same problem. I found explanation for that kind of behavior. They changed syslogd code by adding truncate function
iovlist_truncate(il, 480);
As you can see it's truncates message to 480 bytes.More details in FreeBSD forum -
https://forums.freebsd.org/threads/syslogd-truncating-messages-after-upgrade-from-11-2-release-p9-to-11-3-release-p3.72948/ -
@rafalj Oh! That's good to know! Thanks for the information! I ended up sending directly to
redisinstead ofsyslog. Mylogstashreads from that, and everything works as expected. -
As I understand this is a sender limitation not receiver so pfsense box is cutting this message.
Can you put some light on sending logs to redis? -
Redis would be a good choice for exporting the logs. A user contributed support for that into the Suricata package a little while back.
Next time I update Suricata I will include a warning in the Help Text for the syslog export settings sections cautioning that the data will be truncated by the FreeBSD syslog daemon.