fails to get WAN IPv6 address ( was wrong date and time)
-
I don't know what you mean by "filter on states". I allowed WAN with a destination of port 123, no change.
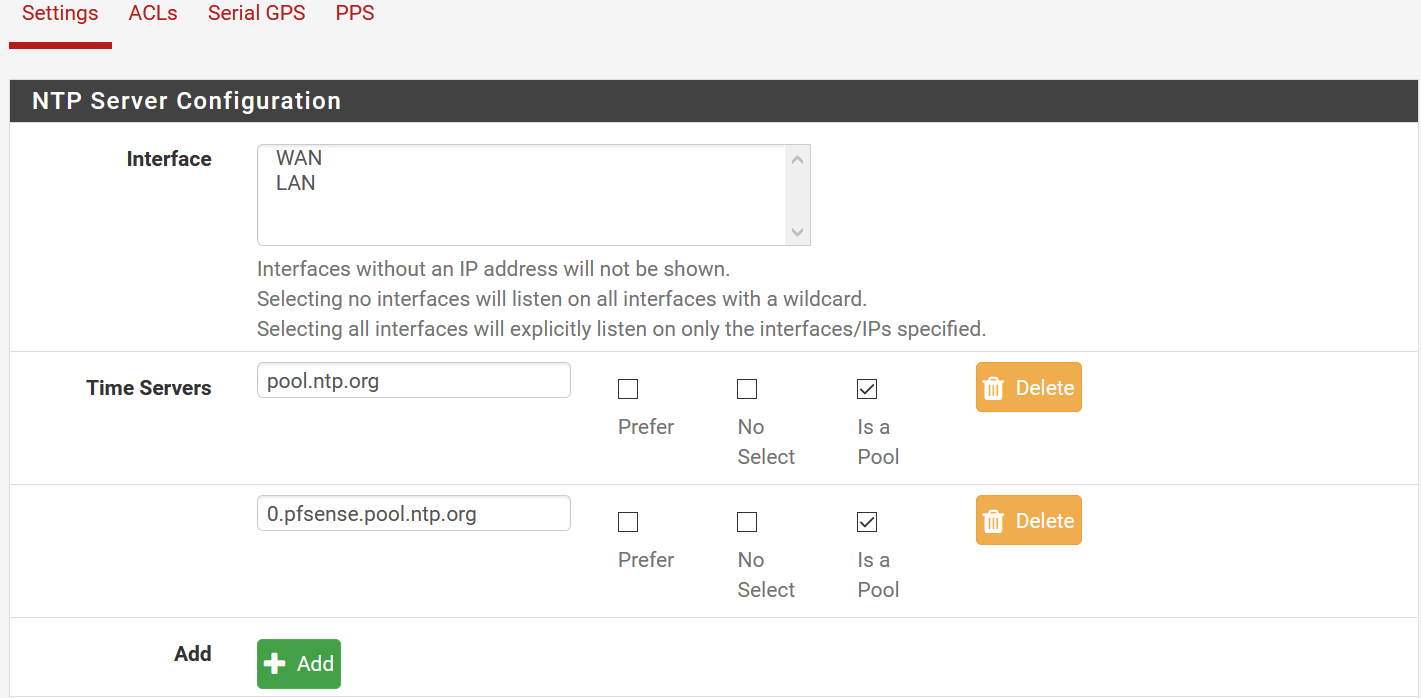
At one time I had VLANs setup, but gave up as they seemed beyond my limited abilities. Is it possible I have somehow assigned NTP to a VLAN that no longer exists? I see the NTP server has both WAN and LAN listed, but is that relevant? I'm not trying to run an NTP server on my network.
-
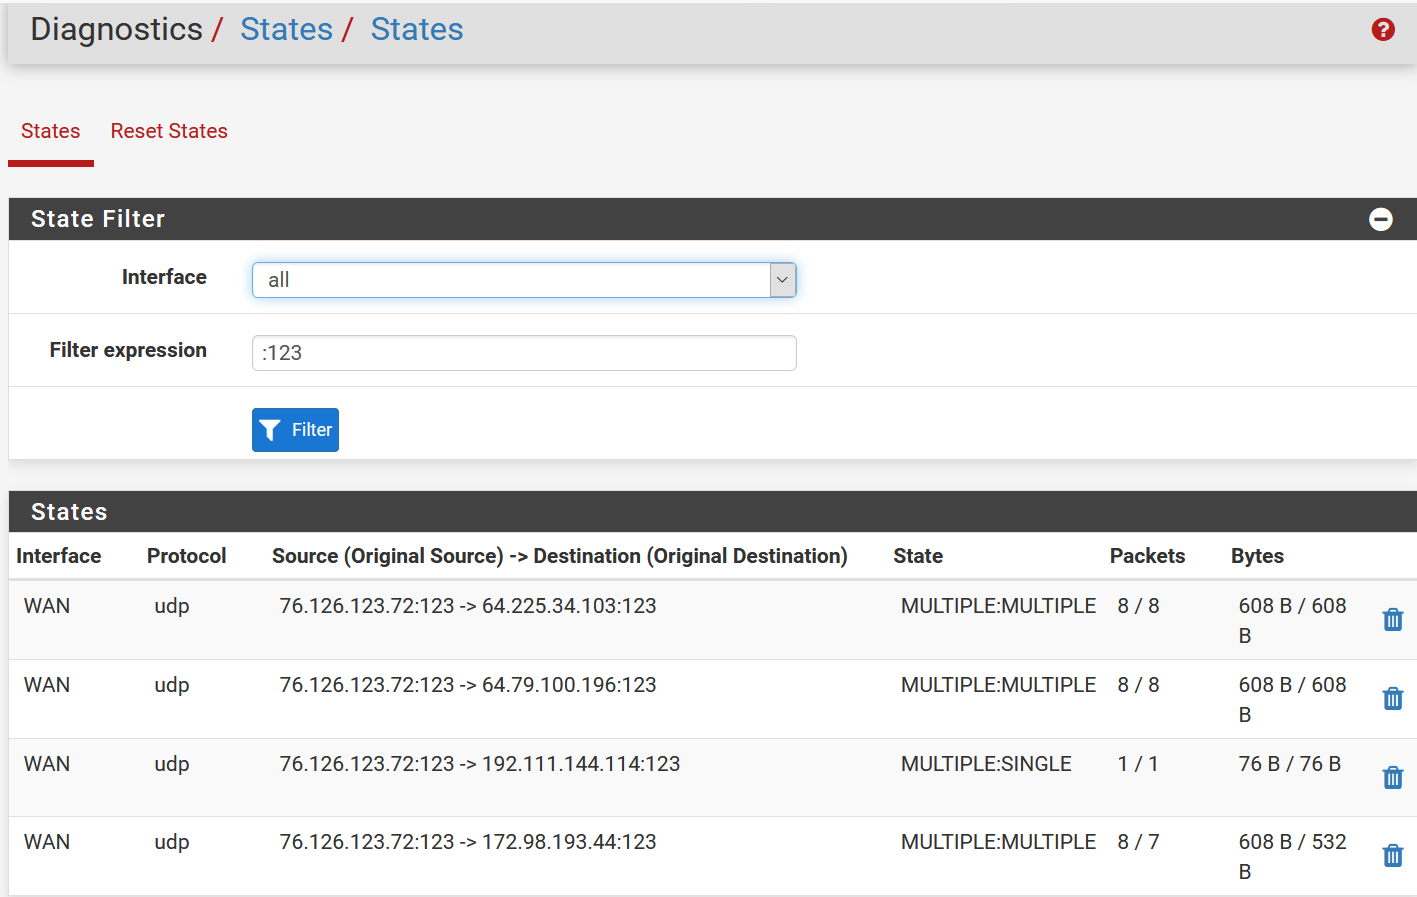
@lifespeed go to web interface, diagnostics states, and use 123 as a filter and see what you get. See my picture attached. :)
Well, as it says, if you have nothing selected on ntp, it will listen on all interfaces.
And a server and a client is essentially the same thing here.I doubt vlans have anything to do with that.
Please verify that you are able to ping from cli most if not all of the ip's that appear on ntpq -p too.If still all is well and no ntp works, a packet capture on the wan , on udp 123 is the next thing (diagnostics, packet capture)
-
I ran a packet capture on the WAN, port 123, not promiscuous, and got nothing after I stopped the capture and pressed "view capture". I ran ntpq -p from CLI during the packet capture.
Thanks for all your help this far. I can't help but think I have deleted or changed a default setting that has borked NTP. But it would seem the default allow all outgoing would work.
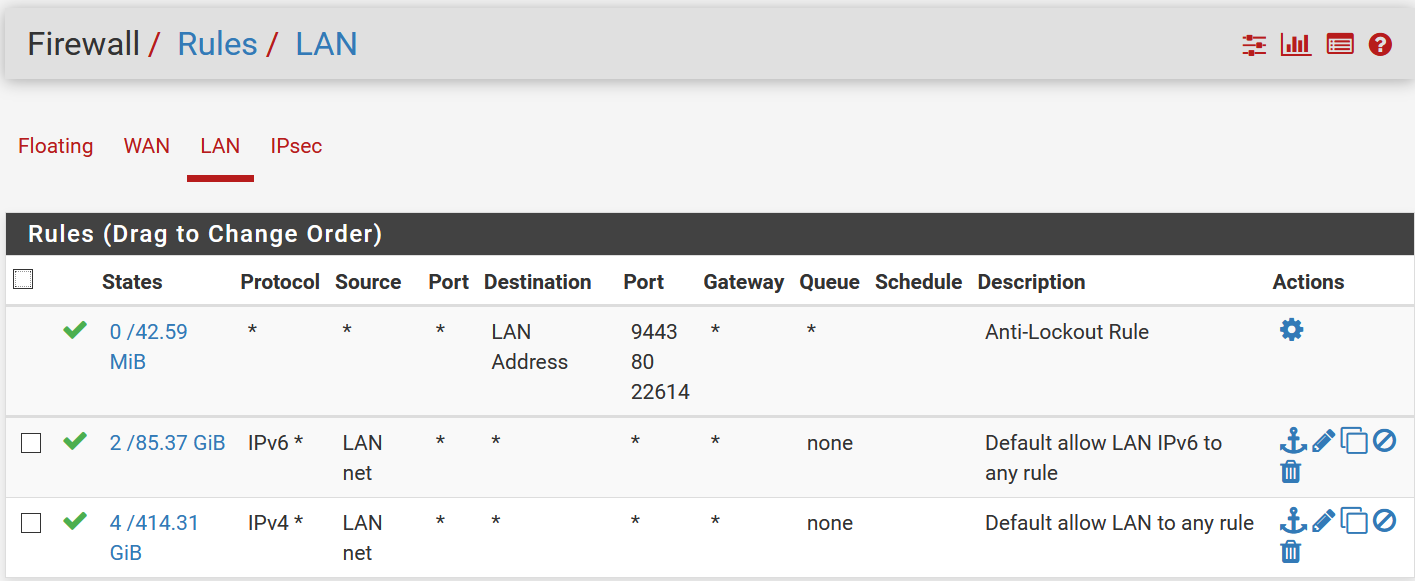
Here are my LAN rules, outgoing is allowed.
-
I can ping the NTP servers from CLI.
-
Lan rules is ok, certainly not an issue.
How about outbound nat?
(if you can ping, most probably no issues there too)
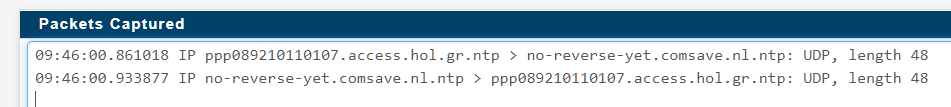
Do you still getting logs with 123 denied? With an allow rule on wan you must be able to capture that traffic no matter what.This is what capture looks
-
I enabled WAN port 123 again, and packet captured while running
ntpq -pfrom the command line. Even with WAN rule set there doesn't seem to be any action on packet capture.

Here's outbound NAT, it may show an automatic rule vestige of my failed VLAN attempt. 192.168.2.0 I think is a leftover VLAN, while my LAN is 192.168.1.0.
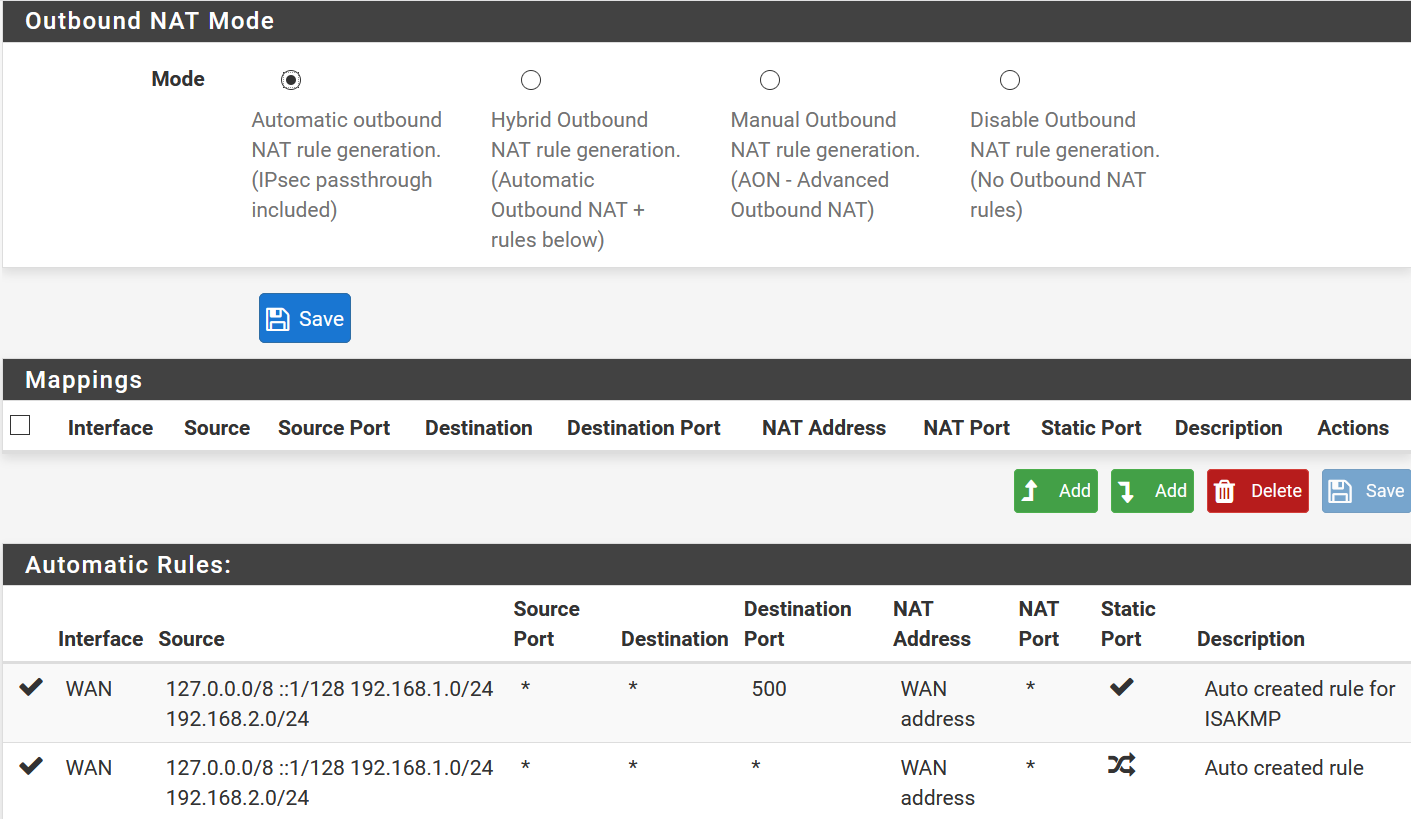
I am not seeing any port 123 blocks in the firewall logs. States shows port 123 activity.
-
Well, since you see states, with 76 bytes on your wan, then you are getting ntp packets..
So no firewall is blocking anything. You should be able to capture them too.
Try it via the web interface, diagnostics packet capture.What is status/ntp say and what is in status/system logs/ntp ?
Also enable all logging options in services/ntp
I guess you have tried rebooting, as a last resort. -
it worked this time, packet capture that is
10:06:52.522715 IP 76.126.xxx.xxx.123 > 4.53.160.75.123: UDP, length 48
10:06:52.554326 IP 4.53.160.75.123 > 76.126.xxx.xxx.123: UDP, length 48
10:06:53.523242 IP 76.126.xxx.xxx.123 > 185.215.224.214.123: UDP, length 48
10:06:53.523260 IP 76.126.xxx.xxx.123 > 192.81.135.252.123: UDP, length 48
10:06:53.532481 IP 192.81.135.252.123 > 76.126.xxx.xxx.123: UDP, length 48
10:06:53.534081 IP 185.215.224.214.123 > 76.126.xxx.xxx.123: UDP, length 48
10:06:54.523411 IP 76.126.xxx.xxx.123 > 50.212.98.107.123: UDP, length 48
10:06:54.580536 IP 50.212.98.107.123 > 76.126.xxx.xxx.123: UDP, length 48
10:06:55.523635 IP 76.126.xxx.xxx.123 > 192.81.135.252.123: UDP, length 48
10:06:55.533074 IP 192.81.135.252.123 > 76.126.xxx.xxx.123: UDP, length 48
10:06:56.527876 IP 76.126.xxx.xxx.123 > 4.53.160.75.123: UDP, length 48
10:06:56.527882 IP 76.126.xxx.xxx.123 > 209.50.63.74.123: UDP, length 48
10:06:56.527887 IP 76.126.xxx.xxx.123 > 45.63.54.13.123: UDP, length 48
10:06:56.533229 IP 209.50.63.74.123 > 76.126.xxx.xxx.123: UDP, length 48
10:06:56.539392 IP 45.63.54.13.123 > 76.126.xxx.xxx.123: UDP, length 48
10:06:56.556456 IP 4.53.160.75.123 > 76.126.xxx.xxx.123: UDP, length 48
10:06:57.526188 IP 76.126.xxx.xxx.123 > 192.81.135.252.123: UDP, length 48
10:06:57.526195 IP 76.126.xxx.xxx.123 > 44.190.6.254.123: UDP, length 48
10:06:57.531438 IP 44.190.6.254.123 > 76.126.xxx.xxx.123: UDP, length 48
10:06:57.531588 IP 192.81.135.252.123 > 76.126.xxx.xxx.123: UDP, length 48
10:06:58.524430 IP 76.126.xxx.xxx.123 > 4.53.160.75.123: UDP, length 48
10:06:58.556095 IP 4.53.160.75.123 > 76.126.xxx.xxx.123: UDP, length 48
10:06:59.522822 IP 76.126.xxx.xxx.123 > 192.81.135.252.123: UDP, length 48
10:06:59.522833 IP 76.126.xxx.xxx.123 > 159.203.158.197.123: UDP, length 48
10:06:59.529147 IP 192.81.135.252.123 > 76.126.xxx.xxx.123: UDP, length 48
10:06:59.571784 IP 159.203.158.197.123 > 76.126.xxx.xxx.123: UDP, length 48
10:07:00.522475 IP 76.126.xxx.xxx.123 > 4.53.160.75.123: UDP, length 48
10:07:00.551285 IP 4.53.160.75.123 > 76.126.xxx.xxx.123: UDP, length 48
10:07:01.524139 IP 76.126.xxx.xxx.123 > 192.81.135.252.123: UDP, length 48
10:07:01.524151 IP 76.126.xxx.xxx.123 > 162.159.200.1.123: UDP, length 48
10:07:01.533563 IP 162.159.200.1.123 > 76.126.xxx.xxx.123: UDP, length 48
10:07:01.533960 IP 192.81.135.252.123 > 76.126.xxx.xxx.123: UDP, length 48
10:07:02.527698 IP 76.126.xxx.xxx.123 > 4.53.160.75.123: UDP, length 48
10:07:02.556506 IP 4.53.160.75.123 > 76.126.xxx.xxx.123: UDP, length 48
10:07:03.530844 IP 76.126.xxx.xxx.123 > 192.81.135.252.123: UDP, length 48
10:07:03.536242 IP 192.81.135.252.123 > 76.126.xxx.xxx.123: UDP, length 48
10:07:04.528000 IP 76.126.xxx.xxx.123 > 4.53.160.75.123: UDP, length 48
10:07:04.528013 IP 76.126.xxx.xxx.123 > 72.87.88.203.123: UDP, length 48
10:07:04.556810 IP 4.53.160.75.123 > 76.126.xxx.xxx.123: UDP, length 48
10:07:04.574781 IP 72.87.88.203.123 > 76.126.xxx.xxx.123: UDP, length 48
10:07:05.530521 IP 76.126.xxx.xxx.123 > 192.81.135.252.123: UDP, length 48
10:07:05.536805 IP 192.81.135.252.123 > 76.126.xxx.xxx.123: UDP, length 48
10:07:06.523536 IP 76.126.xxx.xxx.123 > 4.53.160.75.123: UDP, length 48
10:07:06.552973 IP 4.53.160.75.123 > 76.126.xxx.xxx.123: UDP, length 48
10:07:07.523388 IP 76.126.xxx.xxx.123 > 66.228.58.20.123: UDP, length 48
10:07:07.563108 IP 66.228.58.20.123 > 76.126.xxx.xxx.123: UDP, length 48
10:07:08.525179 IP 76.126.xxx.xxx.123 > 45.76.244.193.123: UDP, length 48
10:07:08.525183 IP 76.126.xxx.xxx.123 > 104.194.8.227.123: UDP, length 48
10:07:08.538954 IP 104.194.8.227.123 > 76.126.xxx.xxx.123: UDP, length 48
10:07:08.542720 IP 45.76.244.193.123 > 76.126.xxx.xxx.123: UDP, length 48
NTP status is still bad
Network Time Protocol Status Pool Placeholder pool.ntp.org .POOL. 16 p - 64 0 0.000 0.000 0.000 Pool Placeholder 0.pfsense.pool. .POOL. 16 p - 64 0 0.000 0.000 0.000 Unreach/Pending 45.76.244.193 216.239.35.0 2 u 8 64 377 18.508 3894306 232734. Unreach/Pending 198.60.22.240 .XMIS. 1 u 6 64 377 14.489 3894322 232993. Unreach/Pending 66.228.58.20 198.72.72.10 3 u 12 64 377 33.938 3894276 230345. Unreach/Pending 50.212.98.107 209.50.63.74 3 u 22 64 377 58.577 3894199 228598. Unreach/Pending 159.203.158.197 128.59.0.245 2 u 20 64 377 50.835 3894214 228293. Unreach/Pending 208.67.72.43 152.2.133.55 2 u 4 64 377 47.912 3894337 229180. Unreach/Pending 104.236.116.147 128.59.0.245 2 u 3 64 377 45.172 3894345 231712. Unreach/Pending 68.233.45.146 132.163.96.1 2 u 5 64 271 46.219 3894330 303620. Unreach/Pending 162.159.200.1 10.4.0.166 3 u 17 64 77 8.466 3894237 196053. Unreach/Pending 45.63.54.13 98.152.165.38 2 u 20 64 37 11.729 3894214 170106. Unreach/Pending 185.215.224.214 164.67.62.194 2 u 20 64 37 12.150 3894214 171169. Unreach/Pending 44.190.6.254 127.67.113.92 2 u 23 64 37 5.146 3894191 166467. Unreach/Pending 209.50.63.74 198.60.22.240 2 u 22 64 37 6.787 3894198 168655. Unreach/Pending 4.53.160.75 142.66.101.13 2 u 22 64 17 29.953 3894199 133965. Unreach/Pending 192.81.135.252 .PHC0. 1 u 20 64 17 8.279 3894214 136273. Unreach/Pending 163.237.218.19 .GPS. 1 u 23 64 7 31.696 3894191 92463.5 Unreach/Pending 72.5.72.15 216.218.254.202 2 u 37 64 3 14.127 3894083 49288.6 Unreach/Pending 69.10.161.7 195.205.216.85 3 u 28 64 1 13.803 3894152 5098.69 -
Isn't the outbound NAT table auto rules a bit suspicious with the extra subnet?
-
@netblues said in wrong date and time:
Well, since you see states, with 76 bytes on your wan, then you are getting ntp packets..
Doesn't states show I'm sending NTP, not receiving?
-
@lifespeed 76/76 means 76 send 76 received... so you are receiving
No, nat is not suspicius.. Move the tab to manual, delete everything and rehit auto.
(i suppose you don't have any manual entries)
it should create new ones without the stale vlan.And in your capture there are packets traveling both ways too.
Post the ntp log from system logs, and restart ntp service
-
Here are the NTP logs, it don't know why it isn't working. Rebooting modem and router now.
Advanced Log Filter Last 1000 NTP Log Entries. (Maximum 1000) May 18 19:53:12 ntpd 59428 184.105.182.15 local addr 76.126.123.72 -> <null> May 18 19:53:12 ntpd 59428 184.105.182.15 0012 82 demobilize assoc 13354 May 18 19:53:12 ntpd 59428 184.105.182.15 1015 85 restart timeout May 18 19:53:05 ntpd 59428 72.14.183.239 local addr 76.126.123.72 -> <null> May 18 19:53:05 ntpd 59428 72.14.183.239 0012 82 demobilize assoc 13353 May 18 19:53:05 ntpd 59428 72.14.183.239 1015 85 restart timeout May 18 19:52:31 ntpd 59428 162.159.200.1 0014 84 reachable May 18 19:52:30 ntpd 59428 50.205.244.114 0014 84 reachable May 18 19:52:28 ntpd 59428 193.29.63.150 0014 84 reachable May 18 19:52:28 ntpd 59428 66.85.78.80 0014 84 reachable May 18 19:52:27 ntpd 59428 50.205.244.114 0011 81 mobilize assoc 13370 May 18 19:52:27 ntpd 59428 Soliciting pool server 50.205.244.114 May 18 19:52:26 ntpd 59428 162.159.200.1 0011 81 mobilize assoc 13369 May 18 19:52:26 ntpd 59428 Soliciting pool server 162.159.200.1 May 18 19:52:25 ntpd 59428 66.85.78.80 0011 81 mobilize assoc 13368 May 18 19:52:25 ntpd 59428 Soliciting pool server 66.85.78.80 May 18 19:52:24 ntpd 59428 193.29.63.150 0011 81 mobilize assoc 13367 May 18 19:52:24 ntpd 59428 Soliciting pool server 193.29.63.150 May 18 19:52:00 ntpd 59428 108.61.73.244 local addr 76.126.123.72 -> <null> May 18 19:52:00 ntpd 59428 108.61.73.244 0012 82 demobilize assoc 13352 May 18 19:52:00 ntpd 59428 108.61.73.244 1015 85 restart timeout -
The first time I rebooted it didn't successfully pull WAN addresses. This has been an ongoing problem I haven't been able to get to the bottom of. I think something is not right. The second time I rebooted pfSense got IPv4 and IPv6 addresses. The pfSense time is correct, and logs indicate correct NTP function from the command line below:
[2.4.4-RELEASE][admin@pfSense.****.com]/root: ntpq -p remote refid st t when poll reach delay offset jitter ============================================================================== pool.ntp.org .POOL. 16 p - 64 0 0.000 0.000 0.000 0.pfsense.pool. .POOL. 16 p - 64 0 0.000 0.000 0.000 *darwin.kenyonra 127.67.113.92 2 u 34 64 17 10.082 -2.230 1.710 -138.68.46.177 ( 75.229.16.214 2 u 2 64 17 9.987 1.013 0.939 +time.nullrouten 132.163.97.1 2 u 39 64 7 9.044 -3.925 1.900 -199.102.46.78 ( .GPS. 1 u 35 64 17 61.247 -5.941 1.874 -propjet.latt.ne 44.24.199.34 3 u 5 64 17 8.257 -1.943 1.932 -ntp.backplanedn 152.2.133.52 2 u 2 64 37 73.067 2.159 3.191 +srcf-ntp.stanfo 171.64.7.67 2 u - 64 37 9.630 -3.785 3.360 -four10.gac.edu 216.218.254.202 2 u 7 64 17 57.639 -2.478 2.003 -
And here is after I disabled the unneeded WAN port 123 access rule.
[2.4.4-RELEASE][admin@pfSense.****.com]/root: ntpq -p remote refid st t when poll reach delay offset jitter ============================================================================== pool.ntp.org .POOL. 16 p - 64 0 0.000 0.000 0.000 0.pfsense.pool. .POOL. 16 p - 64 0 0.000 0.000 0.000 +darwin.kenyonra 127.67.113.92 2 u 39 64 377 10.082 -2.230 2.741 -138.68.46.177 ( 75.229.16.214 2 u 6 64 377 10.215 1.595 1.244 +time.nullrouten 132.163.97.1 2 u 40 64 177 9.150 -0.587 2.268 -199.102.46.78 ( .GPS. 1 u 37 64 377 61.484 -4.489 1.951 +propjet.latt.ne 44.24.199.34 3 u 13 64 377 8.634 -2.014 1.266 -ntp.backplanedn 152.2.133.52 2 u 6 64 377 73.025 3.572 2.601 *srcf-ntp.stanfo 171.64.7.67 2 u 4 64 377 9.997 -1.991 2.168 -four10.gac.edu 216.218.254.202 2 u 10 64 377 57.894 -4.448 2.532 -
I've got a problem with this booting and pulling WAN addresses, maybe the time zone was a manifestation of the problem.
Trimmed system logs for the appropriate times below. Any help identifying where to look for this unreliable behavior at startup, I would be most grateful.
May 18 19:56:22 - power down and back on. This is not successful, doesn't get an address.
May 23 16:04:55 - power down and back on, successfully gets WAN addresses.
The log is attached as plain text.
logs failed WAN address then successful sanitized.txt -
What is THAT???
May 23 16:04:39 pfSense php-fpm[82541]: /rc.newwanip: pfSense package system has detected an IP change or dynamic WAN reconnection - 76.126.xxx.xxx -> 192.168.100.10 - Restarting packages.
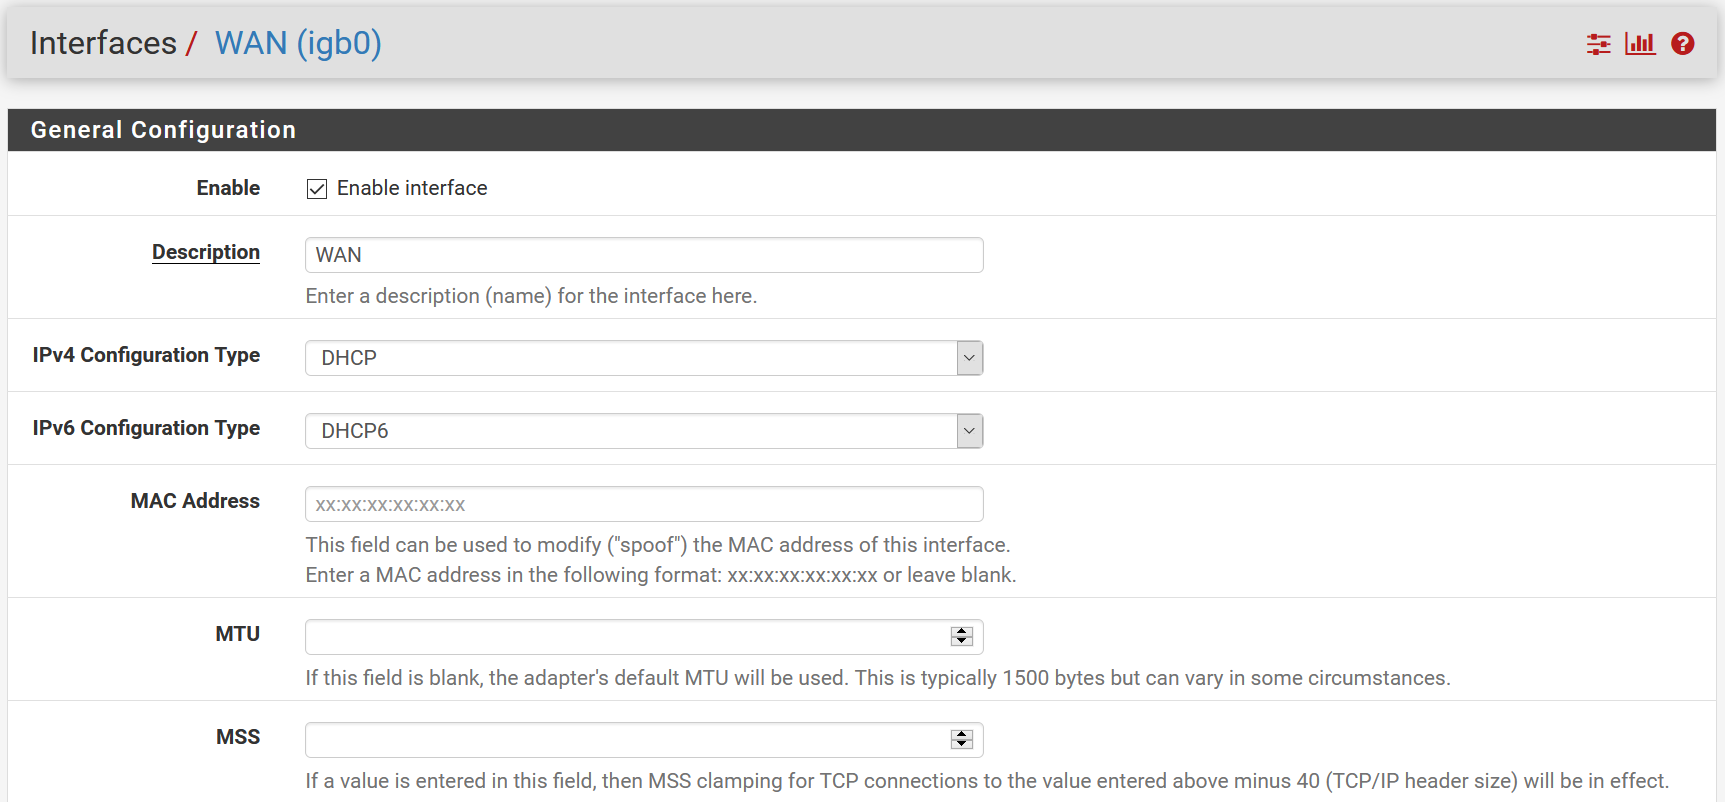
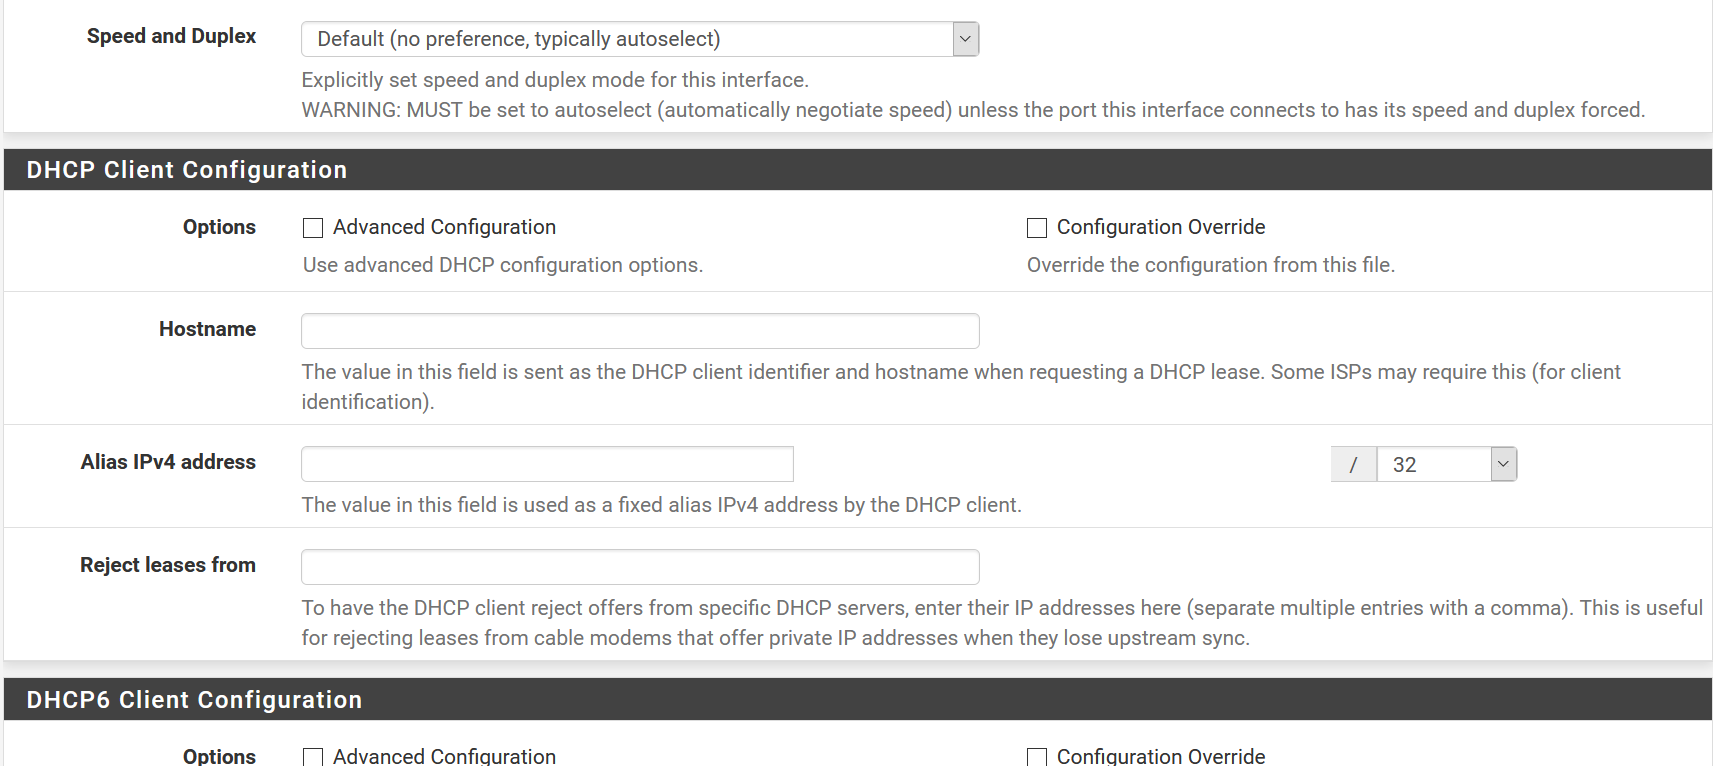
Please post your wan interface configuration. Is it dhcp? Where did this 192.168.100.10 come from?
Also describe your wan setup -
LOL, thanks for sticking with me and sorry about the huge log, I tried to keep it down to the relevant events. Something is wrong, maybe the NTP time was just a symptom of problems elsewhere.
pfSense WAN is Intel 1Gb Ethernet -> Netgear CM1000 cable modem -> Comcast, while the LAN is 10Gb SFP+ -> Ubiquiti US-16-XG switch
Good catch on the 192.168.100.10 traffic. 76.126.xxx.xxx is pfSense WAN, 192.168.100.1 is the web GUI for the cable modem, so my guess it is the cable modem.
-
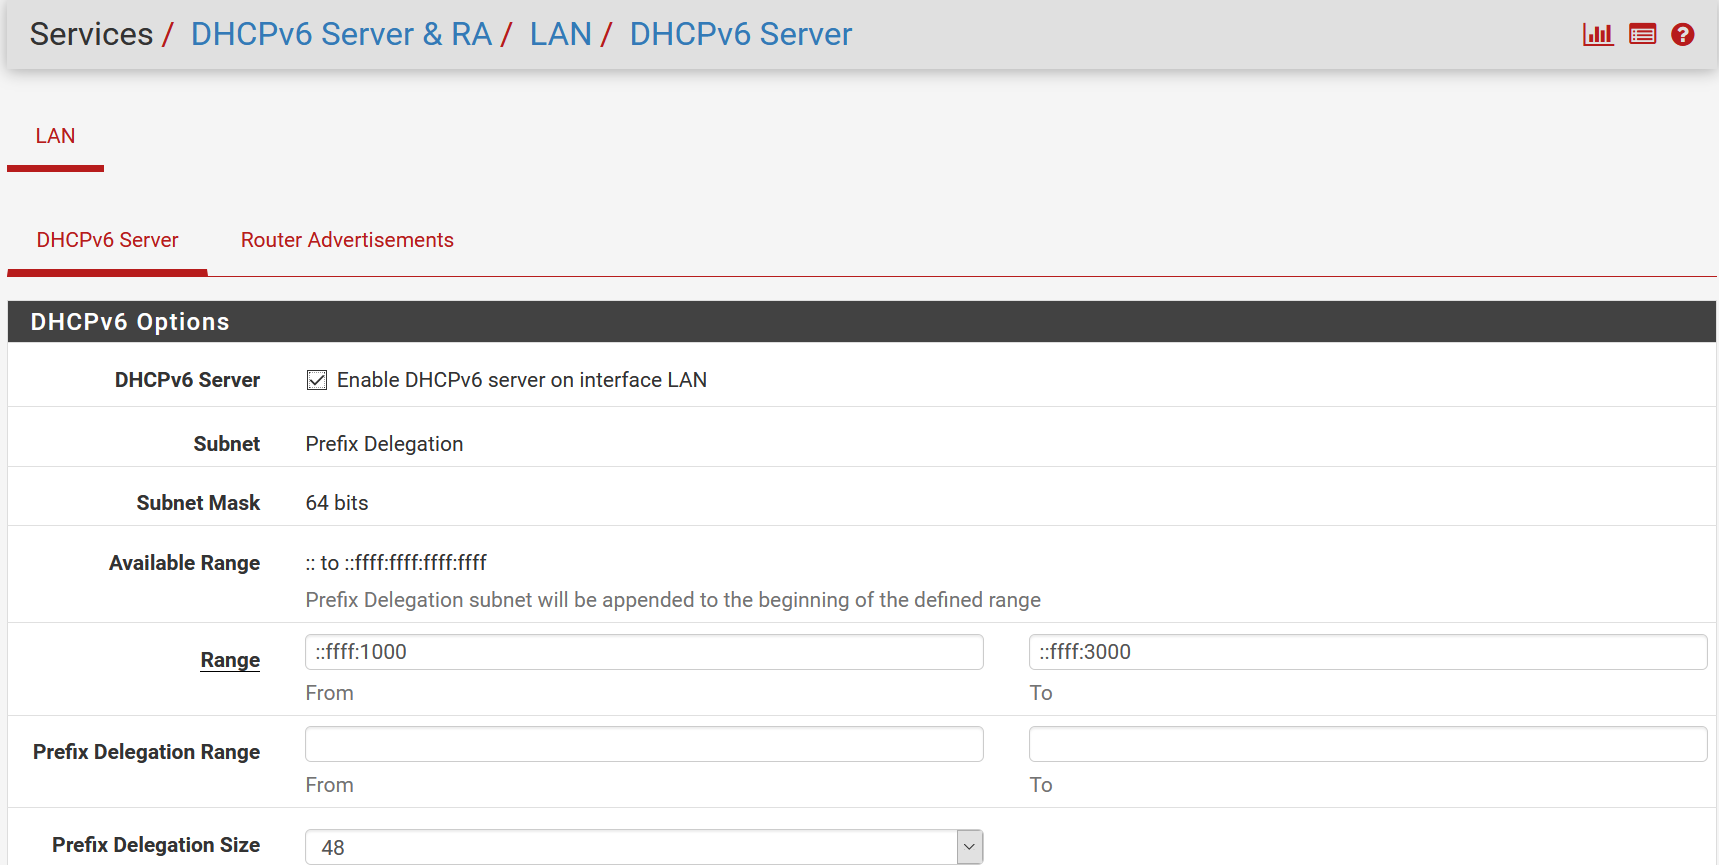
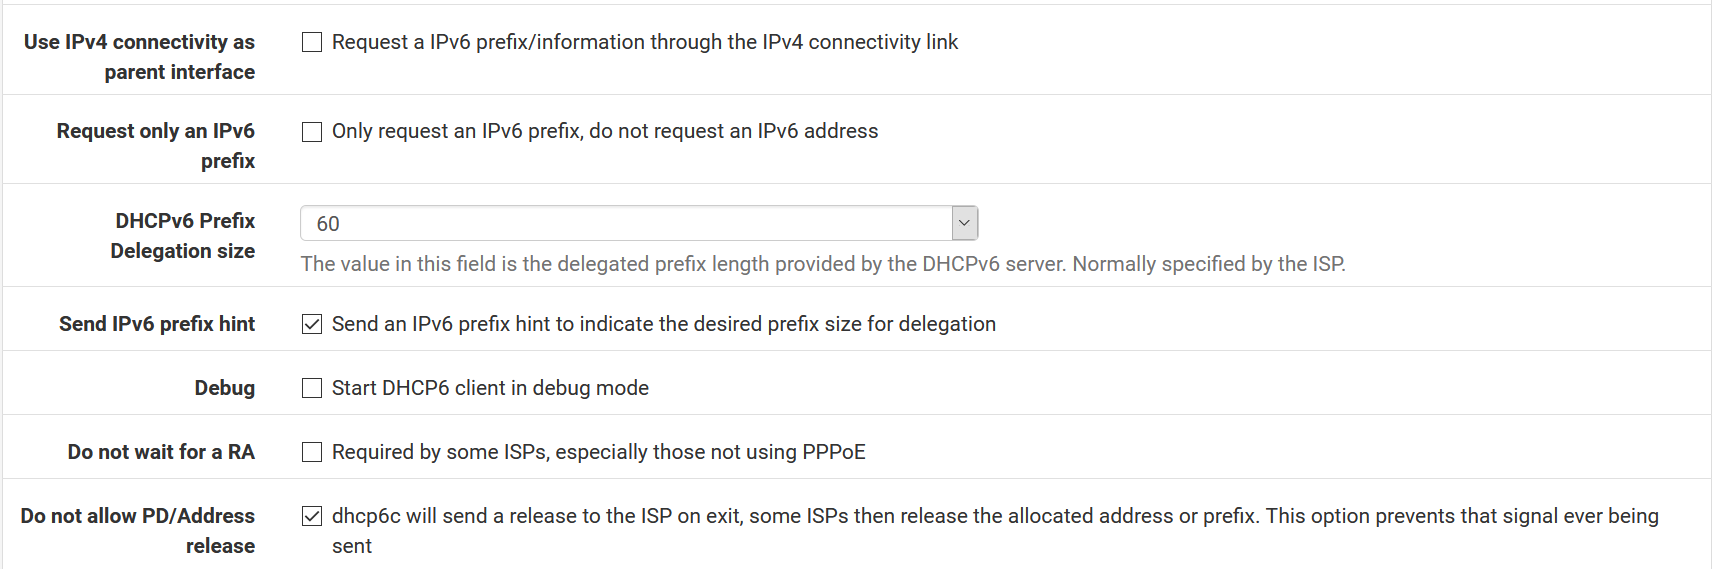
Do I need an "allow all" rule for the cable modem WAN? I don't recall any specific WAN configuration other than telling pfSense ixl2 physical interface, and IPv6 prefix delegation.
-
-
I see I don't have prefix delegation on the WAN side checked. Even though I'm using it in the LAN. I've been over this setup before though, probably there is a reason it is unchecked. Will give this a try.