Netgate Discussion Forum
    • Categories
    • Recent
    • Tags
    • Popular
    • Users
    • Search
    • Register
    • Login

    Grafana Dashboard using Telegraf with additional plugins

    Scheduled Pinned Locked Moved pfSense Packages
    173 Posts 28 Posters 70.7k Views
    Loading More Posts
    • Oldest to Newest
    • Newest to Oldest
    • Most Votes
    Reply
    • Reply as topic
    Log in to reply
    This topic has been deleted. Only users with topic management privileges can see it.
    • V
      veldthui @VictorRobellini
      last edited by

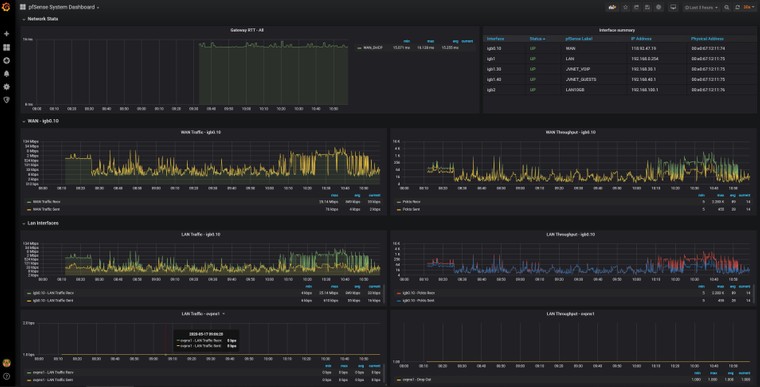
      Attached is an image of the lower part which should show the WAN and LANs. It shows the WAN but does not look right and does not show the correct LANs
      pfSense.jpg

      V 1 Reply Last reply Reply Quote 0
      • V
        VictorRobellini @veldthui
        last edited by

        @veldthui Can you share how you have the interfaces defined in the grafana variable config?

        V 1 Reply Last reply Reply Quote 0
        • V
          veldthui @VictorRobellini
          last edited by

          @VictorRobellini Okay I worked out that the WAN only had one of the values multiplied by 8 to change it to bytes. Changed the other and it looks okay now.

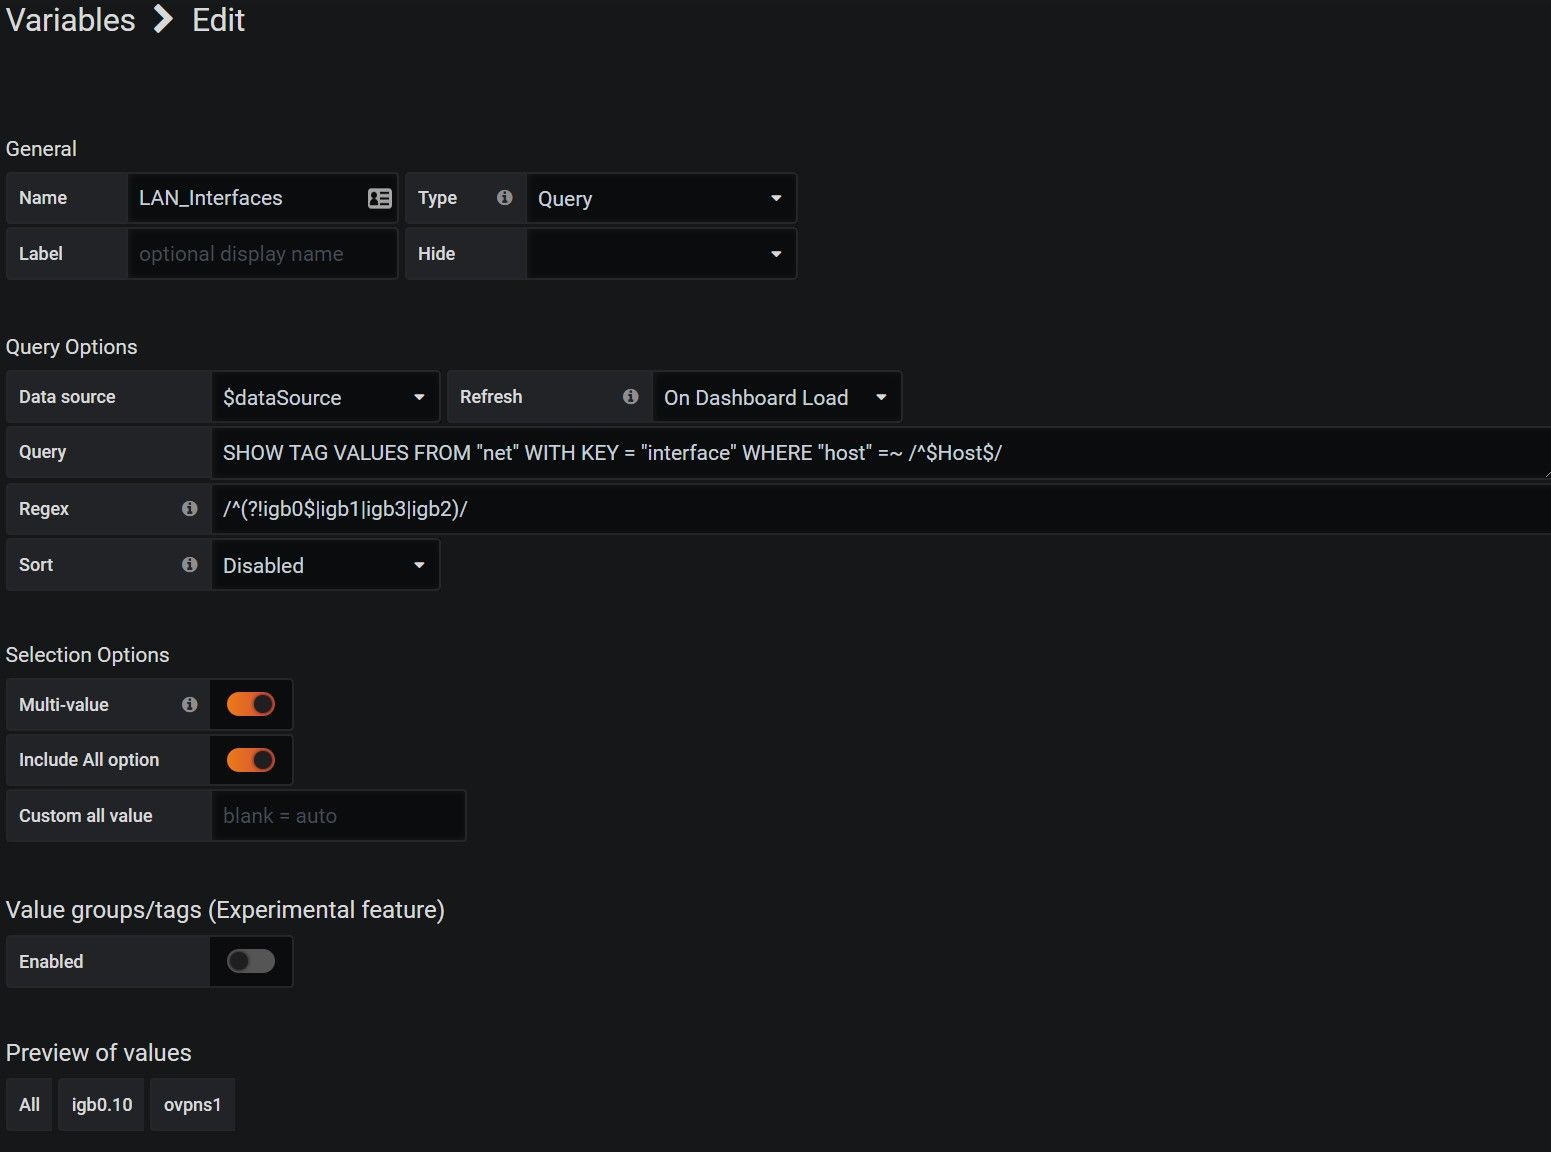
          Below is the definition which is how it was downloaded. If I add a $ to igb1, igb2, and igb3 I can then see the igb1.30 and igb1.40 networks but not igb1 and igb0.10 should not be in the list as that is the WAN.
          pfSense1.jpg

          V 1 Reply Last reply Reply Quote 0
          • V
            VictorRobellini @veldthui
            last edited by VictorRobellini

            @veldthui said in Grafana Dashboard using Telegraf with additional plugins:

            What is your Regex?
            What adapter(s) is your WAN?
            What adapters to you want displayed?

            Please take a look at the github page. There's plenty written up in the Readme

            V 1 Reply Last reply Reply Quote 0
            • V
              veldthui @VictorRobellini
              last edited by

              @VictorRobellini

              The regex is as above. My WAN is on the IGB0 adapter as VLAN 10 which shows as igb0.10.

              I want to display this as the WAN which it is doing. For the LAN I want to display igb1, igb1.30, igb1.40, and igb2.
              igb3 and igb4 are not in use at present but may be in future. I have read the readme file but it does not explain it very well. I have only very basic understanding of regex as well

              V 1 Reply Last reply Reply Quote 0
              • V
                VictorRobellini @veldthui
                last edited by

                @veldthui said in Grafana Dashboard using Telegraf with additional plugins:
                The content of the "Regex" field is the same as what I have posted to github and it does not match what you are saying.
                Please review the content on Github, specifically the section titled, Configuration
                If the instructions are unclear, please let me know what I can add to make them better.

                V 1 Reply Last reply Reply Quote 0
                • V
                  veldthui @VictorRobellini
                  last edited by

                  @VictorRobellini

                  Okay I think I have finally worked it out. my regex now looks like /^(?!igb0)/ to filter out everything on igb0 and leave the rest showing. Appears to have worked.
                  Thanks for the help.

                  1 Reply Last reply Reply Quote 1
                  • O
                    oldfart
                    last edited by

                    any chance of an idiots guide (me = dummy) to installing this lot?
                    Tried from your Github page and first problem was the docker-compose example threw errors. So gave up.

                    V 1 Reply Last reply Reply Quote 0
                    • V
                      VictorRobellini @oldfart
                      last edited by

                      @oldfart The docker-compose is just a quick way to setup influx and grafana using docker and docker-compose. There are tutorials on the internet that show how to set this up, a quick google search will turn up plenty of resources, for example: https://www.homelabrat.com/influxdb-homelab-dashboard/

                      O A 2 Replies Last reply Reply Quote 0
                      • O
                        oldfart @VictorRobellini
                        last edited by

                        @VictorRobellini 👍

                        1 Reply Last reply Reply Quote 0
                        • A
                          anx @VictorRobellini
                          last edited by

                          @VictorRobellini Basically this link covers all needed components setup ?

                          1 Reply Last reply Reply Quote 0
                          • A
                            anx
                            last edited by

                            Hi Guys,

                            I have built pfsense with grafana etc. However I am trying to figure it out how to setup addons,

                            https://forum.netgate.com/topic/152132/grafana-dashboard-using-telegraf-with-additional-plugins

                            "Does /usr/local/bin/python3.7 exist on your pfSense system? If so, use this telegraf_gateways-3.7.py"

                            How could I upload this file to pfesense? as I do not see it in pfsense file hierarchy. Thanks for help

                            1 Reply Last reply Reply Quote 0
                            • J
                              JohnKap
                              last edited by

                              @anx

                              "Does /usr/local/bin/python3.7 exist on your pfSense system? If so, use this telegraf_gateways-3.7.py"

                              The addons can be downloaded from the repo - look under plugins. https://github.com/VictorRobellini/pfSense-Dashboard

                              How could I upload this file to pfesense? as I do not see it in pfsense file hierarchy. Thanks for help

                              use an FTP program - my preference is Filezilla.

                              Make sure you set the permissions as per instructions - https://github.com/VictorRobellini/pfSense-Dashboard#plugins

                              1 Reply Last reply Reply Quote 1
                              • B
                                bigjohns97
                                last edited by

                                Looks like this is still working under the new P1 release - just a heads up! :)

                                1 Reply Last reply Reply Quote 1
                                • K
                                  kapvcop
                                  last edited by

                                  Hi, my dears friends, i´m searching for a visualizer or dashboard
                                  to view live firewall activity.

                                  Does this tool or utility exist?

                                  thanks

                                  Grafana its like a dashboard to see Active Users
                                  Uptime
                                  CPU Load total
                                  Disk Utilization
                                  Memory Utilization
                                  CPU Utilization per core (Single Graph)
                                  Ram Utilization time graph
                                  Load Average
                                  Load Average Graph
                                  CPU and ACPI Temperature Sensors
                                  pfBlocker IP Stats
                                  pfBlocker DNS Stats
                                  Gateway Response time - dpinger
                                  List of interfaces with IP, MAC, Status and pfSesnse labels thanks to /u/trumee
                                  WAN Statistics - Traffic & Throughput (Identified by dashboard variable)
                                  LAN Statistics - Traffic & Throughput (Identified by dashboard variable)
                                  Unbound stats - Plugin and config included and working but not implemented

                                  1 Reply Last reply Reply Quote 0
                                  • V
                                    VictorRobellini
                                    last edited by

                                    I would highly suggest reading the linked github page on the initial post and then reforming your question.

                                    1 Reply Last reply Reply Quote 1
                                    • E
                                      erbalo
                                      last edited by

                                      First of all really love your tutorial and work, i have installed all of the stuff, receiving data in influxDB and connected to Grafana and added dashboard.

                                      But,

                                      I am not receiving data from pfblocker, i see such as dnsbl log on influxdb but when i expand that o don't see anyting. I am using pfblocker-ng Devel

                                      On the Grafana dashboard i see only data from Disk Utlizization. On influxDB i see well CPU/Memory etc..

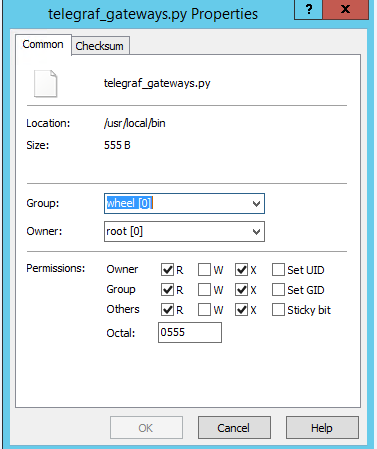
                                      I have uploaded the telegraf plugins using Wincp and gived 0555 permissions using Wincscp.

                                      What is really my problem too look up?

                                      V 1 Reply Last reply Reply Quote 0
                                      • V
                                        VictorRobellini @erbalo
                                        last edited by

                                        @erbalo Please review the troubleshooting section that's posted on GitHub

                                        1 Reply Last reply Reply Quote 0
                                        • E
                                          erbalo
                                          last edited by

                                          Is this correct? I did gived the permission via WinSCP.
                                          2bae2d0e-27a3-49e6-9a28-8185feadfe7e-afbeelding.png

                                          Also i don't get the Downloads/Uploads state.

                                          B 1 Reply Last reply Reply Quote 0
                                          • B
                                            bigjohns97 @erbalo
                                            last edited by

                                            @erbalo You need to enable logging using the instructions on the github link above and it should point you in the right direction.

                                            E 1 Reply Last reply Reply Quote 1
                                            • First post
                                              Last post
                                            Copyright 2025 Rubicon Communications LLC (Netgate). All rights reserved.